
PDF (119 KB)
FEDERAL RESERVE SYSTEM
[Docket No. OP-1299]
Federal Reserve Bank Services
AGENCY: Board of Governors of the Federal Reserve System.
ACTION: Notice.
SUMMARY: The Board has approved the private sector adjustment factor (PSAF) for 2008 of $113.1 million and the 2008 fee schedules for Federal Reserve priced services and electronic access. These actions were taken in accordance with the requirements of the Monetary Control Act of 1980, which requires that, over the long run, fees for Federal Reserve priced services be established on the basis of all direct and indirect costs, including the PSAF. The Board has also approved maintaining the current earnings credit rate on clearing balances.
DATES: The new fee schedules and earnings credit rate become effective January 2, 2008.
FOR FURTHER INFORMATION CONTACT: For questions regarding the fee schedules: Jack K. Walton II, Associate Director, (202/452-2660); Jeffrey S.H. Yeganeh, Manager, Retail Payments, (202/728-5801); Edwin J. Lucio, Senior Financial Services Analyst, (202/736-5636), Division of Reserve Bank Operations and Payment Systems. For questions regarding the PSAF and earnings credits on clearing balances: Gregory L. Evans, Assistant Director, (202/452-3945); Brenda L. Richards, Manager, Financial Accounting, (202/452-2753); or Jonathan Senner, Senior Financial Analyst, (202/452-2042), Division of Reserve Bank Operations and Payment Systems. For users of Telecommunications Device for the Deaf (TDD) only, please call 202/263-4869. Copies of the 2008 fee schedules for the check service are available from the Board, the Federal Reserve Banks, or the Reserve Banks' financial services web site at www.frbservices.org.
SUPPLEMENTARY INFORMATION:
I. PRIVATE SECTOR ADJUSTMENT FACTOR AND PRICED SERVICES
A. Overview--Each year, as required by the Monetary Control Act of 1980, the Reserve Banks set fees for priced services provided to depository institutions. These fees are set to recover, over the long run, all direct and indirect costs and imputed costs, including financing costs, taxes, and certain other expenses, as well as the return on equity (profit) that would have been earned if a private business firm provided the services. The imputed costs and imputed profit are collectively referred to as the PSAF. Similarly, investment income is imputed and netted with related direct costs associated with clearing balances to estimate net income on clearing balances (NICB). From 1997 through 2006, the Reserve Banks recovered 99.0 percent of their total expenses (including special project costs and imputed expenses) and targeted after-tax profits or return on equity (ROE) for providing priced services.1
Table 1 summarizes 2006, 2007 estimated, and 2008 budgeted cost recovery rates for all priced services. Cost recovery is estimated to be 101.5 percent in 2007 and budgeted to be 101.1 percent in 2008. The check service accounts for approximately 80 percent of the total cost of priced services and thus significantly influences the aggregate cost recovery rate. The electronic services (FedACH®, the Fedwire® Funds Service and National Settlement Service (NSS), and the Fedwire® Securities Service) account for approximately 20 percent of total costs.2
Table 1
Aggregate Priced Services Pro Forma Cost and Revenue Performancea
($ millions)
| Year | 1b Revenue |
2c Total Expense |
3 Net Income (ROE) [1-2] |
4d Target ROE |
5e Recovery Rate After Target ROE [1/(2+4)] |
|---|---|---|---|---|---|
| 2006 | 1,031.2 | 875.5 | 155.7 | 72.0 | 108.8% |
| 2007 (estimate) | 1,015.1 | 920.0 | 95.1 | 80.4 | 101.5% |
| 2008 (budget) | 897.1 | 821.3 | 75.8 | 66.5 | 101.1% |
a. Calculations in this table and subsequent pro forma cost and revenue tables may be affected by rounding. Return to text.
b. Revenue includes net income on clearing balances. Clearing balances are assumed to be invested in a broad portfolio of investments, such as short-term Treasury securities, government agency securities, commercial paper, long-term corporate bonds, and money market funds. To impute income, a constant spread is determined from the historical average return on this portfolio and applied to the rate used to determine the cost of clearing balances. NICB equals the imputed income from these investments less earnings credits granted to holders of clearing balances. The cost of earnings credits is based on the discounted three-month Treasury bill rate. Return to text.
c. The calculation of total expense includes operating, imputed, and other expenses. Imputed and other expenses include taxes, FDIC insurance, Board of Governors' priced services expenses, the cost of float, and interest on imputed debt, if any. Credits or debits related to the accounting for pensions under FAS 87 are also included. Return to text.
d. Target ROE is the after-tax ROE included in the PSAF. Return to text.
e. The recovery rates in this and subsequent tables do not reflect the unamortized gains or losses that must be recognized in accordance with FAS 158. Including these gains or losses, the recovery rate would have been 79.9 percent for 2006 and is estimated to be 103.0 percent for 2007. Future gains or losses, and their effect on cost recovery, cannot be projected. Return to text.
Table 2 presents an overview of the 2006, 2007 budgeted, 2007 estimated, and 2008 budgeted cost recovery performance by priced service.
| Priced Service | 2006 | 2007 Budget | 2007 Estimate | 2008 Budgeta |
|---|---|---|---|---|
| All services | 108.8 | 101.9 | 101.5 | 101.1 |
| Check | 109.3 | 101.8 | 100.4 | 100.3 |
| FedACH | 104.3 | 102.5 | 105.8 | 102.0 |
| Fedwire Funds and NSS | 111.4 | 102.5 | 107.0 | 105.5 |
| Fedwire Securities | 104.5 | 101.9 | 103.5 | 105.0 |
a. 2008 budget figures reflect the latest data from the Reserve Banks. The Reserve Banks will transmit final budget data to the Board in November 2007, for Board consideration in December 2007. Return to text.
1. 2007 Estimated Performance--The Reserve Banks estimate that they will recover 101.5 percent of the costs of providing priced services, including imputed expenses and targeted ROE, compared with a budgeted recovery rate of 101.9 percent, as shown in table 2. The Reserve Banks estimate that they will again exceed $1 billion in revenue and that all services will achieve full cost recovery. The Reserve Banks also estimate that they will fully recover actual and imputed expenses and earn net income of $95.1 million, compared with the target of $80.4 million. The greater-than-targeted net income is largely driven by the performance of the check service, which had greater-than-expected volumes of paper return items and Check 21 substitute checks.
The Reserve Banks have continued their efforts to downsize their paper check processing infrastructure as paper check volumes continue to decline nationwide. The Reserve Banks have already reduced the number of sites at which they process checks from forty-five in 2003 to nineteen in 2007 and have announced that they will consolidate to four check processing offices by early 2011. These check restructuring efforts have helped the Reserve Banks to maintain full cost recovery by reducing costs in line with the decline in revenues associated with paper check processing.
2. 2008 Private Sector Adjustment Factor--The 2008 PSAF for Reserve Bank priced services is $113.1 million. This amount represents a decrease of $19.4 million from the 2007 PSAF of $132.5 million. This reduction is primarily the result of decreases in both the amount of imputed equity and in the cost of equity.
3. 2008 Projected Performance--The Reserve Banks project a priced services cost recovery rate of 101.1 percent in 2008. The 2008 fees for priced services are projected to result in a net income of $75.8 million compared with the target of $66.5 million. The major risks to the Reserve Banks' ability to achieve their budgeted targets are higher-than-expected declines in paper check volume as well as increased competition from correspondent banks and other service providers. Other risks include lower-than-expected electronic payments volumes, and costs associated with unanticipated problems with check office restructurings or technological upgrades. In light of these risks, the Reserve Banks will continue to refine their business and operational strategies to improve efficiency and reduce costs and excess capacity. These efforts should position the Reserve Banks to achieve their financial and other payment system objectives and statutory requirements over the long run.
4. 2008 Pricing--The following summarizes the Reserve Banks' changes in fee schedules for priced services in 2008:
- The Reserve Banks will raise the fees for paper forward collection check products 12.1 percent, paper return check products 12.5 percent, and payor bank check products 13.8 percent.
- The Reserve Banks will decrease Check 21 fees for FedForward products delivered to electronic endpoints 3.2 percent and increase Check 21 fees for FedForward products delivered to substitute check endpoints 10.3 percent. The Reserve Banks also will increase the FedReceipt Forward deposit discount by $0.001 for each check presented through FedReceipt products.
- With the 2008 fee changes, the price index for the check service will have increased 75.4 percent since 1998.
- The Reserve Banks will eliminate the input file processing fee.
- With the 2008 fee change, the price index for the FedACH service will have decreased 61.7 percent since 1998.
- The Reserve Banks will decrease the online transfer fee by three cents in the highest-priced tier, two cents in the midpriced tier, and one cent in the lowest-priced tier and increase the volume thresholds for each tier.
- With the 2008 fee changes, the price index for the Fedwire Funds and National Settlement Services will have decreased 51.6 percent since 1998.
- The Reserve Banks will not change prices.
- The price index for the Fedwire Securities Service will have decreased 44.4 percent since 1998.
5. 2008 Price Index--Figure 1 compares indexes of fees for the Reserve Banks' priced services with the GDP price index. Compared with the price index for 2007, the price index for all Reserve Bank priced services is projected to increase 2.7 percent in 2008. The price index for electronic payment services is projected to decrease 8.3 percent in 2008. The price index for paper check services is projected to increase 11.7 percent in 2008. This increase mainly reflects the Reserve Banks' continued efforts to encourage a shift from paper check services to Check 21 products. For the period 1998 to 2008, the price index for all priced services is expected to increase by 35.4 percent. In comparison, from 1998 through 2007, the GDP price index increased 24.3 percent.
FIGURE 1
PRICE INDEXES FOR FEDERAL RESERVE
PRICED SERVICES
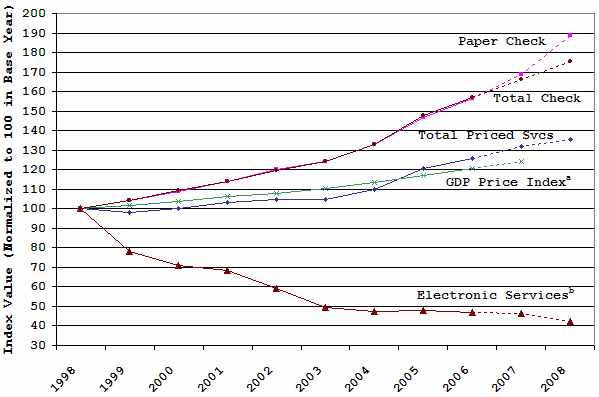
a. Reflects the annualized price change through the first half of 2007.
b. Electronic Services include FedACH, Funds, and Securities Services.
B. Private Sector Adjustment Factor--The method for calculating the financing and equity costs in the PSAF requires determining the appropriate levels of debt and equity to impute and then applying the applicable financing rates. In this process, a pro forma balance sheet using estimated assets and liabilities associated with the Reserve Banks' priced services is developed, and the remaining elements that would exist if these priced services were provided by a private business firm are imputed. The same generally accepted accounting principles that apply to commercial-entity financial statements also apply to the relevant elements in the priced services pro forma financial statements.
The portion of Federal Reserve assets that will be used to provide priced services during the coming year is determined using information on actual assets and projected disposals and acquisitions. The priced portion of these assets is determined based on the allocation of the related depreciation expense. The priced portion of actual Federal Reserve liabilities consists of balances held by Reserve Banks for clearing priced-services transactions (clearing balances), and other liabilities such as accounts payable and accrued expenses.
Long-term debt is imputed only when core clearing balances, long-term liabilities, and equity are not sufficient to fund long-term assets or if the interest rate risk sensitivity analysis, which measures the interest rate effect of the difference between interest rate sensitive assets and liabilities, indicates that a 200 basis point change in interest rates would change cost recovery by more than two percentage points.3 Short-term debt is imputed only when short-term liabilities and clearing balances not used to finance long-term assets are insufficient to fund short-term assets. Imputed equity meets the FDIC requirements for a well-capitalized depository institution for insurance premium purposes and represents the market capitalization, or shareholder value, for Reserve Bank priced services.4
The equity financing rate is the target ROE rate produced by the capital asset pricing model (CAPM). In the CAPM, the required rate of return on a firm's equity is equal to the return on a risk-free asset plus a risk premium. To implement the CAPM, the risk-free rate is based on the three-month Treasury bill; the beta is assumed to equal 1.0, which approximates the risk of the market as a whole; and the monthly returns in excess of the risk-free rate over the most recent 40 years are used as the market risk premium. The resulting ROE influences the dollar level of the PSAF because this is the return a shareholder would expect in order to invest in a private business firm.
For simplicity, given that federal corporate income tax rates are graduated, state income tax rates vary, and various credits and deductions can apply, an actual income tax expense is not calculated for Reserve Bank priced services. Instead, the Board targets a pretax ROE that would provide sufficient income to fulfill its income tax obligations.5 To the extent that actual performance results are greater or less than the targeted ROE, income taxes are adjusted using an imputed income tax rate. Because the Reserve Banks provide similar services through their correspondent banking activities, including payment and settlement services, and the amount of imputed equity meets the FDIC requirements for a well-capitalized depository institution, the imputed income tax rate is the median of the rates paid by the top fifty bank holding companies (BHCs) based on deposit balances over the past five years adjusted to the extent that they invested in tax-free municipal bonds.
The PSAF also includes the estimated priced-services-related expenses of the Board of Governors and imputed sales taxes based on Reserve Bank estimated expenditures. An assessment for FDIC insurance, when required, is imputed based on current FDIC rates and projected clearing balances held with the Reserve Banks.
1. Net Income on Clearing Balances--The NICB calculation is performed each year along with the PSAF calculation and is based on the assumption that the Reserve Banks invest clearing balances net of imputed reserve requirements and balances used to finance priced-services assets. Using these net clearing balance levels, the Reserve Banks impute a constant spread, determined by the return on a portfolio of investments, over the three-month Treasury bill rate.6 The calculation also involves determining the priced-services cost of earnings credits (amounts available to offset service fees) on contracted clearing balances held, net of expired earnings credits, based on a discounted Treasury bill rate. Rates and clearing balance levels used in the NICB estimate are based on the most recent rates and clearing balance levels.7 Because clearing balances are held for clearing priced-services transactions or offsetting priced-services fees, they are directly related to priced services. The net earnings or expense attributed to the investments and the cost associated with holding clearing balances, therefore, are considered net income for priced services.
2. Analysis of the 2008 PSAF--The decrease in the 2008 PSAF is primarily due to an overall reduction in imputed equity and a slight decrease in the required ROE result provided by the CAPM.
Estimated 2008 Federal Reserve assets, reflected in table 3, have decreased $2,279.8 million, mainly due to a decline in items in process of collection of $1,977.2 million. This reduction largely stems from the accelerated collection of items processed in the Check 21 environment.
As shown in table 4, the portion of assets financed with clearing balances has increased. Short-term assets funded with clearing balances total $4.2 million. This figure represents a $6.0 million decline from the short-term assets funded in 2007, a decrease that results from the reduction in estimated short-term receivables. The amount of core clearing balances used to fund long-term assets has increased $68.5 million primarily because of an increase in long-term assets and a lower amount of imputed equity, which also is used to fund long-term assets.
As previously mentioned, clearing balances are available as a funding source for priced-services assets. Table 4 shows that $72.7 million in clearing balances is used to fund priced-services assets in 2008. The interest rate sensitivity analysis in table 5 indicates that a 200-basis-point decrease in interest rates affects the ratio of rate-sensitive assets to rate-sensitive liabilities and decreases cost recovery by 1.5 percentage points, while an increase of 200 basis points in interest rates increases cost recovery by 1.4 percentage points. The established threshold for a change in cost recovery is two percentage points; therefore, interest rate risk associated with using these balances is within acceptable levels and no long-term debt is imputed.
As shown in table 3, the amount of equity imputed for the 2008 PSAF is $628.9 million, a decrease of $114.0 million from the imputed equity for 2007. In accordance with FAS 158, this amount includes an accumulated other comprehensive loss of $328.4 million. The capital to total assets ratio and the capital to risk-weighted assets ratio both meet or exceed the regulatory requirements for a well-capitalized depository institution. Equity is based on 5 percent of total assets, and capital to risk-weighted assets is 10.1 percent.8 Following the final FDIC regulations regarding the assessment of insurance premiums, the Reserve Banks imputed a one-time priced services assessment credit of $16.6 million. In 2007, this imputed credit fully offset the imputed assessment for the priced services. For 2008, the net FDIC assessment is imputed at $0.4 million.9
Table 6 shows the imputed PSAF elements, the pretax ROE, and other required PSAF costs for 2007 and 2008. The $20.7 million decrease in ROE is primarily caused by a lower amount of imputed equity and a slight decrease in the risk-free rate of return. Sales taxes increased from $8.5 million in 2007 to $8.9 million in 2008. The effective income tax rate used in 2008 decreased to 31.2 percent from 31.5 percent in 2007. The priced-services portion of the Board's expenses increased $0.5 million from $6.7 million in 2007 to $7.2 million in 2008.
Table 3
Comparison of Pro Forma Balance Sheets
for Federal Reserve Priced Services
(millions of dollars--projected average for year)
| 2008 | 2007 | Change | |
|---|---|---|---|
| Short-term assets | |||
| Imputed reserve requirement
on clearing balances |
799.7 |
823.4 |
(23.7) |
| Receivables | 64.3 | 70.1 | (5.8) |
| Materials and supplies | 2.0 | 1.1 | 0.9 |
| Prepaid expenses | 29.3 | 30.2 | (0.9) |
| Items in process of collection10 |
3,411.7 |
5,388.9 |
(1,977.2) |
| Total short-term assets | 4,307.0 | 6,313.7 | (2,006.7) |
| Imputed investments | 7,124.5 | 7,444.5 | (320.0) |
| Long-term assets | |||
| Premises11 | 393.9 | 395.2 | (1.3) |
| Furniture and equipment | 131.0 | 138.7 | (7.7) |
| Leasehold improvements and
long-term prepayments |
86.7 |
56.6 |
30.1 |
| Prepaid pension costs | 384.2 | 349.1 | 35.1 |
| Deferred tax asset |
150.0 |
159.3 |
(9.3) |
| Total long-term assets |
1,145.8 |
1,098.9 |
46.9 |
| Total assets |
12,577.3 |
14,857.1 |
(2,279.8) |
| Short-term liabilities12 | |||
| Clearing balances | 7,683.9 | 8,322.7 | (638.8) |
| Deferred credit items10 | 3,724.7 | 5,300.3 | (1,575.6) |
| Short-term payables |
91.4 |
91.2 |
0.2 |
| Total short-term liabilities | 11,500.0 | 13,714.2 | (2,214.2) |
| Long-term liabilities12 | |||
| Postemployment/postretirement benefits liability |
448.4 |
400.0 |
48.4 |
| Total liabilities | 11,948.4 | 14,114.2 | (2,165.8) |
| Equity13 |
628.9 |
742.9 |
(114.0) |
| Total liabilities and equity |
12,577.3 |
14,857.1 |
(2,279.8) |
| 2008 | 2007 | |||
|---|---|---|---|---|
| A. Short-term asset financing | ||||
| Short-term assets to be financed: | ||||
| Receivables | 64.3 | 70.1 | ||
| Materials and supplies | 2.0 | 1.1 | ||
| Prepaid expenses |
29.3 |
30.2 |
||
| Total short-term assets to be financed | 95.6 | 101.4 | ||
Short-term funding sources: |
||||
| Short-term payables |
91.4 |
91.2 |
||
| Portion of short-term assets funded with clearing balances14 |
4.2 | 10.2 |
||
| B. Long-term asset financing | ||||
| Long-term assets to be financed: | ||||
| Premises | 393.9 | 395.2 | ||
| Furniture and equipment | 131.0 | 138.7 | ||
| Leasehold improvements and long-term prepayments |
86.7 | 56.6 |
||
| Prepaid pension costs | 384.2 | 349.1 | ||
| Deferred tax asset |
150.0 |
159.3 |
||
| Total long-term assets to be financed | 1,145.8 | 1,098.9 | ||
Long-term funding sources: |
||||
| Postemployment/postretirement benefits liability |
448.4 |
400.0 |
||
| Imputed equity15 |
628.9 |
742.9 |
||
| Total long-term funding sources
|
1,077.3 |
1,142.9 | ||
Portion of long-term assets funded with core clearing balances14 |
68.5 |
0.0 |
||
| C. Total clearing balances used for funding priced-services assets |
72.7 |
10.2 |
||
Table 5
2008 Interest Rate Sensitivity Analysis16
(millions of dollars)
| Rate sensitive |
Rate insensitive |
Total | |
|---|---|---|---|
| Assets | |||
| Imputed reserve requirement on clearing balances |
799.7 |
799.7 |
|
| Imputed investments | 7,124.5 | 7,124.5 | |
| Receivables | 64.3 | 64.3 | |
| Materials and supplies | 2.0 | 2.0 | |
| Prepaid expenses | 29.3 | 29.3 | |
| Items in process of collection17 | (313.0) | 3,724.7 | 3,411.7 |
| Long-term assets |
|
1,145.8 |
1,145.8 |
| Total assets |
6,811.5 |
5,765.8 |
12,577.3 |
| Liabilities | |||
| Clearing balances18 | 5,851.6 | 1,832.3 | 7,683.9 |
| Deferred credit items | 3,724.7 | 3,724.7 | |
| Short-term payables | 91.4 | 91.4 | |
| Long-term liabilities |
|
448.4 |
448.4 |
| Total liabilities |
5,851.6 |
6,096.8 |
11,948.4 |
Rate change results |
200 basis point decrease in rates | 200 basis point increase in rates |
|---|---|---|
| Asset yield ($6,811.5 x rate change) | (136.2) | 136.2 |
| Liability cost ($5,851.6 x rate change) |
(117.0) |
117.0 |
| Effect of 200 basis point change |
(19.2) |
19.2 |
| 2008 budgeted revenue | 897.1 | 897.1 |
| Effect of change |
(19.2) |
19.2 |
| Revenue adjusted for effect of interest rate change |
877.9 |
916.3 |
| 2008 budgeted total expenses | 770.5 | 770.5 |
| 2008 budgeted PSAF | 117.3 | 117.3 |
| Tax effect of interest rate change ($ change x 31.2%) |
(6.0) |
6.0 |
| Total recovery amounts |
881.8 |
893.8 |
| Recovery rate before interest rate change | 101.1% | 101.1% |
| Recovery rate after interest rate change | 99.6% | 102.5% |
| Effect of interest rate change on cost recovery19 | (1.5)% | 1.4% |
| 2008 | 2007 | |||||
|---|---|---|---|---|---|---|
| A. Imputed elements | ||||||
| Short-term debt20 | 0.0 | 0.0 | ||||
| Long-term debt21 | 0.0 | 0.0 | ||||
| Equity | ||||||
| Total assets from table 3 |
12,577.3 | 14,857.1 | ||||
| Required capital ratio22 |
5% |
5% |
||||
| Total equity | 628.9 | 742.9 | ||||
| B. Cost of capital | ||||||
| 1. Financing rates/costs | ||||||
| Short-term debt | N/A | N/A | ||||
| Long-term debt | N/A | N/A | ||||
| Pretax return on equity |
15.4% | 15.8% | ||||
2. Elements of capital costs |
||||||
| Short-term debt | 0.0 | 0.0 | ||||
| Long-term debt | 0.0 | 0.0 | ||||
| Equity23 | 628.9 x 15.4% = 96.6 |
742.9 x 15.8% = 117.3 |
||||
| 96.6 | 117.3 | |||||
| C. Other required PSAF costs | ||||||
| Sales taxes | 8.9 | 8.5 | ||||
| Federal Deposit Insurance Corporation assessment |
0.4 | 0.0 | ||||
| Board of Governors expenses |
7.2 |
6.7 |
||||
| 16.5 |
15.2 |
|||||
| D. Total PSAF |
113.1 |
132.5 |
||||
| As a percent of assets | 0.9% | 0.9% | ||||
| As a percent of expenses24 | 14.9% | 16.3% | ||||
| E. Tax rates | 31.2% | 31.5% | ||||
Table 7
Computation of 2008 Capital Adequacy
for Federal Reserve Priced Services
(millions of dollars)
| Assets | Risk weight | Weighted assets | |
|---|---|---|---|
| Imputed reserve requirement on clearing balances |
799.7 | 0.0 |
0.0 |
| Imputed investments: | |||
| 1-year Treasury note25,26 | 2,475.5 | 0.0 | 0.0 |
| Commercial paper (3-month)25 | 4,249.5 | 1.0 | 4,249.5 |
| GNMA mutual fund27 |
399.5 |
0.2 |
79.9 |
| Total imputed investments | 7,124.5 | 4,329.4 | |
Receivables |
64.3 |
0.2 |
12.9 |
| Materials and supplies | 2.0 | 1.0 | 2.0 |
| Prepaid expenses | 29.3 | 1.0 | 29.3 |
| Items in process of collection | 3,411.7 | 0.2 | 682.3 |
| Premises | 393.9 | 1.0 | 393.9 |
| Furniture and equipment | 131.0 | 1.0 | 131.0 |
| Leasehold improvements and long-term prepayments |
86.7 |
1.0 |
86.7 |
| Prepaid pension costs | 384.2 | 1.0 |
384.2 |
| Deferred tax asset | 150.0 |
1.0 |
150.0 |
Total |
12,577.3 |
6,201.7 |
|
Imputed equity for 2008 |
628.9 |
| Capital to risk-weighted assets | 10.1% |
| Capital to total assets | 5.0% |
C. Earnings Credits on Clearing Balances--The Reserve Banks will maintain the current rate of 80 percent of the three-month Treasury bill rate to calculate earnings credits on clearing balances.28
Clearing balances were introduced in 1981, as part of the Board's implementation of the Monetary Control Act, to facilitate access to Federal Reserve priced services by institutions that did not have sufficient reserve balances to support the settlement of their payment transactions. The earnings credit calculation uses a percentage discount on a rolling thirteen-week average of the annualized coupon equivalent yield of three-month Treasury bills in the secondary market. Earnings credits, which are calculated monthly, can be used only to offset charges for priced services and expire if not used within one year.29
D. Check Service--Table 8 shows the 2006, 2007 estimated, and 2008 budgeted cost recovery performance for the commercial check service.
1. 2007 Estimate--For 2007, the Reserve Banks estimate that the check service will recover 100.4 percent of total expenses and targeted ROE, compared with the budgeted recovery rate of 101.8 percent. The Reserve Banks expect to recover all actual and imputed expenses of providing check services and earn net income of $66.7 million (see table 8).
The lower-than-budgeted cost recovery is the result of costs that were $40.3 million greater than budgeted and are primarily attributable to the accrual of one-time costs associated with the next phase of check restructuring. Revenue was $29.7 million higher than expected, reflecting additional revenue associated with Check 21 deposits presented to non-electronic endpoints using substitute checks and helped to offset the unbudgeted costs.
The number of checks deposited electronically has grown rapidly in 2007 (see table 9). Year-to-date through September, 37.9 percent of the Reserve Banks' volume was deposited through Check 21 products. Year-to-date figures, however, understate the current penetration rate of Check 21 products because volume has increased throughout 2007. In the month of September, for example, the proportion of checks deposited electronically with the Reserve Banks for collection rose to about 50.6 percent of total check deposits.
The number of checks presented electronically using Check 21 products has also grown steadily in 2007 (see table 9). Year-to-date through September, 18.6 percent of the Reserve Banks' volume was presented using Check 21 products, compared with a rate of 26.7 percent for the month of September. Before the end of the year, the Reserve Banks expect that nearly a third of all checks will be presented using Check 21 products. Depository institutions have been slower to accept check presentments electronically because financial incentives are generally stronger for electronic check deposit and because integrating electronic presentments into back-office processing and risk-management systems can be a complex and expensive undertaking.
a. The Reserve Banks' Check 21 product suite includes FedForward, FedReturn, FedReceipt, and FedReceipt Return. FedForward is the electronic alternative to forward check collection; FedReturn is the electronic alternative to paper check return; FedReceipt is electronic presentment with accompanying images; and FedReceipt Return is the electronic return of unpaid checks. Under FedReceipt, the Reserve Banks electronically present only the checks that were deposited electronically or that were deposited in paper form and converted into electronic form by the Reserve Banks. Under FedReceipt Plus, the Reserve Banks electronically present all checks drawn on the customer. Return to text.
b. Deposit and presentment statistics are calculated as a percentage of total forward collection volume. Return statistics are calculated as a percentage of total return volume. Return to text.
For full-year 2007, the Reserve Banks estimate that their total forward check volume will decline 8 percent.30 Paper forward-collection volume is expected to decline 35.3 percent for the full year compared with a budgeted decline of 21.3 percent as more volume is deposited electronically (see table 10). This greater-than-expected decline in paper check volume is a result of more checks being deposited electronically. The Reserve Banks estimate that paper return volume will decline at a slower pace than forward paper volume, 27.1 percent for the full year compared with a budgeted decline of 31.7 percent.
| Budgeted 2007 Change |
Change Through September 2007 | Estimated 2007 Change |
|
|---|---|---|---|
| Total forward collection |
(21.3) | (35.7) | (35.3) |
| Returns | (31.7) | (23.4) | (27.1) |
2. 2008 Pricing--In 2008, the Reserve Banks project that the check service will recover 100.3 percent of total expenses and targeted ROE. Revenue is projected to be $701.5 million, or about a $114 million decline from 2007. This decline is driven by a $142 million drop in paper check and payor bank fee revenue that is partially offset by a $43 million increase in Check 21 fee revenue. Total expenses for the check service are projected to be $647.2 million, or about a $101 million decline from 2007. A key driver in the reduction of local check costs is the continued planned restructuring of the Reserve Banks' check-processing sites, including a reduction in staff of approximately 20 percent.31
For 2008, the Reserve Banks estimate that their total forward check volume will decline 9 percent. The Reserve Banks project that paper check volume for forward products will decrease about 44 percent, volume for paper check return products will decrease 33 percent, and volume for payor bank products will decrease 45 percent. These expected volume declines will be offset by a projected increase in Check 21 volumes as the shift from paper to electronic check volume continues. The Reserve Banks project that FedForward volume will increase 42 percent, FedReceipt Plus volume will increase 87 percent, and FedReturn volume will increase 39 percent (see table 11). The Reserve Banks' projected increase in Check 21 volume will result in a more modest 17 percent increase in Check 21 product revenue as the share of Check 21 deposits presented to FedReceipt electronic endpoints grows. Board and Reserve Bank staff believe that the key to realizing Check 21 cost efficiencies for the System continues to be the widespread acceptance of electronic check presentments by paying banks, and by year-end 2008, the Reserve Banks expect that 75 percent of their check volume will be deposited using Check 21 services and that 55 percent of their check volume will be presented using Check 21 services.
| 2008 Budgeted Volume (millions of items) |
Growth From 2007 Estimates (percent) |
|
|---|---|---|
| FedForward | 5,842 | 42 |
| FedReceipt Plus |
3,841 | 87 |
| FedReturn | 60 | 39 |
The Reserve Banks expect to see continued growth in their Check 21 volumes in 2008, as market participants continue to replace their existing traditional check infrastructure to take advantage of more cost-effective electronic clearing. The Reserve Banks project volume losses from large banks that are expected to increase the number of check images exchanged among themselves. This volume loss, however, is expected to be offset through the expansion of customers using existing Check 21 products and the introduction of new Check 21 products. In addition, the Reserve Banks will further standardize their product offerings and will eliminate products that generate little volume. These actions will help the Reserve Banks achieve a more uniform product suite, leading to greater operational efficiencies.
For 2008, the Reserve Banks are targeting an overall price increase for traditional check services of 12.5 percent, including a 12.1 percent increase in forward check collection fees, a 12.5 percent increase in return service fees, and a 13.8 percent increase in payor bank services fees.32 For Check 21 services, the Reserve Banks will decrease by 3.2 percent the fees for Check 21 deposits that are presented electronically. The fees for Check 21 deposits that are presented as substitute checks, however, will increase 10.3 percent. There will be no change in fees charged for the Check 21 FedReturn product (see table 12).
| Product | Fee Change |
|---|---|
| Traditional Check | 12.5 |
| Forward collection | 12.1 |
| Returns | 12.5 |
| Payor bank services | 13.8 |
| Check 21a | |
| FedForward (electronic endpoints) | (3.2) |
| FedForward (substitute check endpoints) | 10.3 |
| FedReturn | no change |
a.FedReceipt customers currently receive a $0.003 discount per check presented electronically, which will increase to a $0.004 discount in 2008. This discount can be used to offset fees for checks deposited electronically with the Reserve Banks. Return to text.
The major risks to meeting the Reserve Banks’ budgeted 2008 cost recovery are higher-than-expected declines in paper check volume as well as increased competition from correspondent banks and other service providers as they expand their Check 21 service offerings. The Reserve Banks may also suffer greater Check 21 volume losses if large banks exchange images among themselves more quickly than anticipated. Other risks include unanticipated problems with check restructurings or other major initiatives that may result in significant cost overruns.
E. FedACH Service--Table 13 below shows the 2006, 2007 estimated, and 2008 budgeted cost recovery performance for the commercial FedACH service.
1. 2007 Estimate--The Reserve Banks estimate that the FedACH service will recover 105.8 percent of total expenses and targeted ROE, compared with the budgeted recovery rate of 102.5 percent. The Reserve Banks expect to recover all actual and imputed expenses of providing FedACH services and earn net income of $14.3 million. Year-to-date through September, FedACH commercial origination volume is 13.6 percent higher than during the same period last year, compared with a budgeted full-year growth of 12.4 percent. For full-year 2007, the Reserve Banks estimate that FedACH commercial originations will grow 13.1 percent because some of their customers will have migrated their business to EPN, the other automated clearing house (ACH) operator.
2. 2008 Pricing--The Reserve Banks project that the FedACH service will recover 102.0 percent of total expenses and targeted ROE in 2008. Total revenue is budgeted to decrease $2.6 million from the 2007 estimate, primarily as the result of the elimination of the input file processing fee. Total expenses are budgeted to increase $2.3 million from the 2007 estimate. This increase reflects the additional resources needed to support the multiyear technology transition plan from a mainframe-computer to a distributed-server processing environment.
The Reserve Banks expect FedACH commercial origination volume to grow 11.2 percent in 2008. This expected growth is largely attributable to volume increases associated with electronic check conversion applications, including checks converted at lockboxes and at the point of sale.
The Reserve Banks will also change their pricing approach for two existing ACH products. The first, FedEDI® Plus, offers depository institutions the ability to provide corporate-level payment data to their customers.33 The second, FedACH risk management services, provides depository institutions the ability to better monitor the risks of their ACH transactions. Beginning in 2008, the subscription fee for FedACH risk management services will be eliminated, and fees for monitoring criteria will be reduced and tiered. In addition, access to FedACH risk management services, along with FedEDI Plus, will be bundled with FedLine Web connectivity. Separate fees will also be charged for FedEDI Plus scheduled, secure delivery, and on demand reports.34
The primary risk to meeting the Reserve Banks' budgeted 2008 cost recovery is the loss of large ACH originators to EPN. Other risks include the potential growth of direct ACH exchanges that bypass the ACH operators and unanticipated problems with technology upgrades that may result in significant cost overruns.
F. Fedwire Funds and National Settlement Services--Table 14 below shows the 2006, 2007 estimated, and 2008 budgeted cost recovery performance for the Fedwire Funds and National Settlement Services.
Table 14
Fedwire Funds and National Settlement Services
Pro Forma Cost and Revenue Performance
($ millions)
1. 2007 Estimate--The Reserve Banks estimate that the Fedwire Funds and National Settlement Services will recover 107.0 percent of total expenses and targeted ROE, compared with a 2007 budgeted recovery rate of 102.5 percent. The greater-than-expected recovery rate is primarily attributed to higher-than-expected electronic connection and fee revenues and lower-than-budgeted operating costs. Year-to-date through September, online funds volume was 1.4 percent higher than during the same period last year. For full-year 2007, the Reserve Banks estimate that online funds volume will grow 1.4 percent, compared with a budgeted flat growth. With respect to the National Settlement Service, the Reserve Banks estimate that the volume of settlement entries processed during 2007 will be 7.0 percent higher than the 2007 budget projection of flat growth. The higher-than-budgeted National Settlement Service volume is due primarily to the Depository Trust & Clearing Corporation subsidiaries' greater use of the National Settlement Service for settlement activity.
2. 2008 Pricing--In 2008, the Reserve Banks expect the Fedwire Funds and National Settlement Services to recover 105.5 percent of total expenses and targeted ROE. The Reserve Banks project 2008 total revenue to decline $1.9 million compared with the 2007 estimate. The decline in total revenue is due to lower service revenue generated by the lower transfer fees. Total expenses for 2008 are budgeted to increase $0.2 million from the 2007 estimate. Online volume for the Fedwire Funds Service for 2008 is budgeted to increase 1.9 percent compared with 2007 estimates. Volume for the National Settlement Service for 2008 is budgeted to be unchanged from 2007 estimated volume.
The Reserve Banks will decrease the online transfer fee by three cents in the highest-priced tier, two cents in the midpriced tier, and one cent in the lowest-priced tier. The Reserve Banks also will increase the volume thresholds for each tier. The fee reductions for online transfers are intended to better position the Reserve Banks to remain competitive with CHIPS. The Reserve Banks will not change the National Settlement Service fee schedule.
G. Fedwire Securities Service--Table 15 below shows the 2006, 2007 estimated, and 2008 budgeted cost recovery performance for the Fedwire Securities Service.35
1. 2007 Estimate--The Reserve Banks estimate that the Fedwire Securities Service will recover 103.5 percent of total expenses and targeted ROE, compared with a 2007 budgeted recovery rate of 101.9 percent. The higher-than-budgeted recovery is attributable to greater-than-expected fee revenue and lower-than-expected operating costs. Year-to-date through September, online securities volume was 6.4 percent higher than during the same period last year. For full-year 2007, the Reserve Banks estimate that online securities volume will grow 6.4 percent, compared with a budgeted flat growth. The higher-than-budgeted volume is due to the recent substantial growth in online volume driven by recent market volatility.
2. 2008 Pricing--The Reserve Banks project that in 2008 the Fedwire Securities Service will recover 105.0 percent of total expenses and targeted ROE. Total revenue and total expenses are expected to be only slightly higher than 2007. Online and offline securities volumes in 2008 are projected to be unchanged from 2007 estimates. The Reserve Banks will leave prices unchanged.
H. Electronic Access--The Reserve Banks allocate the costs and revenues associated with electronic access to the Reserve Banks' priced services. There are currently three types of electronic access channels through which customers can access the Reserve Banks' priced services: FedLine®, FedMail®, and FedPhone®.36 For 2008, the Reserve Banks will be adding new services to, and increasing the fees for, the FedLine packaged solutions.
The Reserve Banks offer seven electronic access packages that are supplemented by a number of premium (or à la carte) access and accounting information options. The first package provides access to information services through FedMail Email. The next two packages are FedLine Web® packages, with either three or five subscribers, that offer access to basic information and check services. The next two packages are FedLine Advantage® packages, with either three or five subscribers, that expand upon the FedLine Web packages to offer access to FedACH and Fedwire services. The final two packages are FedLine Command and FedLine Direct. FedLine Command can connect over the Internet or through a dedicated connection, while FedLine Direct exclusively connects through a dedicated connection. FedLine Command is designed for FedACH functionality, while FedLine Direct, which is the replacement channel for Computer Interface customers, has both FedACH and Fedwire functionality. Both FedLine Command and FedLine Direct expand upon the FedLine Advantage packages and include most accounting information services.
The increases to electronic access pricing for 2008 reflect enhanced services in the FedLine packages. Specifically, the Reserve Banks are including in the FedLine packages additional enhanced accounting information services, the FedEDI Plus service, and the FedACH risk management service. The Reserve Banks will charge an additional $5 per month for the FedLine Web packages, $10 per month for the FedLine Advantage and FedLine Command packages, and $100 per month for the FedLine Direct packages.
II. ANALYSIS OF COMPETITIVE EFFECT
All operational and legal changes considered by the Board that have a substantial effect on payments system participants are subject to the competitive impact analysis described in the March 1990 policy, "The Federal Reserve in the Payments System."37 Under this policy, the Board assesses whether the changes would have a direct and material adverse effect on the ability of other service providers to compete effectively with the Federal Reserve in providing similar services because of differing legal powers or constraints or because of a dominant market position deriving from such legal differences. If the change creates such an effect, the Board must further evaluate the change to assess whether its benefits--such as contributions to payment system efficiency, payment system integrity, or other Board objectives--can be retained while minimizing the adverse effect on competition.
The Board believes that the 2008 fees, fee structures, or changes in service will not have a direct and material adverse effect on the ability of other service providers to compete effectively with the Reserve Banks in providing similar services. The changes should permit the Reserve Banks to earn an ROE that is comparable to overall market returns.
FedACH Service 2008 Fee Schedule
Effective January 2, 2008. Bold indicates changes from 2007 Fee Schedule.
| Fee | |
| Origination (per item or record):38 | |
| Items in small files | $0.0030 |
| Items in large files | $0.0025 |
| Addenda record | $0.0010 |
Input file processing fee (per file): |
eliminated |
Receipt (per item or record):39 |
|
| Item | $0.0025 |
| Addenda record | $0.0010 |
FedACH risk management: |
|
| Risk service subscription | eliminated |
| Risk origination monitoring service | |
| Monitoring criteria40 | |
| Per set of criteria for the first 20 sets per month | $8.00 |
| Per set of criteria for additional sets up to 150 per month | $4.00 |
| Per set of criteria for every set over 150 per month | $1.00 |
| Batch monitoring | $0.0025 |
FedEDI Plus (per report): |
|
| Scheduled report | $0.20 |
| On demand report | $0.75 |
| Secure delivery | $0.20 |
Monthly fee (per routing number): |
|
| Account servicing 41 | $25.00 |
| FedACH settlement42 | $20.00 |
| Information extract file | $20.00 |
FedLine Web origination returns and notification of change (NOC) :43 |
$0.30 |
| Voice response returns/NOC:44 | $2.00 |
Non-electronic input/output:45 |
|
| Tape input/output | $25.00 |
| Paper output | $15.00 |
| Facsimile exception returns/NOC46 | $15.00 |
Canadian service: |
|
| Cross-border item surcharge47 | $0.039 |
| Return received from Canada48 | $0.77 |
| Same-day recall of item at receiving gateway operator | $4.00 |
| Same-day recall of item not at receiving gateway operator | $7.00 |
| Trace of item at receiving gateway | $3.50 |
| Trace of item not at receiving gateway | $5.00 |
Mexico service: |
|
| Cross-border item surcharge47 | $0.67 |
| Return received from Mexico48 | $0.69 |
| Item trace | $11.50 |
Transatlantic service: |
|
| Cross-border item surcharge47 | |
| Austria | $2.00 |
| Germany | $2.00 |
| The Netherlands | $2.00 |
| Switzerland | $2.00 |
| United Kingdom | $2.00 |
| Return received48 | |
| Austria | $5.00 |
| Germany | $8.00 |
| The Netherlands | $5.00 |
| Switzerland | $5.00 |
| United Kingdom | $8.00 |
Fedwire Funds and National Settlement Services
2008 Fee Schedule
Effective January 2, 2008. Bold indicates changes from 2007 Fee Schedule.
| Fedwire Funds Service | |
| Fee | |
| Basic volume-based transfer fee (originations and receipts) | |
| Per transfer for the first 3,000 transfers per month | $0.26 |
| Per transfer for additional transfers up to 90,000 per month | $0.17 |
| Per transfer for every transfer over 90,000 per month | $0.08 |
Surcharge |
|
| Offline transfer originated or received | $30.00 |
National Settlement Service |
|
| Basic | |
| Settlement entry | $0.80 |
| Settlement file | $14.00 |
Surcharge for offline file origination |
$25.00 |
Minimum monthly charge (account maintenance)49 |
$60.00 |
Special settlement arrangements50 |
|
| Per day | $100.00 |
Fedwire Securities Service 2008 Fee Schedule
(Non-Treasury Securities)
Effective January 2, 2008. Bold indicates changes from 2007 prices.
| Fee | |
| Transfer or reversal, originated or received | $0.34 |
Surcharge |
|
| Offline transfer or reversal originated or received | $60.00 |
Monthly maintenance |
|
| Account maintenance (per account) | $16.00 |
| Issues maintained (per issue/per account) | $0.40 |
Claim adjustment fee |
$0.30 |
Joint custody fee |
$40.00 |
Electronic Access 2008 Fee Schedule
Effective January 2, 2008 (unless otherwise indicated). Bold indicates changes from 2007 prices.
| ELECTRONIC ACCESS PACKAGES (MONTHLY) | ||
FedMail Email |
$15.00 |
|
FedLine Web W3 |
$85.00 | |
| Includes: | FedMail Email FedLine Web with three individual subscriptions Service Charge Information (SCI) Account Management Information (AMI) FedACH risk management service FedEDI Plus service |
|
FedLine Web W5 |
$130.00 |
|
| Includes: | FedMail Email FedLine Web with five individual subscriptions Service Charge Information (SCI) Account Management Information (AMI) FedACH risk management service FedEDI Plus service Cash Management System Basic--Own report only |
|
FedLine Advantage A3 |
|
|
| Includes: | FedLine Web W3 package FedLine Advantage with three individual subscriptions Virtual Private Network (VPN) maintenance |
|
FedLine Advantage A5 |
$360.00 |
|
| Includes: | FedLine Web W5 package FedLine Advantage with five individual subscriptions VPN maintenance Intraday search download feature within AMI |
|
FedLine Command |
$660.00 |
|
| Includes: | FedLine Advantage A5 package One dedicated unattended connection over the Internet for ACH services Billing data format file (BDFF) Intra-day file End of day file (FIRD) Statement of account spreadsheet file (SASF) |
|
| FedLine Direct D56, D256, DT1 | D56 $2,100.00, D256 $3,100.00, and DT1 $3,600.00 |
| Includes: FedLine Command package One dedicated unattended connection for Computer Interface or FedLine Direct |
|
PREMIUM OPTIONS (MONTHLY)51 |
|
Electronic Access |
|
FedMail Fax (monthly per fax line) |
$25.00 |
Additional subscribers package (each package contains 5 additional subscribers) |
$75.00 |
Maintenance of additional VPN |
$50.00 |
Additional dedicated connections52 |
|
| Primary: | 56K--$750.00 256K--$1,750.00 T1--$2,250.00 |
| Contingency: | 56K--$650.00 256K--$1,650.00 T1--$2,150.00 |
FedImage/Check 21 Large File Delivery |
Various |
Accounting Information Services |
|
Cash Management System |
|
| Basic--Respondent and/or subaccount reports (per report/month) |
$7.00 |
| Basic--Respondent/subaccount recap report (per month) |
$35.00 |
| Plus--Own report up to six times a day (per month) |
$50.00 |
| Plus--Fewer than 10 respondent and/or subaccounts and SASF (per month) |
$100.00 |
| Plus--10 or more respondent and/or subaccounts and SASF (per month) |
$200.00 |
End-of-day reconcilement file (FIRD) (per month) |
$100.00 |
Statement of account spreadsheet file (SASF) (per month) |
$100.00 |
Intraday search download file (per month) |
$100.00 |
By order of the Board of Governors of the Federal Reserve System, November 5, 2007.
Robert deV. Frierson
Deputy Secretary of the Board.
Footnotes
1. The ten-year recovery rate is based upon the pro forma income statement for Federal Reserve priced services published in the Board's Annual Report.
Effective December 31, 2006, the Reserve Banks implemented Financial Accounting Standards No. 158: Employers’ Accounting for Defined Benefit Pension and Other Postretirement Plans (FAS 158), which resulted in recognizing a reduction in equity related to the priced services’ benefit plans. Including this reduction in equity results in cost recovery of 95.5 percent for the ten-year period. This measure of long-run cost recovery is also published in the Board’s Annual Report. Return to text.
2. FedACH and Fedwire are registered servicemarks of the Reserve Banks. Return to text.
3. A portion of clearing balances is used as a funding source for priced-services assets. Long-term assets are partially funded from core clearing balances, which are currently $4 billion. Core clearing balances are considered the portion of the balances that has remained stable over time without regard to the magnitude of actual clearing balances. Return to text.
4. The FDIC requirements for a well-capitalized depository institution are (1) a ratio of total capital to risk-weighted assets of 10 percent or greater, (2) a ratio of Tier 1 capital to risk-weighted assets of 6 percent or greater, and (3) a leverage ratio of Tier 1 capital to total assets of 5 percent or greater. The priced services balance sheet has no components of Tier 1 or total capital other than equity; therefore, requirements 1 and 2 are essentially the same measurement.
As used in this context, the term “shareholder” does not refer to the actual member banks of the Federal Reserve System, but rather to the implied shareholders who would have an ownership interest if the Reserve Banks’ priced services were provided by a private firm. Return to text.
5. Other taxes, such as sales taxes, are included in priced-services actual or imputed costs. Return to text.
6. The investment portfolio is composed of investments comparable to a BHC’s investment holdings, such as short-term Treasury securities, government agency securities, commercial paper, long-term corporate bonds, and money market funds. See table 7 for the investments imputed in 2008.
NICB is projected to be $125.8 million for 2008 using a constant spread of 26 basis points over the three-month Treasury bill rate and applying this rate to the clearing balance levels used in the 2008 pricing process. The 2007 NICB estimate is $135.7 million. Return to text.
7. July 2007 rates and balances were used to project 2008 NICB. Return to text.
8. In December 2006, bank regulators (the Board of Governors of the Federal Reserve System, the FDIC, the Office of the Comptroller of the Currency, and the Office of Thrift Supervision) announced an interim ruling that excludes FAS 158-related accumulated other comprehensive income or losses from the calculation of regulatory capital. The Reserve Banks, however, elected to impute total equity at 5 percent of assets, as indicated above, until the regulators announce a final ruling. Return to text.
9. Per FDIC rules, any remaining portion of the one-time assessment credit can offset up to 90 percent of the assessment amount in subsequent years. For 2008, 90 percent of the total imputed assessment of $4.1 million was offset by the remaining assessment credit, resulting in a net assessment of $0.4 million. Return to text.
10. Represents float that is directly estimated at the service level. Return to text.
11. Includes the allocation of Board of Governors assets to priced services of $1.2 million for 2008 and 2007. Return to text.
12. No debt is imputed because clearing balances are a funding source. Return to text.
13. Includes an accumulated other comprehensive loss of $361.0 million for 2007, which was reduced to $328.4 million for 2008 to reflect the ongoing amortization of the accumulated loss in accordance with FAS 158. Future gains or losses, and their effects on the pro forma balance sheet, cannot be projected. Return to text.
14. Clearing balances shown in table 3 are available for financing priced-services assets. Using these balances reduces the amount available for investment in the NICB calculation. Long-term assets are financed with long-term liabilities, equity, and core clearing balances; a total of $4 billion in clearing balances is available for this purpose. Short-term assets are financed with short-term payables and clearing balances not used to finance long-term assets. No short- or long-term debt is imputed. Return to text.
15. See table 6 for calculation of required imputed equity amount. Return to text.
16. The interest rate sensitivity analysis evaluates the level of interest rate risk presented by the difference between rate-sensitive assets and rate-sensitive liabilities. The analysis reviews the ratio of rate-sensitive assets to rate-sensitive liabilities and the effect on cost recovery of a change in interest rates of up to 200 basis points. Return to text.
17. The amount designated as rate-sensitive represents items collected prior to providing credit according to established availability schedules. Return to text.
18. The amount designated as rate-insensitive represents clearing balances on which earnings credits are not paid. Return to text.
19. The effect of a potential change in rates is less than a two percentage point change in cost recovery; therefore, no long-term debt is imputed for 2008. Return to text.
20. No short-term debt is imputed because clearing balances are a funding source for those assets that are not financed with short-term payables. Return to text.
21. No long-term debt is imputed because core clearing balances are a funding source. Return to text.
22. Based on the regulatory requirements for a well-capitalized institution for the purpose of assessing insurance premiums. Return to text.
23. The 2008 ROE is equal to a risk-free rate plus a risk premium (beta * market risk premium). The 2008 after-tax CAPM ROE is calculated as 5.04% + (1 * 5.53%) = 10.57%. Using a tax rate of 31.2%, the after-tax ROE is converted into a pretax ROE, which results in a pretax ROE of (10.57% / (1-31.2%)) = 15.4%. Return to text.
24. System 2008 budgeted priced services expenses less shipping are $756.8 million. Return to text.
25. The imputed investments are assumed to be similar to those for which rates are available on the Federal Reserve’s H.15 statistical release, which can be located at http://www.federalreserve.gov/releases/h15/data.htm. Return to text.
26. Includes estimated amounts arising from the collection of items prior to providing credit according to established availability schedules. These amounts are assumed to be invested in a short-term Treasury security. Return to text.
27. The imputed mutual fund investment is based on Vanguard’s GNMA Fund Investor Shares fund, which was chosen based on the investment strategies articulated in its prospectuses. The fund returns can be located at https://personal.vanguard.com/VGApp/hnw/FundsByType . Return to text.
28. Two adjustments are applied to the earnings credit rate so that the return on clearing balances at the Federal Reserve is comparable to what the depository institution (DI) would have earned had it maintained the same balances at a private-sector correspondent. The “imputed reserve requirement” adjustment is made because a private-sector correspondent would be required to hold reserves against the respondent’s balance with it. As a result, the correspondent would reduce the balance on which it would base earnings credits for the respondent because it would be required to hold a portion, determined by its marginal reserve ratio, in the form of non-interest-bearing reserves. For example, if a DI held $1 million in clearing balances with a correspondent bank and the correspondent had a marginal reserve ratio of 10 percent, then the correspondent bank would be required to hold $100,000 in reserves, and it would typically grant credits to the respondent based on 90 percent of the balance, or $900,000. This adjustment imputes a marginal reserve ratio of 10 percent to the Reserve Banks.
The “marginal reserve requirement” adjustment accounts for the fact that the respondent can deduct balances maintained at a correspondent, but not at the Federal Reserve, from its reservable liabilities. This reduction has value to the respondent when it frees up balances that can be invested in interest-bearing instruments, such as federal funds. For example, a respondent placing $1 million with a correspondent rather than the Federal Reserve would free up $30,000 if its marginal reserve ratio were 3 percent.
The formula used by the Reserve Banks to calculate earnings credits can be expressed as
e = [ b * (1-FRR) * r] + [ b * (MRR) * f]
Where e is total earnings credits, b is the average clearing balance maintained, FRR is the assumed Reserve Bank marginal reserve ratio (10 percent), r is the earnings credit rate, MRR is the marginal reserve ratio of the DI holding the balance (either 0 percent, 3 percent, or 10 percent), and f is the average federal funds rate. A DI that meets its reserve requirement entirely with vault cash is assigned a marginal reserve requirement of zero. Return to text.
29. A band is established around the contracted clearing balance to determine the maximum balance on which credits are earned as well as any deficiency charges. The clearing balance allowance is 2 percent of the contracted amount or $25,000, whichever is greater. Earnings credits are based on the period-average balance maintained up to a maximum of the contracted amount plus the clearing balance allowance. Deficiency charges apply when the average balance falls below the contracted amount less the allowance, although credits are still earned on the average maintained balance. Return to text.
30. Total forward Reserve Bank check volumes have dropped from roughly 11.0 billion in 2006 to 10.1 billion in 2007 and are expected to fall to 9.2 billion in 2008. Return to text.
31. In February 2003, the Reserve Banks announced an initiative to reduce the number of sites at which they process checks from forty-five to thirty-two. The Reserve Banks announced further rounds of restructurings in August 2004, May 2005, and May 2006. As of October 2007, there are nineteen Reserve Bank check processing offices. The Reserve Banks have announced plans to consolidate to four check processing sites by early 2011. Return to text.
32. In 2007, the Reserve Banks announced a sunset strategy for payor bank services. The Reserve Banks will discontinue offering these services by the end of 2009. Return to text.
33. FedEDI is a registered servicemark of the Reserve Banks. Return to text.
34. Depository institutions that use FedLine Advantage, FedLine Command, and FedLine Direct will also have access to FedEDI Plus and FedACH risk management services because FedLine Web functionality is included in these electronic access packages. Return to text.
35. The Reserve Banks provide transfer services for securities issued by the U.S. Treasury, federal government agencies, government-sponsored enterprises, and certain international institutions. The priced component of this service, reflected in this memorandum, consists of revenues, expenses, and volumes associated with the transfer of all non-Treasury securities. For Treasury securities, the U.S. Treasury assesses fees for the securities transfer component of the service. The Reserve Banks assess a fee for the funds settlement component of a Treasury securities transfer; this component is not treated as a priced service. Return to text.
36. FedPhone, FedMail, and FedLine are registered servicemarks of the Reserve Banks. These connections may also be used to access nonpriced services provided by the Reserve Banks. FedPhone is a free access option. Return to text.
37. Federal Reserve Regulatory Service (FRRS) 9-1558. Return to text.
38. Small files contain fewer than 2,500 items and large files contain 2,500 or more items. These origination fees do not apply to items that the Reserve Banks receive from the private-sector ACH operator. Return to text.
39. Receipt fees do not apply to items that the Reserve Banks send to the private-sector ACH operator. Return to text.
40. Sets of criteria are the combination of variables the originating depository financial institution (ODFI) will use to monitor ACH processing. For example, ODFIs can select which originators to monitor, set debit and credit caps, and receive e-mail notification. Return to text.
41. The account servicing fee applies to routing numbers that have received or originated FedACH transactions. Institutions that receive only U.S. government transactions or that elect to use the other operator exclusively are not assessed the account servicing fee. Return to text.
42. The FedACH settlement fee is applied to any routing number with activity during a month. This fee does not apply to routing numbers that use the Reserve Banks for government transactions only. Return to text.
43. The fee includes the transaction and addenda fees. Return to text.
44. The fee includes the transaction fee in addition to the voice response fee. Return to text.
45. These services are offered for contingency situations only. Return to text.
46. The fee includes the transaction fee in addition to the conversion fee. Return to text.
47. This per-item surcharge is in addition to the standard domestic origination fees. Return to text.
48. This per-item surcharge is in addition to the standard domestic receipt fees. Return to text.
49. This minimum monthly charge will only be assessed if total settlement charges during a calendar month are less than $60. Return to text.
50. Special settlement arrangements use Fedwire funds transfers to effect settlement. Participants in arrangements and settlement agents are also charged the applicable Fedwire funds transfer fee for each transfer into and out of the settlement account. Return to text.
51. Premium options for FedLine Web W3 and FedLine Advantage A3 limited to FedMail Fax. Return to text.
52. Network diversity supplemental charge of $1,000 a month may apply in addition to these fees. Return to text.
Accessibility | Contact Us
External Linking Policy
FOIA