
Sources and Uses of Equity Extracted from Homes
Keywords: Macroeconomics, personal consumption, home equity extraction
Abstract:
In this paper, we present estimates of the disposition of the free cash generated by home equity extraction to finance consumer spending, outlays for home improvements, debt repayment, acquisition of assets, and other uses. We estimate free cash as cash available net of closing costs and repayment of other mortgage debt. We also have extended the quarterly data series for gross equity extraction, presented in our earlier paper, back to 1968.
I. Introduction
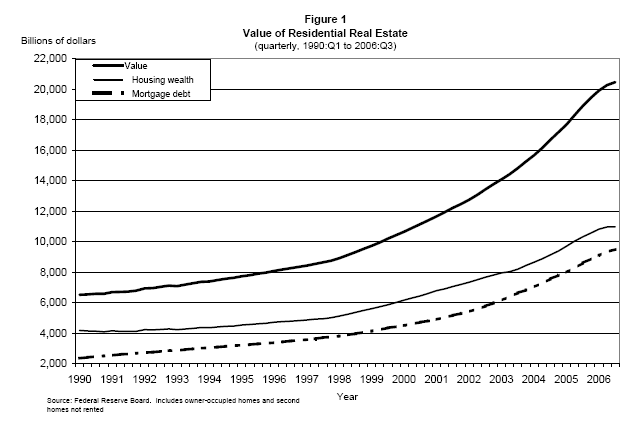
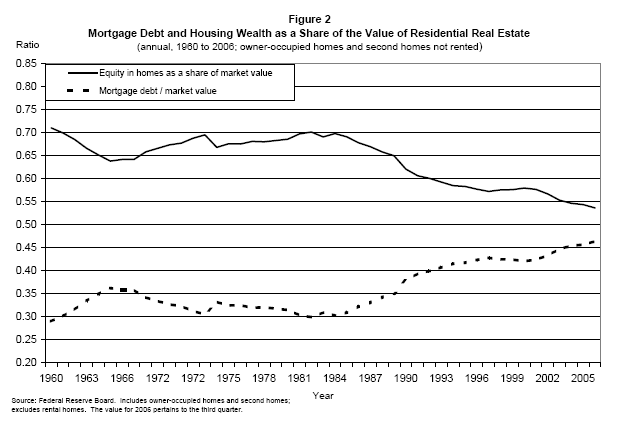
The rise in the market value of homes since the early 1990s has led to a substantial increase in the level of housing wealth (figure 1). However, since the mid-1980s, mortgage debt has grown more rapidly than home values, resulting in a decline in housing wealth as a share of the value of homes (figure 2).
There is broad agreement in the literature that housing wealth supports consumption; however, there is considerable disagreement as to the magnitude of the effect and much debate as to whether the marginal propensity to consume (MPC) out of housing wealth differs from the MPC from financial
wealth. There also is disagreement as to whether home equity extraction adds to PCE beyond the traditional wealth effect.
In this paper, we present estimates of how much home equity owners have extracted since 1990 and what they did with those funds. Specifically, we estimate the disbursement of equity extraction to finance consumer spending, outlays for home improvements, debt repayment, acquisition of assets, and other uses. Our results do not provide an estimate of the MPC out of housing wealth; nor do they address the question as to whether extraction of housing wealth has an effect on PCE in addition to the standard wealth effect. We present methods for estimating the free cash generated by equity extraction--that is, cash available net of closing costs and repayment of other mortgage debt. In addition, we provide a template for estimating how PCE and other variables relate to equity extraction.
We define gross equity extraction from existing homes as the discretionary initiatives of home owners to convert equity in their homes into cash by borrowing in the residential mortgage market. We calculate gross equity extraction as the change in home mortgage debt (excluding construction loans), plus scheduled amortization, minus mortgage originations to finance newly built homes. In our previous paper, we presented separate estimates of the three types of equity extraction: (1) extraction resulting from existing home sales (equal to first lien mortgages used to purchase existing homes minus the associated debt cancellation of sellers), (2) cash outs of home equity resulting from the refinancing of first liens, and (3) the change in home equity loans net of unscheduled payments on first liens.1 According to our estimates, discretionary extraction of home equity accounts for about four-fifths of the rise in home mortgage debt since 1990.2 Equity extraction resulting from home sales reflects largely realized capital gains, whereas home equity loans and cash-out refinancings are extractions of unrealized capital gains.
We use survey results to estimate what people do with their extracted home equity. According to the surveys, a considerable portion of the equity extracted through cash out refinancings and home equity loans was used to repay non-mortgage debt, largely credit card loans. One interpretation is that much of the non-mortgage debt repaid with those funds was, in effect, bridge financing for personal consumption expenditures (PCE). Thus, we present two estimates of the PCE effect: direct financing, which includes only the proportion of equity extraction that survey respondents said was used to finance PCE, and a broader estimate, in which we add to direct financing equity extraction used to repay non-mortgage debt.
An important question we address near the end of the paper is the potential effect that home equity extraction has had on the personal saving rate, which has fallen sharply since the late 1990s. To understand the decline in the personal saving rate, we need to understand what motivated people in recent years to spend far more relative to income than they did in the mid-1990s. Surveys of households have not directly addressed that issue. Rather, they have asked: "Given your extraction of home equity, what did you do with the proceeds over a specific horizon?" The horizon is usually a year or so. Obviously if the question were asked a day after the extraction took place, most respondents would report that almost all of the proceeds were in liquid assets. But if the same question were asked six months later, a good portion of those liquid assets would have been drawn down and used to finance spending, to consolidate debts, or for some other use. PCE financed from other than disposable income results in a reduction in the saving rate.3 Under certain assumptions as to the disposition of equity extracted as a result of home sales, cash out refinancings, and changes in home equity loans (described below), the implied increase in consumption expenditures financed by home equity extraction would parallel a substantial portion of the decline in the personal saving rate since 1998. This, of course, does not mean that the rise in outlays would not have occurred in the absence of equity extracted from homes. Outlays might have risen as much, but financed, for example, by a drawdown in liquid assets or by non-mortgage debt.4
II. Review of the Literature
There is little dispute that changes in household wealth significantly influence PCE, but considerable disagreement as to whether the MPCs out of housing wealth and financial wealth differ; the latter is an empirical issue. In addition to questions about the traditional wealth effect, there is debate as to whether equity extraction (sometimes referred to as "mortgage equity withdrawal" or MEW) influences PCE beyond the traditional wealth affect, or whether MEW is simply a means of financing PCE.
Over the years, empirical studies have found widely differing MPCs for housing and financial wealth.5 Among recent studies, Bostic, Gabriel, and Painter (2006) used micro-data to estimate the elasticity of consumption to both housing and financial wealth in the United States over the 1989-2001 period. They found a substantially larger MPC for housing wealth than for financial wealth (0.06 compared to 0.02). In addition, Case, Quigley, and Shiller (2005), using panel data for 14 countries reported:
"The importance of housing market wealth and financial wealth in affecting consumption is an empirical matter. We have examined this wealth effect with two panels of cross-sectional time-series data that are more comprehensive than any applied before and with a number of different econometric specifications...We find at best weak evidence of a stock market wealth effect. However, we do find strong evidence that variations in housing market wealth have important effects upon consumption. This evidence arises consistently using panels of U.S. states and individual countries and is robust to differences in model specification. [The results]...support the conclusion that changes in housing prices should be considered to have a larger and more important impact than changes in stock market prices in influencing household consumption in the U.S. and in other developed countries. (page 26)
Carroll, Otsuka, and Slacalek (2006) reported a long-run MPC out of non-stock market wealth (including real estate) that is more than twice as high as the MPC out of stock market wealth. Using aggregate time series data, Benjamin, Chinloy, and Jud (2004), found an MPC out of home equity of 8 cents on the dollar, four times larger than the MPC out of financial assets. They concluded that
"...about half of the decline in the fraction of income that Americans save, from 6.5 percent in 1995 to 1 percent by 2001, is attributable to increases in real estate and financial wealth. Virtually all of the decline in consumption occurring from the stock market decline of 2000-2001 is offset by rising consumption from real estate wealth. Real estate smoothes and stabilizes consumption when other assets are performing poorly." (page 2)
Aron and Muellbauer (2006) using data from the UK and South Africa, argue that the MPCs out of housing wealth reported, for example, by Case, et al (2005), are overstated because they do not account for the effects of credit liberalization. Aron and Muellbauer find that the MPC out of housing wealth declines when credit liberalization is accounted for, and is not much different than the MPC out of illiquid financial wealth (for example, pension funds) and is smaller than the MPC out of liquid financial assets.
Hurst and Stafford (2004) incorporated the refinancing decision into a permanent income model of personal consumption. Two motives to refinance emerge from their model: first, to lower the mortgage rate, and second to tap into home equity, perhaps in order to smooth consumption in the face of an income shock. Their model implies that liquidity constrained households use the equity from cash out refinancings to fund current consumption, which results in a decline in their overall wealth. By contrast, home equity extracted by non-liquidity constrained households would be invested in other types of assets, resulting in no change in wealth. They used data from the Panel Study of Income Dynamics (PSID) to test their theory, and concluded that liquidity-constrained households converted two-thirds of every dollar of home equity removed in refinancing to consumption; non-liquidity constrained households did not use any of those funds for consumption.6 Contrary to those findings, Juster and his coauthors (2005), also using PSID data, reported a much larger elasticity of PCE from stock market wealth than from housing wealth.
Regarding the question as to whether MEW exerts a separate effect on PCE (in addition to the traditional wealth effect), Kasman and his coauthors at J.P. Morgan (2006) argued that the "...equity extracted from homes has been used as a vehicle for spending but has not driven consumption higher. Instead, the net impact of MEW has been to allow households to take the opportunity afforded by low mortgage rates and rising house prices to diversify their wealth holdings." (Kasman, et al, 2006, page 1) By contrast, in a recent Goldman Sachs research paper, Hatzius argued that the proceeds from cash out refinancings and home equity loans "...have a statistically significant and economically large effect on consumer spending. Depending on the specification, we find that between 50% and 62% of all active MEW flows into consumption, controlling for the levels of wealth, income, and real interest rates." (Hatzius, 2006, page 1) Catte, et al (2005), in a study of ten OECD countries, found that the MPC out of housing wealth is largest in countries with "large, efficient, and responsive" mortgage markets. When they added a measure of MEW to the PCE equation for the U.S., the housing wealth variable dropped out, but the coefficient on MEW was significant, implying an MPC of 0.2, much larger than the MPC out of financial wealth.
III. Estimates of What People do with Extracted Home Equity
This section describes our method of estimating what people do with the equity they extract from their homes through each of three channels. For each channel, we first estimate the amount of free cash that results from the equity extraction (that is, extracted home equity available for spending, debt repayment, or the acquisition of assets). Then, we estimate what people did with those proceeds.
Home Sales
The free cash available to home sellers is equal to the value of existing home sales minus mortgage debt paid off at the time of sale, both first and second liens, and closing costs. We distinguish between three types of sellers: sellers of owner-occupied homes who then buy another home ("repeat buyers"), sellers of owner-occupied homes who do not buy another home ("non-repeat buyers"), and sellers of rental or vacant homes (these estimates are shown in lines 1 to 19 of table 1; the appendix provides a detailed description of the data and methods). According to our estimates, free cash generated by home sales (line 5) averaged about 44 percent of the value of sales during the 1991-2005 period. We estimate that 88 percent of the free cash went to sellers of owner-occupied homes, with the remaining 12 percent going to sellers of rental and vacant properties. On average, about 59 percent of the free cash flowing to owner-occupants went to repeat buyers, with the remaining 41 percent going to non-repeat buyers.
The next step is to estimate what each of the three types of sellers does with the free cash. For repeat buyers, we base the distribution on a survey conducted by the National Association of Realtors (NAR; see the appendix for further information on the survey). The survey results indicate that repeat buyers used 87 percent of the free cash to purchase of another home, 7 percent to finance PCE, and 6 percent for financial investments and other uses. A couple of caveats: the survey covered only 459 home sellers in 2003; obviously, it is a stretch to apply those results to the full sample period (1991 to the present) and to form inferences for the universe of sellers based on such a small number of respondents. However, the NAR data are the only survey information we are aware of that asked home sellers what they did with their sales proceeds, and they are in accord with our casual observation that repeat buyers use the vast majority of the free cash as a down payment on their next home purchase.
Moreover, we have no information on what sellers of rental and vacant homes do with their net sales proceeds. We assume that most sellers of these types of homes reinvest the bulk of the proceeds in another house. In lieu of any survey data to draw upon, we assume that the shares from the NAR survey (for repeat buyers) also apply to sellers of rental and vacant homes. We also do not have any survey data on what non-repeat buyers do with their sales proceeds. Our assumption is that these people save most of the funds. Specifically, we assume that 85 percent of the free cash going to non-repeat sellers is saved and the remaining 15 percent is used to finance PCE. The distribution from net proceeds to the uses of those funds is shown in lines 20 to 34 of table 1.
Home Equity Loans
The net funds available to people who take out home equity loans equals originations minus repayments, except for repayments resulting from other forms of equity extraction.7 By construction, originations of home equity loans minus "other" repayments equals:
(1) O![]() - R
- R![]() (other) =
(other) = ![]() HE + R
HE + R![]() (from home sales) + R
(from home sales) + R![]() (from refinancings)
(from refinancings)
where ![]() HE denotes the change in home equity debt outstanding and O
HE denotes the change in home equity debt outstanding and O![]() and
R
and
R![]() denote originations and repayments of home equity loans, respectively. We do not have data on home equity loan originations, but can calculate a truncated version-that is, total
originations minus "other" repayments, from the elements on the right-hand side of equation (1).
denote originations and repayments of home equity loans, respectively. We do not have data on home equity loan originations, but can calculate a truncated version-that is, total
originations minus "other" repayments, from the elements on the right-hand side of equation (1). ![]() HE is from the Flow of Funds Accounts, and, as mentioned previously, we generate
estimates of home equity loan repayments resulting from home sales and cash out refinancings. Detailed information on home equity loans is shown in lines 45 to 69 of table 2. The first panel shows total home equity debt; the second and third panels show data on closed-end loans and home equity
lines of credit (HELOCs).
HE is from the Flow of Funds Accounts, and, as mentioned previously, we generate
estimates of home equity loan repayments resulting from home sales and cash out refinancings. Detailed information on home equity loans is shown in lines 45 to 69 of table 2. The first panel shows total home equity debt; the second and third panels show data on closed-end loans and home equity
lines of credit (HELOCs).
Table A-1 shows results from three different sources regarding what people do with the proceeds of home equity loans (section III of the appendix provides more detail): special surveys conducted by the University of Michigan's Survey Research Center and surveys of lenders conducted by the Consumer Bankers Association (CBA) and the American Bankers Association (ABA). As indicated in the far-right column, which shows averages from all of the surveys over time, people use HELOCs and closed-end loans differently: whereas the proceeds from HELOCs tend to be divided about evenly among PCE, home improvements, and debt consolidation, about half of the proceeds of closed-end loans are used to repay non-mortgage debt, one-fourth for home improvements, and less than one-fifth for PCE. Because the Michigan data are based on a statistical sample and the surveys were designed specifically to address directly the question at hand, we believe they are the most accurate; accordingly, we rely primarily on those in distributing the proceeds of home equity loans.8
The results for closed-end and HELOC loans are combined in lines 45 to 53 of table 2. Transactions costs for home equity loans are trivial (see the appendix for a discussion of how we estimated these costs). Overall, about one-third of the net proceeds of HE loans are used to repay non-mortgage debt, one-third for home improvements, and about one-fourth for PCE.
Cash Out Refinancings
As described in the appendix, we estimate the gross cash out as refinance originations minus repayments of first liens resulting from refinancings. We then net out closing costs and home equity debt repaid at closing (which, by assumption, is folded into the new first lien). Survey results (described in the appendix) are used to distribute the free cash to PCE and other uses. These data are shown in lines 80 to 98 of table 2. The two largest uses of the free cash generated by refinancings are home improvements (about one-third) and repayment of non-mortgage debt, mainly credit card or installment debt (27 percent). Seventeen percent of the funds financed PCE.
From 1991 to 2005, the gross cash out averaged about 13 percent of refinance originations. Closing costs and home equity debt repaid at the time of the refi averaged 2 percent and 4 percent, respectively; the free cash generated by refinancings averaged about 7-1/2 percent of refinance originations.
IV. Disposition of Home Equity Extraction
In this section, we provide estimates of what people do with the equity extracted from their homes (lines 1 to 20 of table 2).9 During the 1991-2005 period, free cash resulting from the three types of equity extraction averaged about $530 billion annually. Equity extracted through sales of existing homes accounted for about two-thirds of total free cash; home equity loans accounted for close to 20 percent, and cash-out refinancings about 13 percent (lines 1 to 4 of table 2).10
According to our estimates, an average of $60 billion per year of home equity loans (15 percent of total HE debt outstanding at the beginning of the year) was repaid as a result of home sales and the refinancing of first liens during the 1991-2005 period (lines 14 and 15). Equity extraction was used to repay an average of about $50 billion of non-mortgage consumer debt per year from 1991 to 2005, about 3 percent of the outstanding balance of that debt at the beginning of the year (lines 5 and 6). Equity extraction also was used to finance about 41 percent of home improvement outlays over the same period (line 8). It is likely that people include expenditures for home repair and maintenance--outlays that the National Income and Product Accounts (NIPA) place in PCE--in the home improvements category, which would result in an upward bias to the share of equity extraction going to home improvements and a downward bias to the PCE share. This may at least partly explain why during the past couple of years our estimates of equity extraction used to finance home improvements actually exceed NIPA home improvement outlays. An estimated $164 billion per year of equity extraction was used to acquire assets (both financial and non-financial) or for business investments (line 11).11
According to our estimates, from 1991 to 2005, equity extracted from homes was used directly to finance an average of close to $66 billion per year of PCE, about 1 percent of the total (lines 9 and 10). From 1991 to 2000, equity extraction financed an average of 0.6 percent of total PCE, but since then that share has risen to almost 1-3/4 percent. If we include non-mortgage debt repayments (in which, as mentioned above, installment debt is used as bridge financing for PCE, with home mortgage debt as the ultimate source of funding), equity extraction financed an annual average of about $115 billion of PCE from 1991 to 2005, 1.7 percent of total PCE (lines 12 and 13). By this broader measure of PCE funding, equity extraction financed 1.1 percent of PCE from 1991 to 2000 and close to 3 percent from 2001 to 2005.
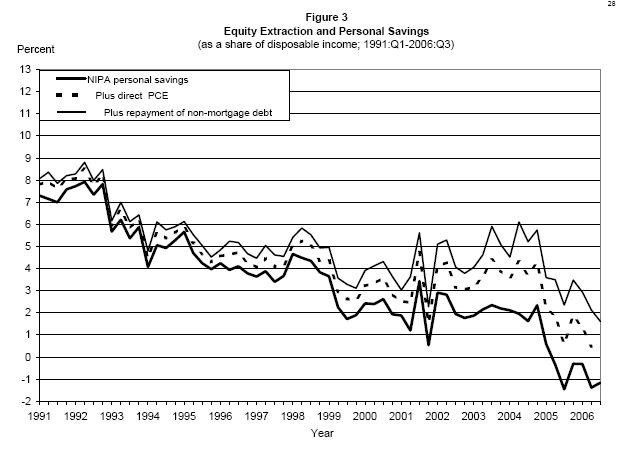
Data from the NIPA accounts on disposable income, personal savings, and the saving rate are shown in lines 104 to 106 of table 2. We use those data along with our estimates to conduct a counterfactual experiment: What would the personal saving rate have looked like if every dollar of home equity extraction that, according to our estimates, was used for PCE actually did support an additional dollar of PCE? We first subtract from total PCE, and add to total personal savings, equity extraction used directly to finance PCE. Specifically, line 111 adds to NIPA savings the direct PCE effect of equity extraction. Line 112 adds to NIPA saving both the direct PCE effect and the repayment of non-mortgage debt (bridge loans). Then, we calculate the saving rates with these adjustments (lines 113 and 114).
The NIPA saving rate declined 4.7 percentage points from the end of 1998 to the end of 2005. Adding the direct PCE affects to personal saving mutes that decline to 3-1/4 percentage points, and if we also add the effects of non-mortgage debt repayment the decline is 2.2 percentage points. As shown in figure 3, with either adjustment, the counterfactual saving rate changed little from 1998 to 2004, whereas the actual saving rate trended down. During the past year or so, the actual saving rate and both of the counterfactual savings rates have fallen sharply.
V. Estimates of Gross Equity Extraction from 1968 to 2005
In our previous paper, we presented estimates of equity extraction and its three components--turnover extraction, the change in home equity debt outstanding, and the gross cash out from refinancing--beginning in 1990:Q3, based, in part, on detailed calculations from the mortgage system we developed. A number of researchers have asked us to extend these series further back in time for use in econometric models, mainly equations for consumer spending and the personal saving rate. Owing to missing source data, our mortgage system cannot be estimated in its entirety before mid-1990. Nevertheless, we have developed methods that allow us to extend back some of the key series to the first quarter of 1968. Necessarily, the methods we use to extend the data back are much more general than those in our mortgage system, and some of the source data are less reliable. In some cases, source data are unavailable, and we had to make assumptions in order to fill in the gaps. For these reasons, the pre-1990 gross equity extraction estimates should be used cautiously. These data are available on request and are described further in the appendix.
| 1991 | 1992 | 1993 | 1994 | 1995 | 1996 | 1997 | 1998 | 1999 | 2000 | 2001 | 2002 | 2003 | 2004 | 2005 | Average 1991-2005 |
|
|---|---|---|---|---|---|---|---|---|---|---|---|---|---|---|---|---|
| (1) Value of existing homes sold (implied) | 425.6 | 401.6 | 408.3 | 449.0 | 419.3 | 521.3 | 533.9 | 655.6 | 800.0 | 875.2 | 946.8 | 1,102.3 | 1,379.2 | 1,577.0 | 1,920.9 | 827.7 |
| (2) Value of existing homes sold (implied) - Sellers' debt cancellation | 159.0 | 183.9 | 210.4 | 229.4 | 234.6 | 262.0 | 286.6 | 337.4 | 372.2 | 397.3 | 438.4 | 501.8 | 592.8 | 707.3 | 799.7 | 380.9 |
| (3) Value of existing homes sold (implied) - Closing costs on existing homes paid in cash | 34.9 | 33.0 | 32.6 | 35.6 | 32.9 | 40.9 | 41.9 | 50.9 | 61.4 | 66.7 | 71.2 | 82.3 | 102.1 | 117.1 | 142.3 | 63.1 |
| (4) Value of existing homes sold (implied) - Home equity loans paid off at the time of sale | 8.7 | 9.3 | 9.8 | 10.2 | 10.8 | 12.4 | 14.6 | 17.4 | 19.0 | 22.1 | 25.6 | 29.9 | 37.0 | 51.1 | 64.5 | 22.8 |
| (5) Net proceeds available to sellers of existing homes [(1)-(2)-(3)-(4)] | 223.1 | 175.4 | 155.5 | 173.8 | 141.1 | 206.0 | 190.8 | 249.9 | 347.3 | 389.0 | 411.6 | 488.2 | 647.2 | 701.5 | 914.5 | 361.0 |
| (6) Value of existing homes sold by type: Owner-occupied homes [(1-(18))*(1)] | 395.4 | 373.7 | 379.6 | 415.0 | 385.0 | 477.9 | 485.3 | 596.7 | 722.4 | 785.1 | 844.9 | 971.1 | 1,200.1 | 1,326.3 | 1,605.7 | 731.0 |
| (7) Value of existing homes sold by type: Owner-occupied homes [(1-(18))*(1)] - Repeat buyers [(19)*(6)] | 221.4 | 211.2 | 216.4 | 236.5 | 219.4 | 272.4 | 276.6 | 340.1 | 411.8 | 455.4 | 498.5 | 582.7 | 720.1 | 809.1 | 979.5 | 430.1 |
| (8) Value of existing homes sold by type: Owner-occupied homes [(1-(18))*(1)] - Non-repeat buyers [(6)-(7)] | 174.0 | 162.6 | 163.2 | 178.4 | 165.5 | 205.5 | 208.7 | 256.6 | 310.6 | 329.8 | 346.4 | 388.5 | 480.0 | 517.3 | 626.2 | 300.9 |
| (9) Value of existing homes sold by type: Rental and vacant homes [(18)*(1)] | 30.2 | 27.9 | 28.7 | 34.0 | 34.3 | 43.4 | 48.5 | 58.9 | 77.6 | 90.1 | 101.8 | 131.1 | 179.1 | 250.7 | 315.2 | 96.8 |
| (10) Sellers' debt cancellation by type: Owner-occupied homes [{(6)/(1)}*(2)] | 147.7 | 171.1 | 195.6 | 212.0 | 215.4 | 240.1 | 260.5 | 307.0 | 336.1 | 356.5 | 391.2 | 442.1 | 515.8 | 594.9 | 668.5 | 337.0 |
| (11) Sellers' debt cancellation by type: Owner-occupied homes [{(6)/(1)}*(2)] - Repeat buyers [{(7)/(6)}*(10)] | 82.7 | 96.7 | 111.5 | 120.8 | 122.8 | 136.9 | 148.5 | 175.0 | 191.6 | 206.7 | 230.8 | 265.3 | 309.5 | 362.9 | 407.8 | 198.0 |
| (12) Sellers' debt cancellation by type: Owner-occupied homes [{(6)/(1)}*(2)] - Non-repeat buyers [(10)-(11)] | 65.0 | 74.4 | 84.1 | 91.2 | 92.6 | 103.3 | 112.0 | 132.0 | 144.5 | 149.7 | 160.4 | 176.9 | 206.3 | 232.0 | 260.7 | 139.0 |
| (13) Sellers' debt cancellation by type: Rental and vacant homes [(2)-(10)] | 11.3 | 12.8 | 14.8 | 17.4 | 19.2 | 21.9 | 26.1 | 30.4 | 36.1 | 40.8 | 47.2 | 59.7 | 77.0 | 112.4 | 131.2 | 43.9 |
| (14) Decomposition of the net proceeds available to sellers of existing homes: Owner-occupied homes [(6)-(10)-{(6)/(1)}*{(3)+(4)}] | 207.2 | 163.2 | 144.6 | 160.7 | 129.6 | 188.9 | 173.5 | 227.5 | 313.6 | 348.9 | 367.3 | 430.1 | 563.3 | 590.0 | 764.4 | 318.2 |
| (15) Decomposition of the net proceeds available to sellers of existing homes: Owner-occupied homes [(6)-(10)-{(6)/(1)}*{(3)+(4)}] - Repeat buyers[{(7)/(6)}*(14)] | 116.1 | 92.2 | 82.4 | 91.6 | 73.8 | 107.7 | 98.9 | 129.7 | 178.8 | 202.4 | 216.7 | 258.1 | 338.0 | 359.9 | 466.3 | 187.5 |
| (16) Decomposition of the net proceeds available to sellers of existing homes: Owner-occupied homes [(6)-(10)-{(6)/(1)}*{(3)+(4)}] - Non-repeat buyers[(14)-(15)] | 91.2 | 71.0 | 62.2 | 69.1 | 55.7 | 81.2 | 74.6 | 97.8 | 134.8 | 146.6 | 150.6 | 172.1 | 225.3 | 230.1 | 298.1 | 130.7 |
| (17) Decomposition of the net proceeds available to sellers of existing homes: Rental and Vacant [(5)-(14)] | 15.9 | 12.2 | 10.9 | 13.1 | 11.5 | 17.1 | 17.3 | 22.4 | 33.7 | 40.1 | 44.2 | 58.1 | 84.0 | 111.5 | 150.1 | 42.8 |
| (18) Memo: Rental/vacant share of the value of homes purchased | 0.0716 | 0.0696 | 0.0707 | 0.0761 | 0.0825 | 0.0839 | 0.0913 | 0.0903 | 0.0974 | 0.1033 | 0.1079 | 0.1189 | 0.1303 | 0.1599 | 0.1641 | 0.1012 |
| (19) Memo: Repeat buyers' share of home purchases (AHS Chicago Title) | 0.5600 | 0.5650 | 0.5700 | 0.5700 | 0.5700 | 0.5700 | 0.5700 | 0.5700 | 0.5700 | 0.5800 | 0.5900 | 0.6000 | 0.6000 | 0.6100 | 0.6100 | 0.5803 |
| Fixed share: | 1991 | 1992 | 1993 | 1994 | 1995 | 1996 | 1997 | 1998 | 1999 | 2000 | 2001 | 2002 | 2003 | 2004 | 2005 | Average 1991-2005 |
|
|---|---|---|---|---|---|---|---|---|---|---|---|---|---|---|---|---|---|
| (20) Repeat buyers [(15)] | 116.1 | 92.2 | 82.4 | 91.6 | 73.8 | 107.7 | 98.9 | 129.7 | 178.8 | 202.4 | 216.7 | 258.1 | 338.0 | 359.9 | 466.3 | 187.5 | |
| (21) Repeat buyers [(15)] - Cash used to purchase a home [0.87*(20)] | 0.870 | 101.0 | 80.2 | 71.7 | 79.7 | 64.2 | 93.7 | 86.0 | 112.8 | 155.5 | 176.1 | 188.6 | 224.5 | 294.0 | 313.1 | 405.7 | 163.1 |
| (22) Repeat buyers [(15)] - PCE [0.03*(20)] | 0.030 | 3.5 | 2.8 | 2.5 | 2.7 | 2.2 | 3.2 | 3.0 | 3.9 | 5.4 | 6.1 | 6.5 | 7.7 | 10.1 | 10.8 | 14.0 | 5.6 |
| (23) Repeat buyers [(15)] - Financial investments and other [0.1*(20)] | 0.100 | 11.6 | 9.2 | 8.2 | 9.2 | 7.4 | 10.8 | 9.9 | 13.0 | 17.9 | 20.2 | 21.7 | 25.8 | 33.8 | 36.0 | 46.6 | 18.7 |
| (24) Non-repeat buyers [(16)] | 91.2 | 71.0 | 62.2 | 69.1 | 55.7 | 81.2 | 74.6 | 97.8 | 134.8 | 146.6 | 150.6 | 172.1 | 225.3 | 230.1 | 298.1 | 130.7 | |
| (25) Non-repeat buyers [(16)] - PCE [0.15*(24)] | 0.150 | 13.7 | 10.6 | 9.3 | 10.4 | 8.4 | 12.2 | 11.2 | 14.7 | 20.2 | 22.0 | 22.6 | 25.8 | 33.8 | 34.5 | 44.7 | 19.6 |
| (26) Non-repeat buyers [(16)] - Financial investments and other [0.85*(24)] | 0.850 | 77.5 | 60.3 | 52.9 | 58.7 | 47.4 | 69.1 | 63.4 | 83.1 | 114.6 | 124.6 | 128.0 | 146.2 | 191.5 | 195.6 | 253.4 | 111.1 |
| (27) Rental and vacant homes [(17)] | 15.9 | 12.2 | 10.9 | 13.1 | 11.5 | 17.1 | 17.3 | 22.4 | 33.7 | 40.1 | 44.2 | 58.1 | 84.0 | 111.5 | 150.1 | 42.8 | |
| (28) Rental and vacant homes [(17)] - Cash used to purchase a home [0.87*(27)] | 0.870 | 13.8 | 10.6 | 9.5 | 11.4 | 10.0 | 14.9 | 15.1 | 19.5 | 29.3 | 34.9 | 38.5 | 50.5 | 73.1 | 97.0 | 130.6 | 37.2 |
| (29) Rental and vacant homes [(17)] - PCE [0.03*(27)] | 0.030 | 0.5 | 0.4 | 0.3 | 0.4 | 0.3 | 0.5 | 0.5 | 0.7 | 1.0 | 1.2 | 1.3 | 1.7 | 2.5 | 3.3 | 4.5 | 1.3 |
| (30) Rental and vacant homes [(17)] - Financial investments and other [0.1*(27)] | 0.100 | 1.6 | 1.2 | 1.1 | 1.3 | 1.2 | 1.7 | 1.7 | 2.2 | 3.4 | 4.0 | 4.4 | 5.8 | 8.4 | 11.1 | 15.0 | 4.3 |
| 1991 | 1992 | 1993 | 1994 | 1995 | 1996 | 1997 | 1998 | 1999 | 2000 | 2001 | 2002 | 2003 | 2004 | 2005 | Average 1991-2005 |
|
|---|---|---|---|---|---|---|---|---|---|---|---|---|---|---|---|---|
| (31) Total [(5)] | 223.1 | 175.4 | 155.5 | 173.8 | 141.1 | 206.0 | 190.8 | 249.9 | 347.3 | 389.0 | 411.6 | 488.2 | 647.2 | 701.5 | 914.5 | 361.0 |
| (32) Total [(5)]: Cash used to purchase a home [(21)+(28)] | 114.8 | 90.8 | 81.2 | 91.1 | 74.3 | 108.6 | 101.1 | 132.3 | 184.8 | 211.0 | 227.0 | 275.1 | 367.1 | 410.1 | 536.2 | 200.4 |
| (33) Total [(5)]: PCE [(22)+(25)+(29)] | 17.6 | 13.8 | 12.1 | 13.5 | 10.9 | 15.9 | 14.7 | 19.2 | 26.6 | 29.3 | 30.4 | 35.3 | 46.5 | 48.7 | 63.2 | 26.5 |
| (34) Total [(5)]: Financial investments and other [(23)+(26)+(30)] | 90.7 | 70.8 | 62.2 | 69.2 | 55.9 | 81.5 | 75.0 | 98.3 | 135.9 | 148.8 | 154.1 | 177.9 | 233.7 | 242.7 | 315.0 | 134.1 |
| 1991 | 1992 | 1993 | 1994 | 1995 | 1996 | 1997 | 1998 | 1999 | 2000 | 2001 | 2002 | 2003 | 2004 | 2005 | Average 1991-2000 | Average 2001-2005 | Average 1991-2005 |
|
|---|---|---|---|---|---|---|---|---|---|---|---|---|---|---|---|---|---|---|
| (1) Free cash resulting from equity extraction [(2)+(3)+(4)]: | 262.2 | 212.2 | 193.2 | 223.4 | 184.5 | 277.1 | 276.0 | 346.9 | 467.2 | 553.4 | 626.9 | 757.8 | 1,003.3 | 1,170.1 | 1,428.9 | 299.6 | 997.4 | 532.2 |
| (2) Free cash resulting from equity extraction [(2)+(3)+(4)]: Home sales [(28)] | 223.1 | 175.4 | 155.5 | 173.8 | 141.1 | 206.0 | 190.8 | 249.9 | 347.3 | 389.0 | 411.6 | 488.2 | 647.2 | 701.5 | 914.5 | 225.2 | 632.6 | 361.0 |
| (3) Free cash resulting from equity extraction [(2)+(3)+(4)]: Home equity loans net of unscheduled payments [(47)-(48)-(16)] | 21.3 | 11.4 | 11.2 | 32.2 | 30.7 | 49.2 | 59.4 | 50.1 | 74.4 | 131.8 | 109.4 | 129.4 | 182.6 | 322.5 | 316.6 | 47.2 | 212.1 | 102.1 |
| (4) Free cash resulting from equity extraction [(2)+(3)+(4)]: Cash out refinancings [(85)] | 17.8 | 25.3 | 26.4 | 17.4 | 12.8 | 21.8 | 25.9 | 46.9 | 45.6 | 32.6 | 105.9 | 140.2 | 173.4 | 146.2 | 197.9 | 27.2 | 152.7 | 69.1 |
| (5) Used For: Repayment of non-mortgage debt [(30)+(49)+(86)] | 12.1 | 11.3 | 12.5 | 18.6 | 16.1 | 24.8 | 28.9 | 32.5 | 39.6 | 55.1 | 61.5 | 71.1 | 93.6 | 124.4 | 143.9 | 25.2 | 98.9 | 49.7 |
| (6) Used For: Repayment of non-mortgage debt [(30)+(49)+(86)] - As a share of consumer credit debt outstanding, beg. of year | 0.0147 | 0.0139 | 0.0152 | 0.0210 | 0.0158 | 0.0212 | 0.0227 | 0.0242 | 0.0275 | 0.0354 | 0.0352 | 0.0374 | 0.0465 | 0.0588 | 0.0644 | 0.0212 | 0.0485 | 0.0303 |
| (7) Used For: Home improvements [(50)+(87)] | 13.2 | 12.8 | 13.2 | 16.4 | 14.9 | 24.5 | 29.2 | 33.6 | 41.0 | 54.8 | 71.6 | 88.8 | 116.1 | 149.8 | 165.8 | 25.4 | 118.4 | 56.4 |
| (8) Used For: Home improvements [(50)+(87)] - As a share of outlays for residential improvements (NIPA) | 0.2318 | 0.2203 | 0.1949 | 0.2142 | 0.1868 | 0.2959 | 0.3285 | 0.3659 | 0.4315 | 0.5327 | 0.6548 | 0.7677 | 0.9241 | 1.0855 | 1.0880 | 0.3002 | 0.9040 | 0.4115 |
| (9) Used For: Personal consumption expenditures [(31)+(51)+(88)] | 26.3 | 21.3 | 19.3 | 22.8 | 19.6 | 30.2 | 32.4 | 37.5 | 51.1 | 64.3 | 79.2 | 101.2 | 133.7 | 170.4 | 182.7 | 32.5 | 133.4 | 66.1 |
| (10) Used For: Personal consumption expenditures [(31)+(51)+(88)] - As a share of total PCE | 0.0066 | 0.0050 | 0.0043 | 0.0048 | 0.0039 | 0.0057 | 0.0058 | 0.0064 | 0.0081 | 0.0095 | 0.0112 | 0.0138 | 0.0174 | 0.0207 | 0.0209 | 0.0060 | 0.0168 | 0.0096 |
| (11) Used For: Acquisition of assets and other [(32)+(52)+(89)-(16)] | 95.8 | 75.9 | 67.0 | 74.4 | 59.6 | 89.0 | 84.3 | 111.0 | 150.7 | 168.2 | 187.5 | 221.7 | 292.8 | 315.5 | 400.4 | 97.6 | 283.6 | 159.6 |
| (12) Memo: PCE plus non-mortgage debt repayment [(5)+(9)] | 38.4 | 32.6 | 31.8 | 41.4 | 35.8 | 55.0 | 61.4 | 70.0 | 90.8 | 119.4 | 140.7 | 172.3 | 227.3 | 294.8 | 326.5 | 57.7 | 232.3 | 115.9 |
| (13) Memo: PCE plus non-mortgage debt repayment [(5)+(9)] - As a share of total PCE | 0.0096 | 0.0077 | 0.0071 | 0.0087 | 0.0072 | 0.0105 | 0.0111 | 0.0119 | 0.0145 | 0.0177 | 0.0199 | 0.0234 | 0.0295 | 0.0359 | 0.0374 | 0.0106 | 0.0292 | 0.0168 |
| (14) Memo: HE debt repayment resulting from home sales and refis [(27)+(84)] | 16.8 | 19.1 | 20.8 | 24.1 | 18.4 | 27.8 | 28.9 | 41.2 | 54.6 | 64.0 | 77.1 | 79.6 | 97.5 | 146.0 | 190.7 | 31.6 | 118.2 | 60.4 |
| (15) Memo: HE debt repayment resulting from home sales and refis [(27)+(84)] - As a share of HE debt outstanding, end of previous year | 0.0782 | 0.0861 | 0.0960 | 0.1144 | 0.0831 | 0.1171 | 0.1099 | 0.1387 | 0.1760 | 0.1914 | 0.1893 | 0.1787 | 0.1946 | 0.2461 | 0.2449 | 0.1191 | 0.2107 | 0.1496 |
| (16) Memo: Unscheduled regular mortgage payments | 2.4 | 2.6 | 2.7 | 2.9 | 3.1 | 3.2 | 3.4 | 3.7 | 4.1 | 4.4 | 4.8 | 5.3 | 6.1 | 6.8 | 7.7 | 3.3 | 6.1 | 4.2 |
| (17) Memo: Closing costs on existing home sales, refinancings, and home equity loans [(26)+(48)+(83)] | 42.1 | 50.1 | 50.7 | 42.9 | 37.1 | 47.7 | 49.6 | 69.4 | 73.7 | 73.7 | 96.1 | 116.9 | 152.0 | 145.2 | 169.8 | 53.7 | 136.0 | 81.1 |
| (18) Memo: Gross equity extraction | 116.3 | 117.7 | 110.2 | 106.5 | 119.9 | 154.2 | 172.9 | 283.0 | 316.9 | 303.3 | 413.7 | 613.2 | 658.7 | 899.4 | 913.5 | 180.1 | 699.7 | 353.3 |
| (19) Memo: Turnover extraction + change in home equity loans outstanding net of unscheduled payments + gross cash out [(24)+(46)+(82)-(16)] | 161.4 | 133.2 | 117.4 | 137.8 | 103.1 | 177.4 | 176.3 | 232.8 | 320.5 | 377.6 | 442.5 | 531.4 | 693.9 | 807.6 | 976.5 | 193.7 | 690.4 | 359.3 |
| (20) Memo: Turnover extraction + change in home equity loans outstanding net of unscheduled payments + gross cash out [(24)+(46)+(82)-(16)] - Repayments discrepancy [(19)-(18)] | 45.1 | 15.5 | 7.2 | 31.3 | -16.8 | 23.3 | 3.4 | -50.3 | 3.6 | 74.3 | 28.8 | -81.8 | 35.2 | -91.8 | 63.0 | 13.7 | -9.3 | 6.0 |
| 1991 | 1992 | 1993 | 1994 | 1995 | 1996 | 1997 | 1998 | 1999 | 2000 | 2001 | 2002 | 2003 | 2004 | 2005 | Average 1991-2000 | Average 2001-2005 | Average 1991-2005 |
|
|---|---|---|---|---|---|---|---|---|---|---|---|---|---|---|---|---|---|---|
| (21) Value of existing home sales (implied) | 425.6 | 401.6 | 408.3 | 449.0 | 419.3 | 521.3 | 533.9 | 655.6 | 800.0 | 875.2 | 946.8 | 1,102.3 | 1,379.2 | 1,577.0 | 1,920.9 | 549.0 | 1,385.2 | 827.7 |
| (22) Value of existing home sales (implied): Existing home extensions | 282.8 | 272.5 | 281.8 | 320.6 | 300.7 | 373.9 | 384.5 | 472.0 | 579.5 | 625.8 | 666.3 | 758.9 | 917.8 | 1,069.3 | 1,298.8 | 389.4 | 942.2 | 573.7 |
| (23) Value of existing home sales (implied): Sellers' debt cancellation | 159.0 | 183.9 | 210.4 | 229.4 | 234.6 | 262.0 | 286.6 | 337.4 | 372.2 | 397.3 | 438.4 | 501.8 | 592.8 | 707.3 | 799.7 | 267.3 | 608.0 | 380.9 |
| (24) Turnover Extraction [(22)-(23)] | 123.8 | 88.6 | 71.5 | 91.2 | 66.1 | 111.9 | 97.9 | 134.7 | 207.3 | 228.5 | 227.9 | 257.1 | 325.1 | 362.0 | 499.1 | 122.1 | 334.2 | 192.8 |
| (25) Turnover Extraction [(22)-(23)] + Cash used to purchase existing homes | 142.9 | 129.1 | 126.5 | 128.4 | 118.6 | 147.4 | 149.4 | 183.5 | 220.4 | 249.4 | 280.4 | 343.3 | 461.4 | 507.7 | 622.2 | 159.6 | 443.0 | 254.0 |
| (26) Turnover Extraction [(22)-(23)] - Total closing costs paid in cash [(41)] | 34.9 | 33.0 | 32.6 | 35.6 | 32.9 | 40.9 | 41.9 | 50.9 | 61.4 | 66.7 | 71.2 | 82.3 | 102.1 | 117.1 | 142.3 | 43.1 | 103.0 | 63.1 |
| (27) Turnover Extraction [(22)-(23)] - Home equity loans paid off at time of sale | 8.7 | 9.3 | 9.8 | 10.2 | 10.8 | 12.4 | 14.6 | 17.4 | 19.0 | 22.1 | 25.6 | 29.9 | 37.0 | 51.1 | 64.5 | 13.4 | 41.6 | 22.8 |
| (28) Turnover Extraction [(22)-(23)] = Net proceeds available to sellers of existing homes | 223.1 | 175.4 | 155.5 | 173.8 | 141.1 | 206.0 | 190.8 | 249.9 | 347.3 | 389.0 | 411.6 | 488.2 | 647.2 | 701.5 | 914.5 | 225.2 | 632.6 | 361.0 |
| (29) Turnover Extraction [(22)-(23)] Used for: Home purchase (repeat buyers investors; new existing) | 114.8 | 90.8 | 81.2 | 91.1 | 74.3 | 108.6 | 101.1 | 132.3 | 184.8 | 211.0 | 227.0 | 275.1 | 367.1 | 410.1 | 536.2 | 119.0 | 363.1 | 200.4 |
| (30) Turnover Extraction [(22)-(23)] Used for: Repayment of non-mortgage debt | 0.0 | 0.0 | 0.0 | 0.0 | 0.0 | 0.0 | 0.0 | 0.0 | 0.0 | 0.0 | 0.0 | 0.0 | 0.0 | 0.0 | 0.0 | 0.0 | 0.0 | 0.0 |
| (31) Turnover Extraction [(22)-(23)] Used for: PCE | 17.6 | 13.8 | 12.1 | 13.5 | 10.9 | 15.9 | 14.7 | 19.2 | 26.6 | 29.3 | 30.4 | 35.3 | 46.5 | 48.7 | 63.2 | 17.4 | 44.8 | 26.5 |
| (32) Turnover Extraction [(22)-(23)] Used for: Investments (excluding homes) | 90.7 | 70.8 | 62.2 | 69.2 | 55.9 | 81.5 | 75.0 | 98.3 | 135.9 | 148.8 | 154.1 | 177.9 | 233.7 | 242.7 | 315.0 | 88.8 | 224.7 | 134.1 |
| (33) Memo: PCE plus repayment of non-mortgage debt [(30)+(31)] | 17.6 | 13.8 | 12.1 | 13.5 | 10.9 | 15.9 | 14.7 | 19.2 | 26.6 | 29.3 | 30.4 | 35.3 | 46.5 | 48.7 | 63.2 | 17.4 | 44.8 | 26.5 |
| (34) Memo: PCE plus repayment of non-mortgage debt [(30)+(31)] -> Closing costs paid in cash, ex. commissions [(0.0165)*(21)] | 7.0 | 6.6 | 6.7 | 7.4 | 6.9 | 8.6 | 8.8 | 10.8 | 13.2 | 14.4 | 15.6 | 18.2 | 22.8 | 26.0 | 31.7 | 9.1 | 22.9 | 13.7 |
| (35) Memo: PCE plus repayment of non-mortgage debt [(30)+(31)] -> Commissions on existing sales [(0.055)*(21)] | 23.4 | 22.1 | 22.5 | 24.7 | 23.1 | 28.7 | 29.4 | 36.1 | 44.0 | 48.1 | 52.1 | 60.6 | 75.9 | 86.7 | 105.7 | 30.2 | 76.2 | 45.5 |
| (36) Memo: Total closing costs paid in cash to purch. existing homes [(34)+(35)] | 30.4 | 28.7 | 29.2 | 32.1 | 30.0 | 37.3 | 38.2 | 46.9 | 57.2 | 62.6 | 67.7 | 78.8 | 98.6 | 112.8 | 137.3 | 39.3 | 99.0 | 59.2 |
| (37) Memo: Fixed parameters: Commission rate on existing homes 0.0550 | ||||||||||||||||||
| (38) Memo: Fixed parameters: Other closing costs paid in cash / home price 0.0165 | ||||||||||||||||||
| (39) Memo: Points, share of loan amount (FHFB, new and existing homes) | 0.0157 | 0.0157 | 0.0122 | 0.0110 | 0.0097 | 0.0096 | 0.0098 | 0.0085 | 0.0073 | 0.0067 | 0.0053 | 0.0046 | 0.0038 | 0.0040 | 0.0038 | 0.0106 | 0.0043 | 0.0085 |
| (40) Memo: Points paid [(39)*(22)] | 1.12 | 1.08 | 0.85 | 0.88 | 0.72 | 0.90 | 0.94 | 1.01 | 1.06 | 1.04 | 0.88 | 0.88 | 0.88 | 1.08 | 1.23 | 0.9607 | 0.9891 | 0.9702 |
| (41) Memo: Total closing costs paid in cash [(36)+(40)] | 34.9 | 33.0 | 32.6 | 35.6 | 32.9 | 40.9 | 41.9 | 50.9 | 61.4 | 66.7 | 71.2 | 82.3 | 102.1 | 117.1 | 142.3 | 43.1 | 103.0 | 63.1 |
| (42) Memo: Value of new home sales (implied) | 131.4 | 125.4 | 125.7 | 149.2 | 132.8 | 160.8 | 157.9 | 173.8 | 227.1 | 248.6 | 256.8 | 289.4 | 344.0 | 404.7 | 490.4 | 163.3 | 357.1 | 227.9 |
| (43) Memo: Closing costs and points on new homes | 8.3 | 7.9 | 7.6 | 8.9 | 7.8 | 9.5 | 9.3 | 10.1 | 13.0 | 14.1 | 14.3 | 16.0 | 18.8 | 22.2 | 26.8 | 9.6 | 19.6 | 13.0 |
| (44) Memo: Total closing costs on home sales [(43)+(41)}] | 43.2 | 40.9 | 40.2 | 44.6 | 40.7 | 50.3 | 51.3 | 61.0 | 74.4 | 80.8 | 85.5 | 98.3 | 121.0 | 139.2 | 169.0 | 52.7 | 122.6 | 76.0 |
| 1991 | 1992 | 1993 | 1994 | 1995 | 1996 | 1997 | 1998 | 1999 | 2000 | 2001 | 2002 | 2003 | 2004 | 2005 | Average 1991-2000 | Average 2001-2005 | Average 1991-2005 |
|
|---|---|---|---|---|---|---|---|---|---|---|---|---|---|---|---|---|---|---|
| (45) Level of home equity loans outstanding (FOF) | 222.0 | 217.1 | 210.4 | 221.8 | 237.5 | 262.6 | 297.0 | 309.9 | 334.3 | 407.4 | 445.1 | 501.1 | 593.4 | 778.4 | 913.7 | 272.0 | 646.3 | 396.8 |
| (46) Level of home equity loans outstanding (FOF) Change | 7.3 | -4.9 | -6.7 | 11.4 | 15.7 | 25.1 | 34.4 | 12.9 | 24.4 | 73.0 | 37.8 | 56.0 | 92.3 | 185.0 | 135.3 | 19.3 | 101.3 | 46.6 |
| (47) Level of home equity loans outstanding (FOF) + HE debt repayments from other EE [(46)+(14)]<1> | 24.1 | 14.2 | 14.1 | 35.5 | 34.1 | 52.9 | 63.3 | 54.1 | 79.0 | 137.0 | 114.9 | 135.6 | 189.8 | 331.0 | 325.9 | 50.8 | 219.4 | 107.0 |
| (48) Level of home equity loans outstanding (FOF) + HE debt repayments from other EE [(46)+(14)]<1> Transactions costs [(57)+(65)] | 0.4 | 0.2 | 0.2 | 0.4 | 0.3 | 0.4 | 0.5 | 0.4 | 0.5 | 0.8 | 0.7 | 0.9 | 1.1 | 1.8 | 1.7 | 0.4 | 1.2 | 0.7 |
| (49) Level of home equity loans outstanding (FOF) + HE debt repayments from other EE [(46)+(14)]<1> Repayment of non-mortgage debt [(58)+(66)] | 7.3 | 4.5 | 5.4 | 13.9 | 12.7 | 18.9 | 21.9 | 19.9 | 27.3 | 46.3 | 32.9 | 33.2 | 46.8 | 84.9 | 90.4 | 17.8 | 57.6 | 31.1 |
| (50) Level of home equity loans outstanding (FOF) + HE debt repayments from other EE [(46)+(14)]<1> Home improvements [(59)+(67)] | 7.1 | 4.2 | 4.2 | 10.5 | 10.6 | 17.1 | 20.4 | 17.6 | 25.5 | 43.7 | 35.6 | 41.1 | 57.2 | 100.1 | 98.5 | 16.1 | 66.5 | 32.9 |
| (51) Level of home equity loans outstanding (FOF) + HE debt repayments from other EE [(46)+(14)]<1> PCE [(60)+(68)] | 5.6 | 3.2 | 2.6 | 6.4 | 6.5 | 10.6 | 13.4 | 10.3 | 16.8 | 29.5 | 30.8 | 42.1 | 57.7 | 96.9 | 85.8 | 10.5 | 62.7 | 27.9 |
| (52) Level of home equity loans outstanding (FOF) + HE debt repayments from other EE [(46)+(14)]<1> Real estate and business expenses [(61)+(69)] | 3.7 | 2.1 | 1.8 | 4.3 | 4.0 | 5.9 | 7.1 | 6.0 | 8.8 | 16.7 | 14.8 | 18.3 | 27.0 | 47.4 | 49.5 | 6.0 | 31.4 | 14.5 |
| (53) Memo: PCE plus repayment of non-mortgage debt [(49)+(51)] | 12.9 | 7.7 | 8.0 | 20.3 | 19.3 | 29.4 | 35.3 | 30.2 | 44.1 | 75.8 | 63.7 | 75.3 | 104.5 | 181.8 | 176.3 | 28.3 | 120.3 | 59.0 |
| (54) Level of closed-end home equity loans (FOF) | 110.3 | 105.7 | 103.0 | 111.2 | 121.2 | 137.4 | 156.3 | 167.9 | 180.2 | 216.9 | 212.4 | 195.2 | 190.4 | 214.7 | 261.1 | 141.0 | 214.8 | 165.6 |
| (55) Level of closed-end home equity loans (FOF) Change | -1.5 | -4.7 | -2.6 | 8.2 | 10.0 | 16.2 | 18.9 | 11.6 | 12.3 | 36.8 | -4.6 | -17.2 | -4.8 | 24.3 | 46.4 | 10.5 | 8.8 | 10.0 |
| (56) Level of closed-end home equity loans (FOF) + HE repayment from other EE [{(54)/(45)}{t-1}*(14)+(55)]<1> | 7.1 | 4.8 | 7.5 | 20.1 | 19.3 | 30.7 | 34.1 | 33.5 | 42.1 | 71.0 | 35.6 | 19.0 | 30.0 | 67.3 | 100.7 | 27.0 | 50.5 | 34.8 |
| (57) Level of closed-end home equity loans (FOF) + HE repayment from other EE [{(54)/(45)}{t-1}*(14)+(55)]<1> Transactions costs [(78)*(56)] | 0.1 | 0.0 | 0.1 | 0.2 | 0.1 | 0.2 | 0.2 | 0.2 | 0.2 | 0.3 | 0.2 | 0.1 | 0.1 | 0.3 | 0.4 | 0.2 | 0.2 | 0.2 |
| (58) Level of closed-end home equity loans (FOF) + HE repayment from other EE [{(54)/(45)}{t-1}*(14)+(55)]<1> Repayment of non-mortgage debt [(70)*{(56)-(57)}] | 3.8 | 2.5 | 4.0 | 10.7 | 9.6 | 14.1 | 15.6 | 15.4 | 19.4 | 32.1 | 15.9 | 8.4 | 13.0 | 29.1 | 43.0 | 12.7 | 21.9 | 15.8 |
| (59) Level of closed-end home equity loans (FOF) + HE repayment from other EE [{(54)/(45)}{t-1}*(14)+(55)]<1> Home improvements [(71)*{(56)-(57)}] | 2.1 | 1.4 | 2.2 | 6.0 | 6.1 | 10.4 | 11.5 | 11.4 | 14.3 | 23.7 | 11.8 | 6.2 | 9.6 | 21.5 | 31.7 | 8.9 | 16.1 | 11.3 |
| (60) Level of closed-end home equity loans (FOF) + HE repayment from other EE [{(54)/(45)}{t-1}*(14)+(55)]<1> PCE [(72)*{(56)-(57)}] | 0.7 | 0.4 | 0.7 | 1.9 | 1.8 | 2.8 | 3.1 | 3.0 | 3.8 | 6.3 | 3.1 | 1.7 | 2.6 | 5.7 | 8.5 | 2.4 | 4.3 | 3.1 |
| (61) Level of closed-end home equity loans (FOF) + HE repayment from other EE [{(54)/(45)}{t-1}*(14)+(55)]<1> Real estate and business expenses [(73)*{(56)-(57)}] | 0.5 | 0.3 | 0.5 | 1.4 | 1.7 | 3.2 | 3.6 | 3.5 | 4.4 | 8.5 | 4.6 | 2.6 | 4.8 | 10.7 | 17.0 | 2.8 | 8.0 | 4.5 |
| (62) Level of home equity lines of credit (FOF) | 111.7 | 111.5 | 107.3 | 110.6 | 116.2 | 125.1 | 140.7 | 142.0 | 154.2 | 190.4 | 232.8 | 305.9 | 403.0 | 563.7 | 652.5 | 131.0 | 431.6 | 231.2 |
| (63) Level of home equity lines of credit (FOF) Change | 8.8 | -0.2 | -4.1 | 3.2 | 5.7 | 8.9 | 15.6 | 1.4 | 12.1 | 36.3 | 42.3 | 73.2 | 97.1 | 160.7 | 88.8 | 8.8 | 92.4 | 36.6 |
| (64) Level of home equity lines of credit (FOF) + HE repayment from EE [{(62)/(45)}{t-1}*(10)+(63)]<1> | 17.0 | 9.5 | 6.6 | 15.4 | 14.8 | 22.2 | 29.2 | 20.6 | 36.8 | 66.0 | 79.3 | 116.5 | 159.8 | 263.8 | 225.3 | 23.8 | 168.9 | 72.2 |
| (65) Level of home equity lines of credit (FOF) + HE repayment from EE [{(62)/(45)}{t-1}*(10)+(63)]<1> Transactions costs [(79)*(64)] | 0.3 | 0.1 | 0.1 | 0.2 | 0.2 | 0.2 | 0.3 | 0.2 | 0.3 | 0.5 | 0.6 | 0.8 | 1.0 | 1.5 | 1.3 | 0.2 | 1.0 | 0.5 |
| (66) Level of home equity lines of credit (FOF) + HE repayment from EE [{(62)/(45)}{t-1}*(10)+(63)]<1> Repayment of non-mortgage debt [(74)*{(64)-(65)}] | 3.5 | 2.0 | 1.4 | 3.2 | 3.1 | 4.8 | 6.3 | 4.4 | 8.0 | 14.2 | 16.9 | 24.8 | 33.8 | 55.8 | 47.4 | 5.1 | 35.8 | 15.3 |
| (67) Level of home equity lines of credit (FOF) + HE repayment from EE [{(62)/(45)}{t-1}*(10)+(63)]<1> Home improvements [(75)*{(64)-(65)}] | 5.0 | 2.8 | 2.0 | 4.6 | 4.5 | 6.7 | 8.9 | 6.3 | 11.2 | 20.0 | 23.9 | 34.9 | 47.6 | 78.6 | 66.8 | 7.2 | 50.4 | 21.6 |
| (68) Level of home equity lines of credit (FOF) + HE repayment from EE [{(62)/(45)}{t-1}*(10)+(63)]<1> PCE [(76)*{(64)-(65)}] | 5.0 | 2.8 | 1.9 | 4.5 | 4.8 | 7.8 | 10.3 | 7.3 | 13.0 | 23.2 | 27.7 | 40.5 | 55.2 | 91.1 | 77.4 | 8.0 | 58.4 | 24.8 |
| (69) Level of home equity lines of credit (FOF) + HE repayment from EE [{(62)/(45)}{t-1}*(10)+(63)]<1> Real estate and business expenses [(77)*{(64)-(65)}] | 3.2 | 1.8 | 1.2 | 2.9 | 2.3 | 2.6 | 3.5 | 2.5 | 4.4 | 8.2 | 10.2 | 15.6 | 22.2 | 36.7 | 32.5 | 3.2 | 23.5 | 10.0 |
| 1991 | 1992 | 1993 | 1994 | 1995 | 1996 | 1997 | 1998 | 1999 | 2000 | 2001 | 2002 | 2003 | 2004 | 2005 | Average 1991-2000 | Average 2001-2005 | Average 1991-2005 |
|
|---|---|---|---|---|---|---|---|---|---|---|---|---|---|---|---|---|---|---|
| (70) Repayment of non-mortgage debt | 0.5354 | 0.5354 | 0.5354 | 0.5354 | 0.4988 | 0.4621 | 0.4621 | 0.4621 | 0.4621 | 0.4549 | 0.4497 | 0.4446 | 0.4342 | 0.4342 | 0.4291 | 0.4944 | 0.4384 | 0.4757 |
| (71) Home improvements | 0.2992 | 0.2992 | 0.2992 | 0.2992 | 0.3201 | 0.3409 | 0.3409 | 0.3409 | 0.3409 | 0.3356 | 0.3318 | 0.3280 | 0.3203 | 0.3203 | 0.3165 | 0.3216 | 0.3234 | 0.3222 |
| (72) PCE | 0.0945 | 0.0945 | 0.0945 | 0.0945 | 0.0927 | 0.0909 | 0.0909 | 0.0909 | 0.0909 | 0.0895 | 0.0885 | 0.0875 | 0.0854 | 0.0854 | 0.0844 | 0.0924 | 0.0862 | 0.0903 |
| (73) Real estate and business expenses | 0.0709 | 0.0709 | 0.0709 | 0.0709 | 0.0885 | 0.1061 | 0.1061 | 0.1061 | 0.1061 | 0.1200 | 0.1300 | 0.1400 | 0.1600 | 0.1600 | 0.1700 | 0.0916 | 0.1520 | 0.1117 |
| 1991 | 1992 | 1993 | 1994 | 1995 | 1996 | 1997 | 1998 | 1999 | 2000 | 2001 | 2002 | 2003 | 2004 | 2005 | 2006 | Average 1991-2000 | Average 2001-2005 | Average 1991-2005 |
|
|---|---|---|---|---|---|---|---|---|---|---|---|---|---|---|---|---|---|---|---|
| (74) Repayment of non-mortgage debt | 0.2123 | 0.2123 | 0.2123 | 0.2123 | 0.2150 | 0.2178 | 0.2178 | 0.2178 | 0.2178 | 0.2166 | 0.2153 | 0.2141 | 0.2129 | 0.2129 | 0.2117 | 0.2105 | 0.2152 | 0.2134 | 0.2146 |
| (75) Home improvements | 0.3019 | 0.3019 | 0.3019 | 0.3019 | 0.3043 | 0.3067 | 0.3067 | 0.3067 | 0.3067 | 0.3050 | 0.3032 | 0.3015 | 0.2998 | 0.2998 | 0.2981 | 0.2964 | 0.3043 | 0.3005 | 0.3031 |
| (76) PCE | 0.2972 | 0.2972 | 0.2972 | 0.2972 | 0.3264 | 0.3556 | 0.3556 | 0.3556 | 0.3556 | 0.3535 | 0.3515 | 0.3495 | 0.3475 | 0.3475 | 0.3455 | 0.3434 | 0.3291 | 0.3483 | 0.3355 |
| (77) Real estate and business expenses | 0.1887 | 0.1887 | 0.1887 | 0.1887 | 0.1543 | 0.1200 | 0.1200 | 0.1200 | 0.1200 | 0.1250 | 0.1300 | 0.1350 | 0.1400 | 0.1400 | 0.1450 | 0.1500 | 0.1514 | 0.1380 | 0.1469 |
| (78) Memo: costs of obtaining HE loans as a share of loan amount - Closed-end | 0.0110 | 0.0101 | 0.0092 | 0.0082 | 0.0073 | 0.0066 | 0.0059 | 0.0052 | 0.0050 | 0.0048 | 0.0046 | 0.0045 | 0.0043 | 0.0041 | 0.0041 | 0.0073 | 0.0043 | 0.0063 | |
| (79) Memo: costs of obtaining HE loans as a share of loan amount - HELOCS | 0.0169 | 0.0157 | 0.0146 | 0.0134 | 0.0123 | 0.0111 | 0.0099 | 0.0088 | 0.0082 | 0.0077 | 0.0072 | 0.0067 | 0.0062 | 0.0058 | 0.0057 | 0.0119 | 0.0063 | 0.0100 |
1. HE repayment from other EE (equity extraction): repayments of home equity loans from the proceeds of home sales or cash our refinancings.
| 1991 | 1992 | 1993 | 1994 | 1995 | 1996 | 1997 | 1998 | 1999 | 2000 | 2001 | 2002 | 2003 | 2004 | 2005 | Average 1991-2000 | Average 2001-2005 | Average 1991-2005 |
|
|---|---|---|---|---|---|---|---|---|---|---|---|---|---|---|---|---|---|---|
| (80) Refinance originations | 601.8 | 732.9 | 295.4 | 181.3 | 290.5 | 324.3 | 864.0 | 588.2 | 316.8 | 1,363.3 | 1,987.0 | 3,010.9 | 1,595.0 | 1,586.7 | 443.8 | 1,908.6 | 932.1 | 931.0 |
| (81) Repayments resulting from refinancings (first liens) | 549.8 | 677.4 | 257.2 | 156.8 | 246.8 | 277.0 | 775.2 | 495.4 | 236.3 | 1,181.7 | 1,763.4 | 2,728.3 | 1,327.6 | 1,236.9 | 388.2 | 1,647.6 | 808.0 | 807.1 |
| (82) Repayments resulting from refinancings (first liens): Gross cash out [(80)-(81)] | 52.0 | 55.4 | 38.1 | 24.4 | 43.7 | 47.4 | 88.8 | 92.9 | 80.5 | 181.6 | 223.7 | 282.6 | 267.4 | 349.8 | 55.6 | 261.0 | 124.1 | 123.9 |
| (83) Repayments resulting from refinancings (first liens): Closing costs [(94)*(80)] | 16.9 | 17.9 | 6.9 | 4.0 | 6.4 | 7.2 | 18.1 | 11.7 | 6.1 | 24.1 | 33.7 | 48.7 | 26.3 | 25.8 | 10.2 | 31.7 | 17.4 | 17.4 |
| (84) Repayments resulting from refinancings (first liens): Home equity loan repayments [(96)*(80)] | 9.8 | 11.1 | 13.9 | 7.7 | 15.4 | 14.3 | 23.7 | 35.5 | 41.9 | 51.5 | 49.7 | 60.5 | 94.9 | 126.1 | 18.1 | 76.5 | 37.6 | 37.6 |
| (85) Repayments resulting from refinancings (first liens): Free cash generated by refinancings [(82)-(83)-(84)] | 25.3 | 26.4 | 17.4 | 12.8 | 21.8 | 25.9 | 46.9 | 45.6 | 32.6 | 105.9 | 140.2 | 173.4 | 146.2 | 197.9 | 27.2 | 152.7 | 69.1 | 69.0 |
| (86) Used for: Repayment of non-mortgage debt [(0.27)*(85)] | 6.8 | 7.1 | 4.7 | 3.4 | 5.9 | 7.0 | 12.7 | 12.3 | 8.8 | 28.6 | 37.9 | 46.8 | 39.5 | 53.4 | 7.4 | 41.2 | 18.7 | 18.6 |
| (87) Used for: Home improvements [(0.34)*(85)] | 8.6 | 9.0 | 5.9 | 4.3 | 7.4 | 8.8 | 16.0 | 15.5 | 11.1 | 36.0 | 47.7 | 59.0 | 49.7 | 67.3 | 9.3 | 51.9 | 23.5 | 23.5 |
| (88) Used for: PCE [(0.17)*(85)] | 4.3 | 4.5 | 2.9 | 2.2 | 3.7 | 4.4 | 8.0 | 7.7 | 5.5 | 18.0 | 23.8 | 29.5 | 24.9 | 33.6 | 4.6 | 26.0 | 11.7 | 11.7 |
| (89) Used for: Acquisition of assets and other [(90)+(91)] | 5.6 | 5.8 | 3.8 | 2.8 | 4.8 | 5.7 | 10.3 | 10.0 | 7.2 | 23.3 | 30.8 | 38.2 | 32.2 | 43.5 | 6.0 | 33.6 | 15.2 | 15.2 |
| (90) Used for: Acquisition of assets and other [(90)+(91)] - Financial assets [(0.075)*(85)] | 1.9 | 2.0 | 1.3 | 1.0 | 1.6 | 1.9 | 3.5 | 3.4 | 2.4 | 7.9 | 10.5 | 13.0 | 11.0 | 14.8 | 2.0 | 11.5 | 5.2 | 5.2 |
| (91) Used for: Acquisition of assets and other [(90)+(91)] - Real estate or business investments [(0.145)*(85)] | 3.7 | 3.8 | 2.5 | 1.9 | 3.2 | 3.8 | 6.8 | 6.6 | 4.7 | 15.4 | 20.3 | 25.1 | 21.2 | 28.7 | 4.0 | 22.1 | 10.0 | 10.0 |
| (92) Used for: PCE plus repayment of non-mortgage debt [(88)+(86)] | 11.1 | 11.6 | 7.6 | 5.6 | 9.6 | 11.4 | 20.6 | 20.1 | 14.3 | 46.6 | 61.7 | 76.3 | 64.3 | 87.1 | 12.0 | 67.2 | 30.4 | 30.3 |
| (93) Memo: Gross cash out share [(82)/(80)] | 0.0865 | 0.0756 | 0.1291 | 0.1347 | 0.1503 | 0.1461 | 0.1028 | 0.1579 | 0.2541 | 0.1332 | 0.1126 | 0.0939 | 0.1677 | 0.2205 | 0.1372 | 0.1456 | 0.1400 | 0.1400 |
| (93) Memo: GCO share, no-cash out loans (inferred from Freddie Mac data) | 0.0441 | 0.0417 | 0.0921 | 0.0757 | 0.0793 | 0.0694 | 0.0490 | 0.0932 | 0.1550 | 0.0582 | 0.0470 | 0.0399 | 0.0764 | 0.0954 | 0.0764 | 0.0634 | 0.0721 | 0.0721 |
| (94) Memo: Fees and points / refinance orig. [(0.0125)+(95)] | 0.0282 | 0.0247 | 0.0235 | 0.0222 | 0.0221 | 0.0223 | 0.0210 | 0.0198 | 0.0192 | 0.0178 | 0.0171 | 0.0163 | 0.0165 | 0.0163 | 0.0231 | 0.0168 | 0.0210 | 0.0210 |
| (95) Memo: Fees and points / refinance orig. [(0.0125)+(95)] - Points (FHFB) [(39)] | 0.0157 | 0.0122 | 0.0110 | 0.0097 | 0.0096 | 0.0098 | 0.0085 | 0.0073 | 0.0067 | 0.0053 | 0.0046 | 0.0038 | 0.0040 | 0.0038 | 0.0106 | 0.0043 | 0.0085 | 0.0085 |
| (96) Memo: Home equity loans paid of at refi. / refi orig. [(93)-(94)] | 0.0159 | 0.0169 | 0.0686 | 0.0535 | 0.0572 | 0.0472 | 0.0279 | 0.0734 | 0.1358 | 0.0404 | 0.0299 | 0.0236 | 0.0599 | 0.0792 | 0.0533 | 0.0466 | 0.0510 | 0.0510 |
| (97) Memo: Free cash as a share of refinance originations [(85)/(80)] | 0.0421 | 0.0361 | 0.0587 | 0.0704 | 0.0751 | 0.0798 | 0.0543 | 0.0775 | 0.1029 | 0.0777 | 0.0706 | 0.0576 | 0.0917 | 0.1247 | 0.0670 | 0.0845 | 0.0728 | 0.0728 |
| (98) Memo: Ratio: Free cash / gross cash out [(85)/(82)] | 0.4864 | 0.4770 | 0.4552 | 0.5228 | 0.4997 | 0.5462 | 0.5283 | 0.4908 | 0.4048 | 0.5835 | 0.6270 | 0.6136 | 0.5467 | 0.5657 | 0.4954 | 0.5873 | 0.5260 | 0.5260 |
Lines 93 and 93: source Freddie Mac and our estimates
| 1998:Q1-1999:Q1 | 2001:Q1-2002:Q2 | Average | |
|---|---|---|---|
| (a): Repayment of nonmortgage debt | 0.2800 | 0.2600 | 0.2700 |
| (b): Home improvements | 0.3300 | 0.3500 | 0.3400 |
| (c): PCE | 0.1800 | 0.1600 | 0.1700 |
| (d): Stock market and other investments | 0.0200 | 0.1100 | 0.0750 |
| (e): Real estate, business investment, or taxes | 0.1900 | 0.1200 | 0.1450 |
| 1991 | 1992 | 1993 | 1994 | 1995 | 1996 | 1997 | 1998 | 1999 | 2000 | 2001 | 2002 | 2003 | 2004 | 2005 | Average 1991-2000 | Average 2001-2005 | Average 1991-2005 |
|
|---|---|---|---|---|---|---|---|---|---|---|---|---|---|---|---|---|---|---|
| (99) Gross equity extraction [(18)] | 116.3 | 117.7 | 110.2 | 106.5 | 119.9 | 154.2 | 172.9 | 283.0 | 316.9 | 303.3 | 413.7 | 613.2 | 658.7 | 899.4 | 913.5 | 180.1 | 699.7 | 353.3 |
| (100) Gross equity extraction [(18)]: Net equity extraction [(1)-(17)] | 74.2 | 67.5 | 59.5 | 63.6 | 82.7 | 106.4 | 123.2 | 213.6 | 243.2 | 229.6 | 317.6 | 496.2 | 506.7 | 754.2 | 743.7 | 126.4 | 563.7 | 272.2 |
| (101) Gross equity extraction [(18)]: Net equity extraction [(1)-(17)] As percent of disposable income | 1.66 | 1.42 | 1.21 | 1.24 | 1.53 | 1.87 | 2.06 | 3.34 | 3.63 | 3.19 | 4.24 | 6.34 | 6.21 | 8.69 | 8.23 | 2.12 | 6.74 | 3.66 |
| (102) Free cash generated by equity extraction [(1)] | 262.2 | 212.2 | 193.2 | 223.4 | 184.5 | 277.1 | 276.0 | 346.9 | 467.2 | 553.4 | 626.9 | 757.8 | 1,003.3 | 1,170.1 | 1,428.9 | 299.6 | 997.4 | 532.2 |
| (103) Free cash generated by equity extraction [(1)]: As percent of disposable income | 5.87 | 4.47 | 3.93 | 4.34 | 3.41 | 4.87 | 4.61 | 5.42 | 6.98 | 7.69 | 8.37 | 9.68 | 12.29 | 13.48 | 15.81 | 5.16 | 11.93 | 7.42 |
| (104) Disposable income (NSA) | 4,464.3 | 4,751.4 | 4,911.9 | 5,151.8 | 5,408.2 | 5,688.5 | 5,988.8 | 6,395.9 | 6,695.0 | 7,194.0 | 7,486.8 | 7,830.1 | 8,162.5 | 8,681.6 | 9,036.1 | 5,665.0 | 8,239.4 | 6,523.1 |
| (105) Disposable income (NSA): NIPA personal saving | 324.2 | 366.0 | 284.0 | 249.5 | 250.9 | 228.4 | 218.3 | 276.8 | 158.6 | 168.5 | 132.3 | 184.7 | 174.9 | 174.3 | -34.8 | 252.5 | 126.3 | 210.4 |
| (106) Disposable income (NSA): NIPA personal saving - NIPA savings rate, percent | 7.26 | 7.70 | 5.78 | 4.84 | 4.64 | 4.02 | 3.65 | 4.33 | 2.37 | 2.34 | 1.77 | 2.36 | 2.14 | 2.01 | -0.39 | 4.69 | 1.58 | 3.65 |
| (107) PCE financed by Equity Extraction: Direct effects [(9)] | 26.3 | 21.3 | 19.3 | 22.8 | 19.6 | 30.2 | 32.4 | 37.5 | 51.1 | 64.3 | 79.2 | 101.2 | 133.7 | 170.4 | 182.7 | 32.5 | 133.4 | 66.1 |
| (108) PCE financed by Equity Extraction: Direct effects [(9)] As a percent of disposable income | 0.59 | 0.45 | 0.39 | 0.44 | 0.36 | 0.53 | 0.54 | 0.59 | 0.76 | 0.89 | 1.06 | 1.29 | 1.64 | 1.96 | 2.02 | 0.56 | 1.59 | 0.90 |
| (109) PCE financed by Equity Extraction: Direct effects plus repayment of non-mortgage debt [(12)] | 38.4 | 32.6 | 31.8 | 41.4 | 35.8 | 55.0 | 61.4 | 70.0 | 90.8 | 119.4 | 140.7 | 172.3 | 227.3 | 294.8 | 326.5 | 57.7 | 232.3 | 115.9 |
| (110) PCE financed by Equity Extraction: Direct effects plus repayment of non-mortgage debt [(12)] As a percent of disposable income | 0.86 | 0.69 | 0.65 | 0.80 | 0.66 | 0.97 | 1.02 | 1.10 | 1.36 | 1.66 | 1.88 | 2.20 | 2.78 | 3.40 | 3.61 | 0.98 | 2.77 | 1.58 |
| (111) NIPA personal saving plus: Direct PCE effect [(105)+(107)] | 350.4 | 387.3 | 303.3 | 272.3 | 270.6 | 258.6 | 250.8 | 314.3 | 209.7 | 232.7 | 211.6 | 286.0 | 308.5 | 344.7 | 147.8 | 285.0 | 259.7 | 276.6 |
| (112) NIPA personal saving plus: Direct PCE effect [(105)+(107)] - Repayment of non-mortgage debt [(105)+(109)] | 362.5 | 398.7 | 315.8 | 290.9 | 286.7 | 283.4 | 279.7 | 346.8 | 249.3 | 287.9 | 273.1 | 357.0 | 402.1 | 469.1 | 291.7 | 310.2 | 358.6 | 326.3 |
| (113) NIPA personal saving rate plus: Direct PCE effect [100*(111)/(104)] | 7.85 | 8.15 | 6.17 | 5.29 | 5.00 | 4.55 | 4.19 | 4.91 | 3.13 | 3.24 | 2.83 | 3.65 | 3.78 | 3.97 | 1.64 | 5.25 | 3.17 | 4.56 |
| (114) NIPA personal saving rate plus: Direct PCE effect [100*(111)/(104)] - Repayment of non-mortgage debt [100*(112)/(104)] | 8.12 | 8.39 | 6.43 | 5.65 | 5.30 | 4.98 | 4.67 | 5.42 | 3.72 | 4.00 | 3.65 | 4.56 | 4.93 | 5.40 | 3.23 | 5.67 | 4.35 | 5.23 |
I. Notes on Tables 1 and 2
Table 1: "A Decomposition of the Proceeds from Home Sales"
The table presents data on the net proceeds realized by sellers of existing homes. We decompose the net proceeds into those resulting from sales of owner-occupied (OO) and rental and vacant (RV) homes. We also estimate the shares of sales by owner-occupants who purchase another home (repeat buyers) and those that do not (non-repeat buyers).
Description of Selected Lines of the Table:
1. The "implied" value of existing homes sold: our estimate of mortgage originations to purchase existing homes divided by the product of the mortgaged share of home purchases and the loan-to-price (LTP) ratio for existing homes. There is a significant difference between the implied value of existing sales and the value of sales based on data from the National Association of Realtors (NAR).12 We use the implied value of sales rather than the published value in order to ensure consistency among the various series in our mortgage system.
2. Sellers' debt cancellation: our estimate, described in an appendix E of our previous paper.
3. Closing costs paid by buyers and sellers of existing homes; includes commissions, taxes, and various fees (more on this below).
4. There are no comprehensive data available on home equity loans (second liens) paid off by home sellers. We estimate those repayments as follows: First, we calculate the average amount of home equity (HE) loans outstanding per housing unit as the total dollar value of HE loans outstanding (from the (FFA) divided by the number of residential properties in structures with one to four units and condos and coops in structures with more than four units. We assume that the average amount of HE debt outstanding on homes that are sold is the same as that on all homes. Thus, multiplying average HE debt per home by the number of homes sold yields an estimate of home equity debt paid off when homes are sold.
5. Proceeds to sellers of existing homes net of debt cancellation and closing costs: these are the funds available to sellers after paying off all junior liens and closing costs; that is, free cash generated by home sales. Note that closing costs paid by both buyers and sellers are netted out.
6 to 9. The decomposition of the total value of home sales into owner-occupied (OO) and rental and vacant homes (RV) is based on data from the Home Mortgage Disclosure Act (HMDA) and Census's Residential Finance Survey (RFS).
10 to 17. We allocate sellers' debt cancellation and free cash proportionately between the different types of sellers based on their shares in the value of sales.
18. The RV share of the value of home purchases is based on data from HMDA and the 2001 RFS. We assume that the RV share of sales is the same as the RV share of purchases.
19. We use three sources to estimate the shares of first-time and repeat-buyers of owner-occupied homes: a survey conducted by the Chicago Title and Trust Company from 1990 to 1999, compilations of data from the American Housing Survey (AHS) from 1989 to 2005, and data from various issues of "Profile of Home Buyers and Sellers" published by the National Association of Realtors.
Table 2: "Sources and Uses of Equity Extracted from Homes"
Most of the data in lines 1 to 20 are either self-explanatory or described elsewhere.
Line 34 to 44 show components of closing costs. We assume that the commission rate was fixed at 5-1/2 percent during the sample period and that other closing costs (including taxes) are fixed at 2.2 percent of the value of home sales. 1.65 percentage points of those costs are paid in cash, and the remainder is folded into the buyer's mortgage. Points are from the Federal Housing Finance Board's (FHFB) Monthly Interest Rate Survey.
II. Closing Costs
This section describes how we estimated the costs associated with selling or buying a home, taking out a home equity loan, and refinancing a first lien.
Home Sales. The costs associated with home sales typically include an origination fee, discount points, title insurance, a survey fee, fees paid to attorneys, and mortgage, recording, and transfer taxes.
Sales commissions: We assume a commission rate of 5-1/2 percent, similar to the rate that the Bureau of Economic Analysis (BEA) uses in the National Income and Product Accounts (NIPA), and about the same as the rate on FHA loans in a study conducted by HUD.13
Points: As mentioned above, points are from the FHFB survey. We assume that all points are paid out-of-pocket, half by buyers and half by sellers.
There are no recent data that we are aware of that provide a thorough accounting of the other costs, mainly miscellaneous fees and taxes, associated with home purchases. Our estimate of these other costs is based largely on three sources: (1) a study of the closing costs on transactions involving FHA loans, conducted by HUD; (2) data provided to us by the FHA on closing costs associated with both home purchase and refi loans from 1990 to 2003; and (3) data on closing costs in various locations around the US obtained from an informal web search.14 Based on these sources, we assume that fees and taxes (excluding commissions and points) averaged 2.2 percent of the value of the home during the sample period. It is compelling to argue, as many people do, that closing costs have trended down over the past fifteen years because of increased efficiencies and competition among lenders; however, the data we have looked at do not show any indication of a significant decline.
In our calculations, we assume a fixed tax rate of 0.2 percent of the home price, about equal to the median in our informal survey and similar to the implied tax rate in the HUD study, mentioned above. We assume that buyers and sellers split the taxes and fees equally, and that half of the closing costs paid by buyers are folded into a mortgage. Commissions are paid by sellers.
Our assumptions regarding closing costs, taxes, and commissions (excluding points) are summarized in the following table:
| Taxes | Commissions | Other Fees | Total | |
|---|---|---|---|---|
| Total | 0.20 | 5.50 | 2.00 | 7.70 |
| Paid by: Buyer | 0.10 | 0.00 | 1.00 | 1.10 |
| Paid by: Buyer - Cash | 0.05 | 0.00 | 0.50 | 0.55 |
| Paid by: Buyer - Folded into mortgage | 0.05 | 0.00 | 0.50 | 0.55 |
| Paid by: Seller | 0.10 | 5.50 | 1.00 | 6.60 |
| Memo: Closing costs excluding commissions: | 2.20 | |||
| Memo: Paid in cash | 1.65 | |||
| Memo: Folded into mortgage | 0.55 |
We make the same assumptions for new homes, except that the commission rate is 3 percent.
Refinancings. We consulted two sources to estimate the costs associated with mortgage refinancings, (1) data from the FHA on refi loans originated from 1990 to 2003, and (2) data on closing costs associated with refinancings gathered from a web search, similar to that described above for home purchase loans. Taxes associated with refis are lower than for home purchase loans, largely because of the absence of transfer taxes.15 Other fees associated with refis tend to be somewhat lower than the corresponding fees for home purchases, and, of course, there are no commissions involved. We assume that the closing costs (including taxes) associated with refis average 1-1/4 percent of the loan amount.
We also assume that the average points associated with refi loans are the same as for home purchase loans. Finally, based on anecdotal reports, we assume that all taxes and closing costs are folded into the new loan.
Home Equity Loans. We compiled data on closing costs for home equity loans from various issues of the "Home Equity Survey Report" published by the American Bankers Association. As shown in the table below, those data indicate that from 1988 to 2004, the average costs associated with opening a home equity line of credit (HELOC) trended down significantly. For example, in 1990 closing costs for a HELOC averaged 1-1/4 percent of the average loan amount, but only 0.4 percent in 2004. The cost of taking out a closed-end loan also declined from 1998 to 2004.
| 1988 | 1990 | 1995 | 1998 | 2004 | |
|---|---|---|---|---|---|
| HELOCs | 1.71 | 1.23 | 0.72 | 0.51 | 0.41 |
| Closed-end loans | n.a. | n.a. | n.a. | 0.86 | 0.57 |
III. Survey Results on the What People Do With Extracted Home Equity
This section summarizes survey data on what people report they do with home equity liquefied through home equity loans, cash out refinancings, and home sales.
A. Home Equity Loans
We consulted results from three different surveys: a survey of households conducted by the University of Michigan's Survey Research Center, a survey of lenders conducted by the Consumer Bankers Association, and a survey of lenders conducted by the American Bankers Association. Table A-1 summarizes the results of these surveys.
The Michigan Survey
"To obtain information on the prevalence of home equity accounts and their use by homeowners, the Federal Reserve Board helped develop questions for inclusion in the Surveys of Consumers, conducted by the Survey Research Center of the University of Michigan..." (Canner, et al, 1998 p. 250) Respondents were allowed to cite multiple uses for a single loan; the survey did not ask people to indicate the percentage of the funds used for various purposes. The percentages shown in table A-1 were normalized so that they sum to 100.16 We distinguish in the table between HELOCs and closed-end loans.
Home Equity Loan Study, Consumer Bankers Association
Since the mid-1980s, the Consumer Bankers Association (CBA) has sponsored an annual survey of lenders specializing in home equity loans. Among other things, the survey asks: "Approximately, what percent of your open-end lines and closed-end loans are used for the following purposes..." The survey form includes twelve possible responses; we collapse those twelve categories into the four general categories shown in table A-1.17 The surveys typically include about forty large lenders.
Surveys from The American Bankers Association (ABA)
The data from 1991 shown in the table are from the ABA "Home Equity Lines of Credit Survey" and the data from subsequent years are from the "Home Equity Lending Survey." The respondents include banks and thrifts.
According to data from HMDA, about 22 percent of the homes purchased in 2005 with a first lien also included a second lien, sometimes referred to as a "piggyback loan," up from 14 percent in 2004. According to the RFS, piggybacks were much less common before 2001 (the HMDA data do not allow us to identify precisely piggyback loans before 2004). According to the 1999 Michigan survey, the shares of HELOCs and closed-end loans used for real estate were 4 and 8 percent, respectively (table A-1); we assume those shares trended up to 7 and 14 percent by the end of 2005. We based these judgmental adjustments, in part, on the recent HMDA data and on data from the CBA survey. These adjustments are admittedly crude and we plan to examine them further in future work.
B. Cash Outs from Refinancing
The Federal Reserve Board sponsored questions in the Surveys of Consumers conducted by the Survey Research Center at the University of Michigan in order to learn about mortgage refinancings.18 The shares in the table below pertain to what people did with the free cash generated by the refi; that is, cash available after all closing costs and taxes and home equity loans repaid at closing. People who refinance a first lien and have a second lien outstanding almost always repay the second lien at closing and fold the balance into the new first lien. Thus, by our interpretation, the category "repayment of other debts" in the table above does not include home equity debt repayment; it only includes credit card and other types of consumer loans.
In the National Income and Product Accounts (NIPAs), home improvement outlays are part of residential investment, whereas home repairs are part of PCE. It is likely that a significant part of what respondents identified as home improvements actually was home repairs, which would understate the share of funds used for PCE and overstate the share used for residential investment. To the extent that such a bias exists, our allocation of the proceeds from cash out refinancings understates the portion used to fund PCE.
| 1998:Q1-1999:Q1 | 2001:Q1-2002:Q2 | Average | |
|---|---|---|---|
| Share of funds used for: PCE | 18.0 | 16.0 | 17.0 |
| Share of funds used for: Repayment of other debts | 28.0 | 26.0 | 27.0 |
| Share of funds Total | 46.0 | 44.0 | 45.0 |
| Home improvement | 33.0 | 35.0 | 34.0 |
| Real estate, business investment, or taxes | 19.0 | 12.0 | 15.5 |
| Stock market and other financial investments | 2.0 | 11.0 | 6.5 |
| Total | 100.0 | 100.0 | 100.0 |
As shown in the table, the shares of funds used for PCE, debt repayment, and home improvements are about the same in the two survey periods. However, the share used for "real estate, business investment, and taxes" declined in the second period, while the share for stock market and other financial investments jumped, from 2 percent to 11 percent. In mapping from free cash generated by refis to the ways in which people use those funds, we simply average the proportions from the two surveys.20
C. Home Sales: People Who Sold a Home and Bought another Home
In August and September of 2003, the National Association of Realtors (NAR) conducted a survey of 459 homeowners. If a respondent had previously owned a home and had sold it, the survey asked what the seller did with the sales proceeds. Of the respondents, 240 had previously owned a home (repeat buyers) and 218 were first-time buyers. Of the 240 repeat buyers, 147 realized a gain on the sale of their previous home; the table below summarizes what they said they did with the proceeds:21
Regarding the share of the proceeds used for PCE, the broadest interpretation would include items 4, 5, and 7, which sum to 4 percent. A narrower interpretation would include only items 4 and 5, which sum to 2 percent. In our estimates, we assume that 3 percent of the sales proceeds going to repeat buyers are used for PCE. Note that neither home improvements nor repayment of non-mortgage debt was included as a possible use of the funds. Respondents may have included proceeds used for these purposes in the "other' category, which is very small. Repayment of mortgage debt also is not included as a possible use of the funds, although second liens must be paid off at the time the home is sold. The implication is that the respondents interpreted the question as asking what sellers did with the money left over after all liens on the home were retired.
| Repeat Home Buyers | Percent |
|---|---|
| 1. Down payment for next home purchase | 82 |
| 2. Down payment for a second home | 5 |
| 3. Investments in financial assets | 4 |
| 4. Gifts | 1 |
| 5. Vacation, automobile, or education | 1 |
| 6. Put money in bank | 5 |
| 7. Other | 2 |
IV. Estimating the Gross Cash Out of Home Equity from Refinancing and Free Cash Generated by Refinancings
This appendix provides only a brief summary of our methods and the source data; see appendix E of our previous paper for details. The gross cash out (GCO) is defined as the increase in mortgage debt resulting from refinancing:
(1) GCO ![]() (O
(O![]() - R
- R![]() = O
= O![]() *
* ![]()
where O![]() and R
and R![]() denote the dollar value of refi originations and repayments
resulting from refis, respectively, and
denote the dollar value of refi originations and repayments
resulting from refis, respectively, and ![]() , the gross cash out share, defined as (1 - R
, the gross cash out share, defined as (1 - R![]() /O
/O![]() . We assume that all closing costs associated with refinancings and junior liens paid off at the time of the refinancing are folded into the new loan. Under these
assumptions, the gross cash out contains three components: closing costs, junior lien repayments, and free cash. We separately estimate the first two components and calculate free cash as a residual. As discussed above, we assume that the closing costs associated with refinance loans average 1-1/4
percent of the loan amount and that points are equal to the FHFB series on average points paid in home purchase loans.
. We assume that all closing costs associated with refinancings and junior liens paid off at the time of the refinancing are folded into the new loan. Under these
assumptions, the gross cash out contains three components: closing costs, junior lien repayments, and free cash. We separately estimate the first two components and calculate free cash as a residual. As discussed above, we assume that the closing costs associated with refinance loans average 1-1/4
percent of the loan amount and that points are equal to the FHFB series on average points paid in home purchase loans.
Freddie Mac also publishes data that allow us to calculate the gross cash out share for loans in which no cash was taken out.22 We assume that the increase in the loan balance for no-cash out loans reflects closing costs and home equity debt repaid at the time of refinancing.23 Thus, the difference between the gross cash out share for all loans and the share for no-cash out loans is equal to free cash generated by refinancings. For example, from 1993 to 2002, the average increase in the balance of no cash out loans was about 6-1/4 percent. Fees and points (described above) averaged about 1-1/4 percent of the new loan amount over that period, implying that junior liens retired at the time of the refinancing averaged about 5 percent of the new loan amount. The average increase in the balance of all refi loans over the same period was close to 14 percent, and thus free cash resulting from refinancings averaged more than 7 percent of the new loan amount.24
V. Estimates of Gross Equity Extraction Beginning in 1968
This appendix describes the methods and source data we used to extend the gross equity extraction series back to 1968; these data are available on request.
A. New Home Originations
From 1980:Q1 to 1990:Q1:
One of the series in the Department of Housing and Urban Development's (HUD) Survey of Mortgage Lending Activity (SMLA) was mortgage originations used to finance the purchase of new homes. We estimate new home originations during this period as new home originations from SMLA multiplied by a scaling factor: the ratio of MDO in the FFA to MDO in SMLA.
From 1968:Q1 to 1979:Q4:
Originations to purchase new homes is based on the value of new homes purchased multiplied by the mortgaged share of purchases and the loan-to-price (LTP) ratio.
- The value of new homes is based on data from the Census Bureau.25
- In our mortgage system, the mortgaged share of new homes purchased is based on data from the 2000 RFS and from American Housing Surveys from 1989 to 2003. We assume that the mortgaged share is fixed at 89 percent from 1968 to 1990.26
- Mean loan-to-price ratio from 1968 to 1989: The LTP ratio for conventional loans is available from FHFB's monthly survey. The overall LTP ratio also includes VA-guaranteed and FHA loans, both of which have LTP ratios of about one. In the early 1990s, the overall LTP ratio exceeded the conventional LTP by 2.7 percent. We estimate the overall LTP ratio from 1968 to 1989 as the conventional LTP ratio multiplied by 1.027.
- Implied new home originations equals the product of the value of new homes purchased, the mortgaged share, and the LTP ratio. We then multiply implied originations by a scale factor equal to 0.85 to adjust for the typical difference between implied originations and the SMLA-based estimate, described above, during the 1980s.
B. Mortgage Debt Outstanding Excluding Construction Loans
Total MDO in the Flow of Funds Accounts (FFA) is available over the entire sample period, but the series on home equity and construction loans outstanding begin in 1980 and 1970, respectively.
- Home Equity MDO: From 1979:Q4 to 1990:Q3 the estimates were made by Federal Reserve staff based, in part, on data from the Surveys of Consumer Finances in 1983 and 1989. For the period from 1967:Q4 to 1979:Q3 we assume that the share of HE debt in total MDO trended up gradually, from 1.2 percent in 1968:Q1 to 3.9 percent in 1980:Q1.
- We assume that construction loans in 1968 and 1969 constituted 2 percent of total MDO, the same as its share in 1970.
C. Amortization
The calculation of amortization on regular mortgage debt requires the weighted-average coupon rate (WAC), the average term to maturity of the outstanding debt, and the level of debt outstanding at the beginning of the period.
- From 1977 to 1990, we use a WAC estimated by the Bureau of Economic Analysis. Before that, we estimate the WAC as the fitted values from a regression equation that relates the WAC to a distributed lag of the Baa bond yield.
- The average term to maturity as estimated by Credit Suisse First Boston begins in 1980. We assume that the average term, again on the basis of anecdotal evidence, trended up a bit from 1969 to 1980.
D. Turnover Extraction
Originations to purchase existing homes before 1990:Q2: equal to the value of existing homes purchased multiplied by the mortgaged share and the LTP ratio for existing homes (based on the same data and assumptions as for new homes), the share of assumed mortgages (based on data from the American Housing Survey, the assumed share of mortgages is fixed at 8 percent before 1985; it trends down thereafter), and an adjustment factor to account for a discrepancy from 1991 to 2004 between the estimate of originations to purchase existing homes in our mortgage system and the level of originations implied by the value of sales, the LTP ratio, the mortgaged share (described in our previous paper).
Sellers' debt cancellation: our mortgage system has estimates from 1990:Q2 onward. Before then, we assume that sellers' debt cancellation is a fixed share of originations to purchase existing homes, 70 percent-the average ratio from 1993 to 2005 (we exclude the data from 1990:Q2 to 1992:Q4 because the quality of the source data is relatively poor in those years).27
Using the notation from our previous paper:28
(1) EE = Q - [A - D] = (B - F) + (C - E) + (X - G) - ![]()
Where
EE: gross equity extraction
Q: The change in home mortgage debt outstanding excluding construction loans
A: New home originations
D: Scheduled amortization
B: Existing home originations
F: Home sellers' mortgage cancellation
C: Refinance originations
E: Cancellation of refinanced loans
X: The change in home equity loans outstanding
G: Unscheduled repayments
![]() the repayments discrepancy
the repayments discrepancy
Some people have defined "active mortgage equity withdrawal," or "active MEW," as the gross cash out plus the change in home equity MDO. Active MEW is available beginning in 1990:Q2; before then, we cannot disentangle the gross cash out from the repayments discrepancy. Thus, the closest we can come to estimating active MEW is:
(2) EE - (B - F) + (G) = (C - E) + X - ![]()
The right-hand side of (2) equals active MEW plus the repayments discrepancy. As noted above, we have estimates of the change in home equity MDO before 1990, but not the gross cash out.
| 1991 | 1993-1994 | 1995 | 1996 | 1997 | 1998 | 1999 | 2000 | 2001 | 2002 | 2003 | 2004 | 2005 | Average | |||
|---|---|---|---|---|---|---|---|---|---|---|---|---|---|---|---|---|
| Lines of Credit | ABA | Mich | CBA | ABA | Mich | ABA | CBA | ABA | CBA | CBA | CBA | ABA | CBA | |||
| Personal consumption spending1 | 21 | 30 | 29 | 20 | 36 | 21 | 33 | 14 | 33 | 32 | 31 | 12 | 40 | 27 | ||
| Repayment of non-mortgage debt | 37 | 21 | 37 | 36 | 22 | 39 | 39 | 33 | 38 | 35 | 38 | 37 | 27 | 34 | ||
| Home improvements | 33 | 30 | 28 | 29 | 31 | 23 | 24 | 29 | 24 | 23 | 24 | 26 | 24 | 27 | ||
| Other2 | 10 | 19 | 6 | 15 | 12 | 16 | 4 | 24 | 5 | 9 | 8 | 25 | 8 | 12 | ||
| Other: Real estate | 6 | 4 | 5 |
Notes:"Mich" (1993-94 and 1997) denotes data from the University of Michigan's Survey Research Center. "CBA" (1996, 1998, and 2002 to 2005) denotes data from the Consumer Bankers Association "Home Equity Loan Study". The CBA surveys in 1993 and 1996 pertain to loans made during the caledar year. The surveys from 2002 onward were conducted in the third quarter and pertain to loans made from July of the previous year to June of the year indicated. The survey includes most of the largest holding companies in the U.S. and many retail lenders."ABA" denotes the American Bankers Association "Home Equity Lines of Credit Survey" (1991) and "Home Equity Lending Survey." The survey includes commerical banks, savings banks, and S&Ls. 1. Includes spending for education, automobiles, medical and dental expenses, weddings, and vacations.2. The other categories of both the Michigan survey and the CBA survey include purchases of real estate (eg., piggy back loans or another home) and business expenses.
| 1991 | 1993-1994 | 1995 | 1996 | 1997 | 1998 | 1999 | 2000 | 2001 | 2002 | 2003 | 2004 | 2005 | Average | |||
|---|---|---|---|---|---|---|---|---|---|---|---|---|---|---|---|---|
| Personal consumption spending1 | 9 | 27 | 18 | 9 | 16 | 22 | 17 | 21 | 26 | 13 | 12 | 19 | 17 | |||
| Repayment of non-mortgage debt | 54 | 40 | 36 | 46 | 46 | 48 | 37 | 47 | 44 | 53 | 45 | 45 | 45 | |||
| Home improvements | 30 | 29 | 29 | 34 | 32 | 25 | 33 | 26 | 21 | 16 | 30 | 23 | 27 | |||
| Other2 | 7 | 4 | 17 | 11 | 7 | 5 | 14 | 6 | 9 | 18 | 13 | 13 | 10 | |||
| Other: Real estate | 6 | 8 | 7 |
Notes:1. Includes spending for education, automobiles, medical and dental expenses, weddings, and vacations.2. The other categories of both the Michigan survey and the CBA survey include purchases of real estate (eg., piggy back loans or another home) and business expenses.
| 2004 Q1 | Q2 | Q3 | Q4 | 2005 Q1 | Q2 | Q3 | Q4 | 2006 Q1 | Q2 | Q3 | Q4 | |
|---|---|---|---|---|---|---|---|---|---|---|---|---|
| (1) Free cash resulting from equity extraction [(2)+(3)+(4)]: | 203.1 | 358.9 | 309.2 | 298.9 | 278.6 | 394.1 | 400.0 | 356.2 | 320.6 | 332.8 | 279.6 | |
| (2) Free cash resulting from equity extraction [(2)+(3)+(4)]: Home sales [(28)] | 121.6 | 216.8 | 186.4 | 176.6 | 171.8 | 262.8 | 265.5 | 214.3 | 195.2 | 197.9 | 174.9 | |
| (3) Free cash resulting from equity extraction [(2)+(3)+(4)]: Home equity loans net of unscheduled payments [(47)-(48)-(16)] | 49.9 | 98.5 | 92.4 | 81.7 | 64.5 | 89.5 | 79.4 | 83.3 | 71.7 | 86.5 | 67.2 | |
| (4) Free cash resulting from equity extraction [(2)+(3)+(4)]: Cash out refinancings [(85)] | 31.6 | 43.6 | 30.3 | 40.6 | 42.4 | 41.8 | 55.1 | 58.5 | 53.6 | 48.4 | 37.5 | |
| (5) Used For: Repayment of non-mortgage debt [(30)+(49)+(86)] | 19.6 | 38.8 | 32.7 | 33.3 | 29.7 | 37.2 | 39.8 | 37.1 | 38.4 | 38.5 | 27.3 | |
| (6) Used For: Repayment of non-mortgage debt [(30)+(49)+(86)] As a share of consumer credit debt outstanding, beg. of year | 0.0093 | 0.0184 | 0.0154 | 0.0153 | 0.0133 | 0.0168 | 0.0178 | 0.0162 | 0.0165 | 0.0168 | 0.0117 | |
| (7) Used For: Home improvements [(50)+(87)] | 26.2 | 45.4 | 38.9 | 39.3 | 34.5 | 42.0 | 43.6 | 45.6 | 40.9 | 43.3 | 33.6 | |
| (8) Used For: Home improvements [(50)+(87)] As a share of outlays for residential improvements (NIPA) | 0.7407 | 1.2517 | 1.0481 | 1.0309 | 0.8843 | 1.0492 | 1.0632 | 1.0835 | 0.9472 | 0.9733 | 0.7398 | |
| (9) Used For: Personal consumption expenditures [(31)+(51)+(88)] | 31.5 | 50.6 | 45.5 | 42.8 | 36.9 | 48.9 | 46.5 | 50.3 | 38.1 | 44.3 | 39.2 | |
| (10) Used For: Personal consumption expenditures [(31)+(51)+(88)] As a share of total PCE | 0.0157 | 0.0248 | 0.0220 | 0.0203 | 0.0173 | 0.0225 | 0.0210 | 0.0225 | 0.0168 | 0.0192 | 0.0168 | |
| (11) Used For: Acquisition of assets and other [(32)+(52)+(89)-(16)] | 54.4 | 97.8 | 83.3 | 80.1 | 76.8 | 111.9 | 114.3 | 97.4 | 88.8 | 90.6 | 77.0 | |
| (12) Memo: PCE plus non-mortgage debt repayment [(5)+(9)] | 51.1 | 89.3 | 78.2 | 76.0 | 66.6 | 86.1 | 86.4 | 87.4 | 76.4 | 82.8 | 66.5 | |
| (13) Memo: PCE plus non-mortgage debt repayment [(5)+(9)] As a share of total PCE | 0.0255 | 0.0439 | 0.0379 | 0.0361 | 0.0313 | 0.0397 | 0.0390 | 0.0392 | 0.0337 | 0.0359 | 0.0285 | |
| (14) Memo: HE debt repayment resulting from home sales and refis [(27)+(84)] | 26.4 | 45.1 | 35.8 | 38.8 | 38.2 | 44.6 | 52.1 | 55.8 | 51.0 | 44.8 | 39.0 | |
| (15) Memo: HE debt repayment resulting from home sales and refis [(27)+(84)] As a share of HE debt outstanding, end of previous year | 0.0444 | 0.0728 | 0.0531 | 0.0529 | 0.0491 | 0.0553 | 0.0610 | 0.0631 | 0.0558 | 0.0478 | 0.0398 | |
| (16) Memo: Unscheduled regular mortgage payments | 1.6 | 1.7 | 1.7 | 1.8 | 1.8 | 1.9 | 1.9 | 2.0 | 2.1 | 2.1 | 2.2 | |
| (17) Memo: Closing costs on existing home sales, refinancings, and home equity loans [(26)+(48)+(83)] | 27.6 | 43.1 | 38.1 | 36.4 | 32.9 | 47.2 | 48.9 | 40.8 | 35.4 | 41.9 | 39.1 | |
| (18) Memo: Gross equity extraction | 188.7 | 232.3 | 268.0 | 211.2 | 156.5 | 243.5 | 284.8 | 228.7 | 191.4 | 193.6 | 151.0 | |
| (19) Memo: Turnover extraction + change in home equity loans outstanding net of unscheduled payments + gross cash out [(24)+(46)+(82)-(16)] | 136.0 | 247.5 | 212.0 | 212.2 | 198.4 | 263.6 | 265.4 | 249.0 | 230.7 | 226.4 | 185.3 | |
| (20) Memo: Turnover extraction + change in home equity loans outstanding net of unscheduled payments + gross cash out [(24)+(46)+(82)-(16)] -> Repayments discrepancy [(19)-(18)] | -52.9 | 16.9 | -56.9 | 1.2 | 41.9 | 20.1 | -19.4 | 20.3 | 39.2 | 32.9 | 34.2 |
| 2004 Q1 | Q2 | Q3 | Q4 | 2005 Q1 | Q2 | Q3 | Q4 | 2006 Q1 | Q2 | Q3 | Q4 | |
|---|---|---|---|---|---|---|---|---|---|---|---|---|
| (21) Value of existing home sales (implied) | 278.7 | 467.4 | 436.5 | 394.3 | 355.9 | 550.5 | 561.7 | 452.7 | 393.8 | 483.3 | 447.2 | |
| (22) Value of existing home sales (implied) Existing home extensions | 184.0 | 312.9 | 301.2 | 271.2 | 242.9 | 372.8 | 378.2 | 304.8 | 268.5 | 335.0 | 313.7 | |
| (23) Value of existing home sales (implied) Sellers' debt cancellation | 128.0 | 201.9 | 202.5 | 174.9 | 146.4 | 228.4 | 235.5 | 189.3 | 156.5 | 230.2 | 220.3 | |
| (24) Turnover Extraction [(22)-(23)] | 56.0 | 111.0 | 98.7 | 96.3 | 96.5 | 144.4 | 142.7 | 115.5 | 112.0 | 104.8 | 93.4 | |
| (25) Turnover Extraction [(22)-(23)] + Cash used to purchase existing homes | 94.7 | 154.5 | 135.3 | 123.1 | 113.1 | 177.7 | 183.5 | 147.9 | 125.4 | 148.3 | 133.5 | |
| (26) Turnover Extraction [(22)-(23)] - Total closing costs paid in cash [(41)] | 20.7 | 34.5 | 32.5 | 29.3 | 26.3 | 40.9 | 41.6 | 33.5 | 29.1 | 35.8 | 33.3 | |
| (27) Turnover Extraction [(22)-(23)] - Home equity loans paid off at time of sale | 8.4 | 14.1 | 15.1 | 13.5 | 11.5 | 18.4 | 19.1 | 15.5 | 13.0 | 19.3 | 18.7 | |
| (28) Turnover Extraction [(22)-(23)] = Net proceeds available to sellers of existing homes | 121.6 | 216.8 | 186.4 | 176.6 | 171.8 | 262.8 | 265.5 | 214.3 | 195.2 | 197.9 | 174.9 | |
| (29) Used for: Home purchase (repeat buyers investors; new existing) | 71.4 | 126.4 | 108.7 | 103.5 | 100.7 | 154.1 | 155.7 | 125.7 | 114.5 | 116.1 | 102.6 | |
| (30) Used for: Repayment of non-mortgage debt | 0.0 | 0.0 | 0.0 | 0.0 | 0.0 | 0.0 | 0.0 | 0.0 | 0.0 | 0.0 | 0.0 | |
| (31) Used for: PCE | 8.4 | 15.1 | 13.0 | 12.2 | 11.9 | 18.2 | 18.4 | 14.8 | 13.5 | 13.7 | 12.1 | |
| (32) Used for: Investments (excluding homes) | 41.8 | 75.3 | 64.8 | 60.8 | 59.2 | 90.5 | 91.5 | 73.8 | 67.3 | 68.2 | 60.3 | |
| (33) PCE plus repayment of non-mortgage debt [(30)+(31)] | 8.4 | 15.1 | 13.0 | 12.2 | 11.9 | 18.2 | 18.4 | 14.8 | 13.5 | 13.7 | 12.1 | |
| (34) PCE plus repayment of non-mortgage debt [(30)+(31)]: Closing costs paid in cash, ex. commissions [(0.0165)*(21)] | 4.6 | 7.7 | 7.2 | 6.5 | 5.9 | 9.1 | 9.3 | 7.5 | 6.5 | 8.0 | 7.4 | |
| (35) PCE plus repayment of non-mortgage debt [(30)+(31)]: Commissions on existing sales [(0.055)*(21)] | 15.3 | 25.7 | 24.0 | 21.7 | 19.6 | 30.3 | 30.9 | 24.9 | 21.7 | 26.6 | 24.6 | |
| (36) Total closing costs paid in cash to purch. existing homes [(34)+(35)] | 19.9 | 33.4 | 31.2 | 28.2 | 25.4 | 39.4 | 40.2 | 32.4 | 28.2 | 34.6 | 32.0 | |
| (37) Fixed parameters: Commission rate on existing homes 0.0550 | ||||||||||||
| (38) Fixed parameters: Other closing costs paid in cash / home price 0.0165 | ||||||||||||
| (39) Points, share of loan amount (FHFB, new and existing homes) | 0.0042 | 0.0036 | 0.0043 | 0.0041 | 0.0035 | 0.0040 | 0.0037 | 0.0039 | 0.0036 | 0.0038 | 0.0043 | |
| (40) Points paid [(39)*(22)] | 0.8 | 1.1 | 1.3 | 1.1 | 0.9 | 1.5 | 1.4 | 1.2 | 1.0 | 1.3 | 1.4 | |
| (41) Total closing costs paid in cash [(36)+(40)] | 20.7 | 34.5 | 32.5 | 29.3 | 26.3 | 40.9 | 41.6 | 33.5 | 29.1 | 35.8 | 33.3 | |
| (42) Value of new home sales (implied) | 82.5 | 103.9 | 100.7 | 117.6 | 107.0 | 122.5 | 126.7 | 134.3 | 104.2 | 102.1 | 95.0 | |
| (43) Closing costs and points on new homes | 4.5 | 5.7 | 5.5 | 6.4 | 5.8 | 6.7 | 6.9 | 7.3 | 5.7 | 5.6 | 5.2 | |
| (44) Total closing costs on home sales [(43)+(41)}] | 25.2 | 40.2 | 38.1 | 35.7 | 32.1 | 47.6 | 48.5 | 40.9 | 34.8 | 41.4 | 38.6 |
| 2004 Q1 | Q2 | Q3 | Q4 | 2005 Q1 | Q2 | Q3 | Q4 | 2006 Q1 | Q2 | Q3 | Q4 | |
|---|---|---|---|---|---|---|---|---|---|---|---|---|
| (45) Level of home equity loans outstanding (FOF) | 618.8 | 674.4 | 733.3 | 778.4 | 806.9 | 854.1 | 883.7 | 913.7 | 936.9 | 981.1 | 1,011.9 | |
| (46) Level of home equity loans outstanding (FOF) Change | 25.4 | 55.6 | 58.8 | 45.1 | 28.4 | 47.2 | 29.6 | 30.0 | 23.2 | 44.3 | 30.7 | |
| (47) Level of home equity loans outstanding (FOF) + HE debt repayments from other EE [(46)+(14)]<1> | 51.8 | 100.7 | 94.6 | 84.0 | 66.6 | 91.8 | 81.7 | 85.8 | 74.2 | 89.1 | 69.8 | |
| (48) Level of home equity loans outstanding (FOF) + HE debt repayments from other EE [(46)+(14)]<1>: Transactions costs [(57)+(65)] | 0.3 | 0.5 | 0.5 | 0.4 | 0.3 | 0.5 | 0.4 | 0.5 | 0.4 | 0.5 | 0.4 | |
| (49) Level of home equity loans outstanding (FOF) + HE debt repayments from other EE [(46)+(14)]<1>: Repayment of non-mortgage debt [(58)+(66)] | 11.1 | 27.0 | 24.5 | 22.3 | 18.2 | 25.9 | 24.9 | 21.3 | 23.9 | 25.4 | 17.2 | |
| (50) Level of home equity loans outstanding (FOF) + HE debt repayments from other EE [(46)+(14)]<1>: Home improvements [(59)+(67)] | 15.4 | 30.6 | 28.6 | 25.5 | 20.1 | 27.8 | 24.9 | 25.7 | 22.6 | 26.9 | 20.8 | |
| (51) Level of home equity loans outstanding (FOF) + HE debt repayments from other EE [(46)+(14)]<1>: PCE [(60)+(68)] | 17.8 | 28.1 | 27.4 | 23.7 | 17.9 | 23.6 | 18.8 | 25.6 | 15.5 | 22.4 | 20.7 | |
| (52) Level of home equity loans outstanding (FOF) + HE debt repayments from other EE [(46)+(14)]<1>: Real estate and business expenses [(61)+(69)] | 7.2 | 14.5 | 13.6 | 12.1 | 10.1 | 14.0 | 12.7 | 12.7 | 11.8 | 13.9 | 10.6 | |
| (53) Memo: PCE plus repayment of non-mortgage debt [(49)+(51)] | 28.8 | 55.1 | 51.9 | 46.0 | 36.1 | 49.6 | 43.7 | 46.9 | 39.3 | 47.8 | 38.0 | |
| (54) Level of closed-end home equity loans (FOF) | 182.4 | 195.0 | 205.0 | 214.7 | 223.6 | 241.7 | 262.7 | 261.1 | 284.9 | 302.5 | 302.5 | |
| (55) Level of closed-end home equity loans (FOF): Change | -8.0 | 12.5 | 10.0 | 9.7 | 8.9 | 18.1 | 21.0 | -1.6 | 23.8 | 17.6 | 0.0 | |
| (56) Level of closed-end home equity loans (FOF) + HE repayment from other EE [{(54)/(45)}{t-1}*(14)+(55)]<1> | 0.5 | 25.8 | 20.4 | 20.6 | 19.4 | 30.5 | 35.7 | 15.0 | 38.3 | 31.2 | 12.0 | |
| (57) Level of closed-end home equity loans (FOF) + HE repayment from other EE [{(54)/(45)}{t-1}*(14)+(55)]<1>: Transactions costs [(78)*(56)] | 0.0 | 0.1 | 0.1 | 0.1 | 0.1 | 0.1 | 0.1 | 0.1 | 0.2 | 0.1 | 0.0 | |
| (58) Level of closed-end home equity loans (FOF) + HE repayment from other EE [{(54)/(45)}{t-1}*(14)+(55)]<1> : Repayment of non-mortgage debt [(70)*{(56)-(57)}] | 0.2 | 11.2 | 8.8 | 8.9 | 8.3 | 13.0 | 15.3 | 6.4 | 16.4 | 13.3 | 5.1 | |
| (59) Level of closed-end home equity loans (FOF) + HE repayment from other EE [{(54)/(45)}{t-1}*(14)+(55)]<1> : Home improvements [(71)*{(56)-(57)}] | 0.2 | 8.2 | 6.5 | 6.6 | 6.1 | 9.6 | 11.3 | 4.7 | 12.1 | 9.8 | 3.8 | |
| (60) Level of closed-end home equity loans (FOF) + HE repayment from other EE [{(54)/(45)}{t-1}*(14)+(55)]<1> : PCE [(72)*{(56)-(57)}] | 0.0 | 2.2 | 1.7 | 1.7 | 1.6 | 2.6 | 3.0 | 1.3 | 3.2 | 2.6 | 1.0 | |
| (61) Level of closed-end home equity loans (FOF) + HE repayment from other EE [{(54)/(45)}{t-1}*(14)+(55)]<1> : Real estate and business expenses [(73)*{(56)-(57)}] | 0.1 | 4.1 | 3.2 | 3.3 | 3.3 | 5.2 | 6.0 | 2.5 | 6.5 | 5.3 | 2.0 | |
| (62) Level of home equity lines of credit (FOF) | 436.4 | 479.4 | 528.3 | 563.7 | 583.3 | 612.3 | 621.0 | 652.5 | 652.0 | 678.7 | 709.4 | |
| (63) Level of home equity lines of credit (FOF) Change | 33.4 | 43.1 | 48.8 | 35.4 | 19.6 | 29.1 | 8.6 | 31.6 | -0.6 | 26.7 | 30.7 | |
| (64) Level of home equity lines of credit (FOF) + HE repayment from EE [{(62)/(45)}{t-1}*(10)+(63)]<1> | 51.3 | 74.9 | 74.3 | 63.4 | 47.2 | 61.3 | 46.0 | 70.8 | 35.8 | 57.9 | 57.7 | |
| (65) Level of home equity lines of credit (FOF) + HE repayment from EE [{(62)/(45)}{t-1}*(10)+(63)]<1>: Transactions costs [(79)*(64)] | 0.3 | 0.4 | 0.4 | 0.4 | 0.3 | 0.3 | 0.3 | 0.4 | 0.2 | 0.3 | 0.3 | |
| (66) Level of home equity lines of credit (FOF) + HE repayment from EE [{(62)/(45)}{t-1}*(10)+(63)]<1>: Repayment of non-mortgage debt [(74)*{(64)-(65)}] | 10.9 | 15.8 | 15.7 | 13.4 | 9.9 | 12.9 | 9.7 | 14.9 | 7.5 | 12.1 | 12.1 | |
| (67) Level of home equity lines of credit (FOF) + HE repayment from EE [{(62)/(45)}{t-1}*(10)+(63)]<1>: Home improvements [(75)*{(64)-(65)}] | 15.3 | 22.3 | 22.1 | 18.9 | 14.0 | 18.2 | 13.6 | 21.0 | 10.6 | 17.1 | 17.0 | |
| (68) Level of home equity lines of credit (FOF) + HE repayment from EE [{(62)/(45)}{t-1}*(10)+(63)]<1>: PCE [(76)*{(64)-(65)}] | 17.7 | 25.9 | 25.7 | 21.9 | 16.2 | 21.1 | 15.8 | 24.3 | 12.2 | 19.8 | 19.7 | |
| (69) Level of home equity lines of credit (FOF) + HE repayment from EE [{(62)/(45)}{t-1}*(10)+(63)]<1>: Real estate and business expenses [(77)*{(64)-(65)}] | 7.1 | 10.4 | 10.3 | 8.8 | 6.8 | 8.8 | 6.6 | 10.2 | 5.3 | 8.6 | 8.6 |
| 2004 Q1 | Q2 | Q3 | Q4 | 2005 Q1 | Q2 | Q3 | Q4 | 2006 Q1 | Q2 | Q3 | Q4 | |
|---|---|---|---|---|---|---|---|---|---|---|---|---|
| (70) Shares of Closed-end loans used for: Repayment of non-mortgage debt | 0.4342 | 0.4342 | 0.4342 | 0.4342 | 0.4291 | 0.4291 | 0.4291 | 0.4291 | 0.4291 | 0.4291 | 0.4291 | |
| (71) Shares of Closed-end loans used for: Home improvements | 0.3203 | 0.3203 | 0.3203 | 0.3203 | 0.3165 | 0.3165 | 0.3165 | 0.3165 | 0.3165 | 0.3165 | 0.3165 | |
| (72) Shares of Closed-end loans used for: PCE | 0.0854 | 0.0854 | 0.0854 | 0.0854 | 0.0844 | 0.0844 | 0.0844 | 0.0844 | 0.0844 | 0.0844 | 0.0844 | |
| (73) Shares of Closed-end loans used for: Real estate and business expenses | 0.1600 | 0.1600 | 0.1600 | 0.1600 | 0.1700 | 0.1700 | 0.1700 | 0.1700 | 0.1700 | 0.1700 | 0.1700 | |
| (74) Shares of lines of credit used for:Repayment of non-mortgage debt | 0.2129 | 0.2129 | 0.2129 | 0.2129 | 0.2117 | 0.2117 | 0.2117 | 0.2117 | 0.2105 | 0.2105 | 0.2105 | |
| (75) Shares of lines of credit used for:Home improvements | 0.2998 | 0.2998 | 0.2998 | 0.2998 | 0.2981 | 0.2981 | 0.2981 | 0.2981 | 0.2964 | 0.2964 | 0.2964 | |
| (76) Shares of lines of credit used for:PCE | 0.3475 | 0.3475 | 0.3475 | 0.3475 | 0.3455 | 0.3455 | 0.3455 | 0.3455 | 0.3434 | 0.3434 | 0.3434 | |
| (77) Shares of lines of credit used for:Real estate and business expenses | 0.1400 | 0.1400 | 0.1400 | 0.1400 | 0.1450 | 0.1450 | 0.1450 | 0.1450 | 0.1500 | 0.1500 | 0.1500 | |
| (78) Memo: costs of obtaining HE loans as a share of loan amount - Closed-end | 0.0042 | 0.0041 | 0.0041 | 0.0041 | 0.0041 | 0.0041 | 0.0041 | 0.0041 | 0.0041 | 0.0041 | 0.0041 | |
| (79) Memo: costs of obtaining HE loans as a share of loan amount - HELOCS | 0.0059 | 0.0058 | 0.0057 | 0.0057 | 0.0057 | 0.0057 | 0.0057 | 0.0057 | 0.0057 | 0.0057 | 0.0057 | |
| Note: The source data for these shares are described in the appendix.: |
| 2004 Q1 | Q2 | Q3 | Q4 | 2005 Q1 | Q2 | Q3 | Q4 | 2006 Q1 | Q2 | Q3 | Q4 | |
|---|---|---|---|---|---|---|---|---|---|---|---|---|
| (80) Refinance originations | 397.4 | 497.4 | 301.1 | 399.1 | 386.6 | 358.7 | 429.5 | 412.0 | 367.8 | 345.1 | 322.6 | |
| (81) Repayments resulting from refinancings (first liens) | 341.2 | 414.8 | 245.0 | 326.6 | 311.3 | 284.8 | 334.4 | 306.5 | 270.3 | 265.7 | 259.3 | |
| (82) Repayments resulting from refinancings (first liens): Gross cash out [(80)-(81)]: | 56.2 | 82.6 | 56.1 | 72.5 | 75.3 | 73.9 | 95.1 | 105.5 | 97.6 | 79.5 | 63.3 | |
| (83) Repayments resulting from refinancings (first liens): Gross cash out [(80)-(81)]:Closing costs [(94)*(80)] | 6.6 | 8.0 | 5.1 | 6.6 | 6.2 | 5.9 | 6.9 | 6.7 | 5.9 | 5.6 | 5.4 | |
| (84) Repayments resulting from refinancings (first liens): Gross cash out [(80)-(81)]:Home equity loan repayments [(96)*(80)] | 18.0 | 31.0 | 20.7 | 25.3 | 26.7 | 26.2 | 33.0 | 40.3 | 38.0 | 25.4 | 20.4 | |
| (85) Repayments resulting from refinancings (first liens): Gross cash out [(80)-(81)]:Free cash generated by refinancings [(82)-(83)-(84)] | 31.6 | 43.6 | 30.3 | 40.6 | 42.4 | 41.8 | 55.1 | 58.5 | 53.6 | 48.4 | 37.5 | |
| (86) Used for: Repayment of non-mortgage debt [(0.27)*(85)] | 8.5 | 11.8 | 8.2 | 11.0 | 11.4 | 11.3 | 14.9 | 15.8 | 14.5 | 13.1 | 10.1 | |
| (87) Used for: Home improvements [(0.34)*(85)] | 10.8 | 14.8 | 10.3 | 13.8 | 14.4 | 14.2 | 18.8 | 19.9 | 18.2 | 16.5 | 12.7 | |
| (88) Used for: PCE [(0.17)*(85)] | 5.4 | 7.4 | 5.2 | 6.9 | 7.2 | 7.1 | 9.4 | 9.9 | 9.1 | 8.2 | 6.4 | |
| (89) Used for: Acquisition of assets and other [(90)+(91)] | 7.0 | 9.6 | 6.7 | 8.9 | 9.3 | 9.2 | 12.1 | 12.9 | 11.8 | 10.6 | 8.2 | |
| (90) Used for: Acquisition of assets and other [(90)+(91)]: Financial assets [(0.075)*(85)] | 2.4 | 3.3 | 2.3 | 3.0 | 3.2 | 3.1 | 4.1 | 4.4 | 4.0 | 3.6 | 2.8 | |
| (91) Used for: Acquisition of assets and other [(90)+(91)]: Real estate or business investments [(0.145)*(85)] | 4.6 | 6.3 | 4.4 | 5.9 | 6.1 | 6.1 | 8.0 | 8.5 | 7.8 | 7.0 | 5.4 | |
| (92) Used for: PCE plus repayment of non-mortgage debt [(88)+(86)] | 13.9 | 19.2 | 13.3 | 17.9 | 18.7 | 18.4 | 24.3 | 25.7 | 23.6 | 21.3 | 16.5 | |
| (93) Memo: Gross cash out share [(82)/(80)] | 0.1415 | 0.1660 | 0.1863 | 0.1818 | 0.1949 | 0.2061 | 0.2213 | 0.2561 | 0.2653 | 0.2302 | 0.1962 | |
| (93) Memo: GCO share, no-cash out loans (inferred from Freddie Mac data) | 0.0619 | 0.0783 | 0.0856 | 0.0800 | 0.0852 | 0.0895 | 0.0929 | 0.1141 | 0.1195 | 0.0900 | 0.0800 | |
| (94) Memo: Fees and points / refinance orig. [(0.0125)+(95)] | 0.0167 | 0.0161 | 0.0168 | 0.0166 | 0.0160 | 0.0165 | 0.0162 | 0.0164 | 0.0161 | 0.0163 | 0.0168 | |
| (95) Memo: Fees and points / refinance orig. [(0.0125)+(95)]: Points (FHFB) [(39)] | 0.0042 | 0.0036 | 0.0043 | 0.0041 | 0.0035 | 0.0040 | 0.0037 | 0.0039 | 0.0036 | 0.0038 | 0.0043 | |
| (96) Memo: Home equity loans paid of at refi. / refi orig. [(93)-(94)] | 0.0452 | 0.0622 | 0.0687 | 0.0634 | 0.0692 | 0.0730 | 0.0768 | 0.0977 | 0.1034 | 0.0737 | 0.0632 | |
| (97) Memo: Free cash as a share of refinance originations [(85)/(80)] | 0.0796 | 0.0877 | 0.1007 | 0.1018 | 0.1097 | 0.1166 | 0.1284 | 0.1420 | 0.1458 | 0.1402 | 0.1162 | |
| (98) Memo: Ratio: Free cash / gross cash out [(85)/(82)] | 0.5627 | 0.5281 | 0.5407 | 0.5600 | 0.5628 | 0.5657 | 0.5802 | 0.5546 | 0.5497 | 0.6090 | 0.5923 |
Lines 93 and 93: source Freddie Mac and our estimates
| Share of Free Cash Used for: | 1998:Q1-1999:Q1 | 2001:Q1-2002:Q2 | Average |
|---|---|---|---|
| (a): Repayment of nonmortgage debt | 0.2800 | 0.2600 | 0.2700 |
| (b): Home improvements | 0.3300 | 0.3500 | 0.3400 |
| (c): PCE | 0.1800 | 0.1600 | 0.1700 |
| (d): Stock market, other investments, taxes | 0.0200 | 0.1300 | 0.0750 |
| (e): Real estate or business investment | 0.1900 | 0.1000 | 0.1450 |
| 2004 Q1 | Q2 | Q3 | Q4 | 2005 Q1 | Q2 | Q3 | Q4 | 2006 Q1 | Q2 | Q3 | Q4 | |
|---|---|---|---|---|---|---|---|---|---|---|---|---|
| (99) Gross equity extraction [(18)] | 188.9 | 230.6 | 268.9 | 211.0 | 156.5 | 243.5 | 284.8 | 228.7 | 191.4 | 193.6 | 151.0 | |
| (100) Gross equity extraction [(18)] Net equity extraction [(1)-(17)] | 161.2 | 187.5 | 230.8 | 174.6 | 123.6 | 196.3 | 235.9 | 188.0 | 156.0 | 151.7 | 111.9 | |
| (101) Gross equity extraction [(18)] Net equity extraction [(1)-(17)] As percent of disposable income | 7.60 | 8.72 | 10.60 | 7.82 | 5.56 | 8.75 | 10.43 | 8.14 | 6.65 | 6.42 | 4.66 | |
| (102) Free cash generated by equity extraction [(1)] | 203.1 | 358.9 | 309.2 | 298.9 | 278.6 | 394.1 | 400.0 | 356.2 | 320.6 | 332.8 | 279.6 | |
| (103) Free cash generated by equity extraction [(1)] As percent of disposable income | 9.58 | 16.68 | 14.20 | 13.39 | 12.54 | 17.57 | 17.69 | 15.42 | 13.66 | 14.09 | 11.65 | |
| (104) Disposable income (NSA) | 2,120.4 | 2,151.8 | 2,176.6 | 2,232.8 | 2,222.7 | 2,242.4 | 2,261.9 | 2,309.0 | 2,347.2 | 2,361.6 | 2,399.6 | |
| (105) Disposable income (NSA): NIPA personal saving | 44.7 | 42.1 | 35.3 | 52.2 | 13.1 | -7.7 | -33.2 | -7.1 | -7.4 | -32.7 | -27.9 | |
| (106) Disposable income (NSA): NIPA personal saving NIPA savings rate, percent | 2.11 | 1.96 | 1.62 | 2.34 | 0.59 | -0.34 | -1.47 | -0.31 | -0.32 | -1.38 | -1.16 | |
| (107) PCE financed by Equity Extraction: Direct effects [(9)] | 31.5 | 50.6 | 45.5 | 42.8 | 36.9 | 48.9 | 46.5 | 50.3 | 38.1 | 44.3 | 39.2 | |
| (108) PCE financed by Equity Extraction: Direct effects [(9)] As a percent of disposable income | 1.49 | 2.35 | 2.09 | 1.92 | 1.66 | 2.18 | 2.06 | 2.18 | 1.62 | 1.88 | 1.63 | |
| (109) PCE financed by Equity Extraction: Direct effects plus repayment of non-mortgage debt [(12)] | 51.1 | 89.3 | 78.2 | 76.0 | 66.6 | 86.1 | 86.4 | 87.4 | 76.4 | 82.8 | 66.5 | |
| (110) PCE financed by Equity Extraction: Direct effects plus repayment of non-mortgage debt [(12)] As a percent of disposable income | 2.41 | 4.15 | 3.59 | 3.41 | 3.00 | 3.84 | 3.82 | 3.79 | 3.26 | 3.51 | 2.77 | |
| (111) NIPA personal saving plus: Direct PCE effect [(105)+(107)] | 76.3 | 92.6 | 80.8 | 95.0 | 50.1 | 41.2 | 13.4 | 43.2 | 30.6 | 11.6 | 11.3 | |
| (112) NIPA personal saving plus: Direct PCE effect [(105)+(107)] Repayment of non-mortgage debt [(105)+(109)] | 95.9 | 131.4 | 113.5 | 128.3 | 79.7 | 78.4 | 53.2 | 80.3 | 69.0 | 50.1 | 38.6 | |
| (113) NIPA personal saving rate plus: Direct PCE effect [100*(111)/(104)] | 3.60 | 4.31 | 3.71 | 4.25 | 2.25 | 1.84 | 0.59 | 1.87 | 1.31 | 0.49 | 0.47 | |
| (114) NIPA personal saving rate plus: Direct PCE effect [100*(111)/(104)] Repayment of non-mortgage debt [100*(112)/(104)] | 4.52 | 6.11 | 5.22 | 5.75 | 3.59 | 3.50 | 2.35 | 3.48 | 2.94 | 2.12 | 1.61 |