
The Rise in Mortgage Defaults
Keywords: Subprime mortgages, mortgage default, mortgage delinquency
Abstract:
The main factors underlying the rise in mortgage defaults appear to be declines in house prices and deteriorated underwriting standards, in particular an increase in loan-to-value ratios and in the share of mortgages with little or no documentation of income. Contrary to popular perception, the growth in unconventional mortgages products, such as those with prepayment penalties, interest-only periods, and teaser interest rates, does not appear to be a significant factor in defaults through mid-2008 because borrowers who had problems with these products could refinance into different mortgages. However, as markets realized the extent of the poor underwriting, underwriting standards tightened and borrowers began to face difficulties refinancing; this dynamic suggests that these unconventional products could pose problems going forward.
The mortgage market began suffering serious problems in mid-2005. According to data from the Mortgage Bankers Association, the share of mortgage loans that were "seriously delinquent" (90 days or more past due or in the process of foreclosure) averaged 1.7 percent from 1979 to 2006, with a low of about 0.7 percent (in 1979) and a high of about 2.4 percent (in 2002). But by the second quarter of 2008, the share of seriously delinquent mortgages had surged to 4.5 percent. These delinquencies foreshadowed a sharp rise in foreclosures: roughly 1.2 million foreclosures were started in the first half of 2008, an increase of 79 percent from the 650,000 in the first half of 2007 (Federal Reserve estimates based on data from the Mortgage Bankers Association). No precise national data exist on what share of foreclosures that start are actually completed, but anecdotal evidence suggests that historically the proportion has been somewhat less than half (Cordell, Dynan, Lehnert, Liang, Mauskopf, 2008).
Mortgage defaults and delinquencies are particularly concentrated among borrowers whose mortgages are classified as "subprime" or "near-prime." Some key players in the mortgage market typically group these two into a single category, which we will call "nonprime" lending. Although the categories are not rigidly defined, subprime loans are generally targeted to borrowers who have tarnished credit histories and little savings available for down payments. Near-prime mortgages are made to borrowers with more minor credit quality issues or borrowers who are unable or unwilling to provide full documentation of assets or income; some of these borrowers are investing in real estate rather than occupying the properties they purchase. Near-prime mortgages are often bundled into securities marketed as "Alt-A." Since our data are based on the loans underlying such securities, we use the term "Alt-A" to refer to near-prime loans in the remainder of this paper.
Subprime mortgages are not a new product, nor are complaints about subprime loans. Since 1993, the Department of Housing and Urban Development (HUD) has been compiling a list of lenders who specialize in subprime mortgage lending. About 700,000 mortgages were originated annually between 1998 and 2000 by lenders whose primary business was originating subprime loans (Mayer and Pence, forthcoming). A U.S. Department of Housing and Urban Development report published in 2000 documented "the rapid growth of subprime lending during the 1990s" and called for increased scrutiny of subprime lending due to "growing evidence of widespread predatory practices in the subprime market."
Despite these concerns, lending to risky borrowers grew rapidly in the 2000s, as shown in Table 1. The number of subprime mortgages originated nearly doubled from 1.1 million in 2003 to 1.9 million in 2005. Near-prime Alt-A originations grew at an even faster rate, from 304,000 in 2003 to 1.1 million in 2005. In dollar terms, nonprime mortgages represented 32 percent of all mortgage originations in 2005, more than triple their 10 percent share only two years earlier (Inside Mortgage Finance, 2008). This momentum began to change in the middle of 2005, when mortgage rates started to rise and house price appreciation first began to slow. Nonprime lending leveled off in 2006, dropped dramatically in the first half of 2007, and became virtually nonexistent through most of 2008.
The fall in nonprime originations coincided with a sharp rise in delinquency rates. The share of subprime mortgages that were seriously delinquent increased from about 5.6 percent in mid-2005 to over 21 percent in July 2008. Alt-A mortgages saw an even greater proportional increase from a low of 0.6 to over 9 percent over the same time period. This dramatic rise in delinquency rates has spurred widespread concerns about the effects on borrowers, lenders, investors, local communities, and the overall economy.
This paper begins by looking at the various attributes of subprime and near-prime mortgages: what types of loans were used; how they compare on standard measures of risk such as loan-to-value ratios and credit scores; and whether the loans were originated to purchase homes or to refinance existing mortgages. We then examine what shares of these loans were relatively novel and complicated products: for example, some had interest rates that adjusted in potentially confusing ways; did not require full documentation of income and assets; allowed borrowers to postpone paying off mortgage principal; or imposed fees if borrowers prepaid their mortgages within a certain period of time. The patterns of mortgage delinquency varied across these characteristics, sometimes in unexpected ways.
We next investigate why delinquencies and defaults increased so substantially. We first consider the proliferation of the novel products mentioned above. We find little evidence that the rise in delinquencies through mid-2008 was linked to these products, although they may cause problems in the future. We then consider incentives in the mortgage market, which during the 2000s shifted to an "originate-to-distribute" model, under which mortgage brokers originated loans and then sold them to institutions that securitized them. As brokers did not bear the ultimate costs of default, they may have had a lower incentive to screen applicants carefully (Keys, Mukherjee, Seru, and Vig, 2008). We find that underwriting deteriorated along several dimensions: more loans were originated to borrowers with very small down payments and little or no documentation of their income or assets, in particular. The final culprit we consider is changes in underlying macroeconomic conditions such as interest rates, unemployment, and house prices. We find substantial evidence that declines in house prices are a key factor in the current problems facing the mortgage market.
Attributes of Subprime and Alt-A Mortgages
Measuring the extent and characteristics of risky lending is not easy, due both to the lack of a clear definition of "risky" loans and to limitations in the data collected. For many years, researchers defined risky loans as those loans reported under the Home Mortgage Disclosure Act (HMDA) that were originated by lenders on the HUD list of subprime lenders, using the assumptions that all loans from these lenders were risky and no loans from other lenders were risky. Avery, Brevoort, and Canner (2007) provide an overview of the HMDA data, which contain only basic information on the loan and the borrower, including the income and race of the borrower and the geographic location of the property collateralizing the mortgage.
As subprime lending grew, so too did the extent to which these loans were pooled into securities and sold to investors. This process, known as securitization, transforms illiquid individual mortgages into financial products that can be bought and sold as widely as stocks and bonds. With securitization came improved data on these mortgages, so investors could monitor the performance of their securities. One such data vendor is LoanPerformance, a subsidiary of First American CoreLogic, Inc., which compiles detailed loan-level data on mortgages securitized in subprime or Alt-A pools. These data appear to cover 90 percent or more of securitized subprime mortgage originations (Mayer and Pence, forthcoming).
We use data licensed from LoanPerformance as the basis for our analysis. We define a subprime loan as a loan in a subprime pool and likewise an Alt-A loan as a loan in an Alt-A pool. Thus, these data will not include risky mortgages that lenders keep rather than securitize; about 75 percent of subprime originations were securitized in recent years (Mayer and Pence, forthcoming). We focus on 30-year mortgages originated on properties in the continental United States between January 1, 2003, and June 30, 2007. We keep only mortgages for which the lender has the first claim on the property if the borrower defaults ("first-lien" mortgages) and drop mortgages without valid state identifiers. Our additional sample restrictions are that the loan must have an initial balance greater than $10,000 and that it must be backed by a one- to four-family nonmanufactured home. For the 2003 to 2007 period, these restrictions cumulatively reduce our sample from 14.6 million loans to 9.7 million loans.
Because nonprime securitization ground to a halt in the second half of 2007, the LoanPerformance data provide little information on loans originated after mid-2007. But the timeframe is suitable for examining conditions around the time of peak nonprime lending activity. The data also allow us to examine separately subprime and Alt-A originations. Although both types of mortgage originations increased rapidly between 2003 and 2005, they differ substantially in their terms and features and in the characteristics of the borrowers who took them.
Structure of Nonprime Mortgages
The overwhelming majority--over 75 percent--of subprime mortgages that originated over the 2003-2007 period were so-called "short-term hybrids," shown in Panel A of Table 2. In this type of mortgage, the interest rate is fixed for two or three years and then becomes an adjustable rate tied to market interest rates. The initial fixed rate is often called a "teaser" rate, because the interest rate was typically scheduled to rise two or more percentage points after the initial period ended. These mortgages were sometimes marketed as "credit repair" mortgages: borrowers could make on-time payments during the fixed-rate period, thereby improving their credit scores, and then refinance into prime mortgages before the mortgage switched to an adjustable rate. Colloquially, these mortgages were often referred to as "2/28s," with the "2" referring to the initial two years of fixed interest rates and the "28" referring to the following 28 years of adjustable interest rates. Most of the remaining 25 percent of mortgages in these pools were fixed-rate.
In contrast, short-term hybrids were a much smaller share--about 10 percent--of mortgage originations in Alt-A pools, while fixed-rate mortgages were a larger share--about 40 percent. The remainder of the mortgages were "floating rate," with interest rates that vary from the beginning of the loan with changes in market rates, and long-term hybrids, with interest rates fixed for five, seven, or ten years before becoming adjustable-rate.
Measures of Risk for Nonprime Lending
Subprime pools are clearly more risky than Alt-A pools when measured by what the industry considers the two primary risk characteristics: the combined loan-to-value ratio and the FICO credit score.1 "Combined" loan-to-value ratios include both first and second mortgages; second mortgages are often referred to as "piggybacks." The data will miss some "silent seconds," in which the borrower takes a second lien without notifying the original lender. Anecdotal evidence suggests that such loans may have become more prevalent over this period.
As shown in Panel B of Table 2, the median combined loan-to-value ratio for subprime purchase loans rose from 90 percent in 2003 to 100 percent in 2005, implying that in the final years of the mortgage boom more than half of borrowers with subprime mortgages put no money down when purchasing their homes. The combined loan-to-value ratios of subprime refinances remained around 80 percent over this period, although these estimates may have become artificially low over time if house price appraisals were biased upwards. Combined loan-to-value ratios for Alt-A loans, although lower than those on subprime loans, also trended upward over this period.
As shown in Panel C, purchase loans (as opposed to refinance loans) rose from 30 to 42 percent as a share of subprime originations over the 2003-2006 period, but were roughly constant as a share of Alt-A originations. Piggyback loans became a more prominent component of the combined loan-to-value ratio; the share of subprime originations with a piggyback rose from 7 to 28 percent from 2003 to 2006, whereas the Alt-A share with a piggyback rose from 12 to 42 percent.
Subprime mortgage originations had much lower credit scores than Alt-A mortgage originations (Panel C, Table 2). The median FICO score in subprime pools was around 615, while the median FICO score in Alt-A pools was around 705. This risk characteristic, unlike combined loan-to-values, remained flat over time.
On other observable risk dimensions, Alt-A mortgage pools appear riskier than subprime pools. For example, investors are considered more likely to default on mortgages than owner-occupants, and about 25 percent of Alt-A mortgages were originated on investment properties, compared with about 10 percent of subprime mortgages.2 In addition, around 70 percent of loans in Alt-A pools did not include full documentation of income, assets, or both (so-called low- or no-documentation loans), compared with 35 percent of loans in subprime pools.
Mortgages in both types of pools often had features rarely seen in mortgages originated to borrowers with better credit quality. In 2006 and 2007, monthly payments for about 25 percent of subprime mortgages were calculated under the assumption that the borrowers would repay the loans over a 40- or 50-year period. However, the mortgages had an actual life of 30 years, with the remaining balance due as a lump sum at the end of the 30 years. We refer to these mortgages as having "amortization greater than 30 years"; these products were unknown in subprime pools before 2006. As houses became more expensive, subprime borrowers may have turned to these products in an attempt to obtain more affordable monthly payments.
For Alt-A loans, instead of changing the assumed period of time over which borrowers repay the balance, lenders often dropped the requirement that borrowers pay off any principal at all in the early years of the mortgage. Forty percent of Alt-A mortgages involved only interest payments without any scheduled principal repayment (only about 10 percent of subprime mortgages have such an interest-only feature). Even more strikingly, another 20 percent of Alt-A mortgages allowed the mortgage balance to increase over time (so-called "negative amortization"); these mortgages are not found in subprime pools.
About 70 percent of subprime mortgages required borrowers to pay a fee if they refinanced their mortgages before a certain period of time elapsed (a prepayment penalty), compared with 40 percent of Alt-A mortgages. Prepayment penalties are controversial because they might make it expensive to refinance, and many borrowers appear not to realize that their mortgages include this provision. However, mortgage rates tend to be lower on loans with prepayment penalties, resulting in more affordable monthly payments for borrowers (Mayer, Piskorski, and Tchistyi, 2008).
In Table 2, Panel D, we see that interest rates at the time of origination on mortgages in subprime pools were higher than those in Alt-A pools; these higher rates are not surprising given the worse credit quality of subprime mortgages. Subprime fixed-rate mortgages, for example, had an average mortgage rate at origination of 7.7 percent, a full percentage point higher than the average 6.7 percent rate on Alt-A fixed-rate mortgages. Adjustable-rate mortgages showed a similar pattern. Initial mortgage rates on Alt-A floating-rate mortgages hovered around an extraordinarily low 2 percent--this rate represents a four percentage point discount relative to the initial rate that the borrower would have had to pay for a mortgage without a teaser--whereas initial rates on subprime short-term hybrids were around 8 percent, or about two to three percentage points below the rate that the borrower would have had to pay for a mortgage without a teaser. The rate spread between subprime and Alt-A increased over 2006 and 2007 as subprime credit quality diminished (see also Demyanyk and Van Hemert, 2008).
Delinquency Rates by Types of Nonprime Loans
Within subprime and Alt-A mortgages, delinquencies have been particularly pronounced for loans that include an adjustable interest rate component--floating-rate mortgages, short-term hybrids, and long-term hybrids. For example, looking at subprime mortgages, the serious delinquency rates for both adjustable-rate and fixed-rate loans were about 5.6 percent in mid-2005. But by July 2008, serious delinquencies on adjustable-rate mortgages had risen to over 29 percent, while the similar rate for fixed-rate mortgages rose to 9 percent. Similarly, serious delinquency rates for both adjustable-rate and fixed-rate Alt-A mortgages were about 0.6 percent in mid-2005. But by July 2008, the delinquency rate on adjustable-rate Alt-A mortgages had risen past 13 percent, while the delinquency rate on fixed-rate mortgages had risen over 5 percent.
Table 3 reports loan attributes for the four major mortgage products in subprime and Alt-A pools. The exceptionally high default rates of subprime adjustable-rate mortgages may be due in part to the relatively poor risk attributes of these loans. Short-term hybrids, which make up almost all subprime adjustable-rate mortgages, had an average FICO credit score of only 612 and a mean combined loan-to-value ratio of 89 percent. By contrast, subprime fixed-rate mortgages have higher credit scores (FICO of 627) and lower combined loan-to-value ratios (80 percent). The higher default rates of Alt-A adjustable-rate mortgages, however, cannot be linked as cleanly to worse risk attributes. Only the short-term hybrids in Alt-A pools have uniformly worse risk attributes than fixed-rate mortgages, and short-term hybrids represent only 12 percent of all Alt-A mortgages.
Mortgages originated to purchase properties have higher delinquency rates than mortgages originated for refinancing, and the difference between the delinquency rates on these products has soared over the last two years. Serious delinquency rates for both types of subprime mortgages were around 5 percent in mid-2005, but by July 2008 rose to over 28 percent for purchase mortgages and over 18 percent for refinancings. Serious delinquency rates for Alt-A mortgages were below 1 percent in mid-2005, but rose to 11 percent for purchase mortgages and over 8 percent for refinancings. These differences in delinquency rates cannot be cleanly attributed to differences in risk attributes between the two groups, as shown in Table 4. FICO credit scores are 19-35 points lower for refinancings, but combined loan-to-value ratios are also lower. A higher percentage of purchase loans than refinance loans are on investor property, but purchase loans are also much less likely to allow negative amortization.
The fact that default rates are higher on subprime purchase loans is somewhat surprising, because refinance loans are generally considered to entail more risk. Borrowers who refinance into subprime rather than prime loans, almost by definition, have not seen their financial circumstances improve since they originated their mortgages. Borrowers may refinance into subprime mortgages because financial circumstances force them to extract cash from their properties. In fact, almost 90 percent of subprime refinancings involved some amount of cash back (although this cash back could be the loan closing costs). Borrowers may also refinance into subprime mortgages because they could not afford the payments on their initial mortgages. In addition, fraud and underwriting problems may be harder to detect for refinancings, because house values are based on appraisals rather than sales values.
Perhaps the explanation is that borrowers who refinanced were those who had already shown some ability to repay their mortgages, whereas new homebuyers were untested. Borrowers who refinance may also have lived in their houses longer, possibly becoming more attached to their neighborhoods and benefiting from recent house price appreciation. Alternatively, some borrowers who purchase a house with a subprime mortgage may be speculating on house price appreciation and thus more likely to default when house prices are no longer rising.
Mortgage Products and Features
One possible explanation for the rise in mortgage defaults is that borrowers did not understand fully the complex products that became common in the nonprime mortgage market. For example, borrowers with short-term hybrids might not have understood that their payments could increase at the end of the initial fixed-rate period. Borrowers who were unprepared for this increase might be unable to make their payments and thus might default on their mortgages. However, as we show below, the complexity of these products does not appear to be the primary culprit for the skyrocketing delinquency and foreclosure rates. And as of mid-2008, these products were no longer offered in the mortgage market, in part because of the high lender losses and in part because of regulatory changes that discouraged or prohibited some of these provisions (Office of the Comptroller of the Currency, 2007, Board of Governors of the Federal Reserve System, 2008).
We begin by examining three mortgage types that might be responsible for at least part of the delinquency rise: mortgages with initial "teaser" rates that change to possibly higher adjustable rates after two or three years; prepayment penalty clauses that establish large fees for borrowers who pay off their mortgages early; and mortgages that allow for little or no prepayment of principal, or even allow borrowers to make payments so low that their mortgage principal grows over time. None of these provisions were new in the 2000s, but they were common in the adjustable-rate mortgages that experienced the highest default rates, and their use appears to have increased rapidly with the boom in nonprime mortgage lending.
Mortgage Rate Resets and Teasers
As the number of subprime loans nearly doubled from 2003 to 2005, the share of these loans that were short-term hybrids grew as well to roughly 80 percent of all subprime loans originated in 2005--or more than 1.5 million mortgages with teaser rates that would expire in 2007 and 2008. (Short-term hybrids are a much smaller share of Alt-A mortgages.) As noted in the previous section, these mortgages have performed quite poorly, with serious delinquency rates approaching 30 percent by mid-2008. These facts suggest that consumer problems with teaser rates might be a significant contributor to the problems in the mortgage market.
Teaser-rate mortgages are controversial because of two fears: these loans may be targeted to financially unsophisticated consumers who may not understand how teaser rates work and thus may overestimate their ability to pay the higher rates; and originators may not have adequately disclosed to consumers that they could face potentially large increases in rates at the end of the teaser period. Borrowers with adjustable-rate mortgages appear to underestimate the extent to which their interest rates could increase (Bucks and Pence, 2008). In addition, borrowers tend to focus disproportionately on the initial rather than the long-term costs of loans (Miles, 2003). Borrowers may discount the long-term costs of loans because they are optimistic about their future prospects and put more weight on current than future happiness (Brunnermeier and Parker, 2005; Laibson, 1997; Grubb, 2008). Lenders may also have little incentive to point out these errors because lenders who educate naïve borrowers could forfeit profits (Gabaix and Laibson, 2006; Campbell, 2006).
Industry participants claim that teaser mortgages were never designed as long-term mortgage products. Instead, they argue that the two- or three-year teaser period was designed for consumers with tarnished credit to improve their credit scores by making regular payments--and then to refinance into more stable mortgages. A mortgage with a low initial interest rate can be optimal for liquidity-constrained borrowers if borrowers understand the terms (Piskorski and Tchistyi, 2007).
Moreover, the teaser rate for subprime mortgages was not especially low: throughout the 2003-2007 period, the initial teaser rate for short-term hybrids hovered in the range of 7.5 to 8.5 percentage points. But the rate to which the later adjustment would occur varied substantially. When short-term interest rates were low in 2003 and early 2004, the fully indexed rate was lower than the initial rate. In 2005, the fully indexed rate rose to nearly 3.5 percentage points above the average teaser rate, so mortgages originated in that year faced a large potential rate shock at expiration. The difference between the average teaser rate and the fully indexed rate fell a bit in 2006 and early 2007 to closer to 3 percentage points.
However, the distinguishing feature of the short-term hybrid mortgage--the change in the mortgage rate two or three years after origination--does not seem to be strongly associated with increased defaults, as least prior to early 2008. Sherlund (2008) and Gerardi, Shapiro, and Willen (2007) show that, until recently, borrowers with hybrid mortgages appeared more likely to refinance and prepay their mortgages around the first reset date but were not necessarily more likely to default around that time. Instead, most of the defaults on short-term hybrids occurred well before the end of the teaser period. Mortgage rate resets may yet cause difficulties going forward: households trying to refinance hybrid short-term mortgages in 2008 and later face an environment of stagnant to falling house prices and tightened underwriting standards. These changes make refinancing more difficult and thus increase the chances of default (Sherlund, 2008). On the other hand, if short-term interest rates remain low, the payment shocks associated with rate resets could be small.
Prepayment Penalties
Prepayment penalties are another mortgage feature commonly assumed to affect default rates; for example, prepayment penalties were prevalent among the short-term hybrids that experienced the highest default rates. In the Alt-A category, many floating-rate mortgages also had prepayment penalties, although default rates were not nearly as high. Prepayment penalties can be fairly large, typically running to six months of interest, or several thousand dollars (Board of Governors, 2008, p. 44552). Many borrowers with prepayment penalties may not understand that their contracts contain these penalties (Lacko and Pappalardo, 2007). Prepayment penalties may also make it more difficult for borrowers who face unexpected financial difficulties to obtain funds by selling their homes or refinancing their mortgages, and may leave borrowers unable to lower their payments if interest rates fall or their credit profiles improve.
In the case of short-term hybrids, a particular concern is that prepayment penalties may still be in effect when the interest rates switch from fixed- to variable-rate. At the end of the teaser period, borrowers may be unable to afford their new payments, but may also be unable to lower their monthly payments through refinancing because of prepayment penalties. However, Table 2 (last row) suggests that this situation is uncommon: prepayment penalties were scheduled to be in effect after the end of the teaser period for only 7 percent of the subprime short-term hybrids originated from 2003 to 2007, and over these years the share originated with such a provision dropped from 10 to 2 percent. For Alt-A pools, more than one-quarter had prepayment penalties that extended beyond the teaser period, with the proportion over 30 percent in the boom years of 2005 and 2006. But most of these mortgages were floating-rate mortgages, whose interest rates adjust from the beginning of the mortgage as frequently as monthly. Almost by definition, any prepayment penalty on a floating-rate mortgage will extend beyond the teaser period.
Moreover, prepayment penalties can be welfare-improving. Because prepayment penalties discourage borrowers from refinancing, cash flows from mortgages with these penalties are more stable. These mortgages are more valuable to investors, and some of these savings may be passed on to borrowers. In effect, risky borrowers get an interest rate discount to forgo the option to refinance their mortgages if they get a good credit shock (known in the insurance literature as "reclassification risk"). Mayer, Piskorski, and Tchistyi (2008) find that reclassification risk is real for lenders: that is, risky borrowers who receive positive credit shocks are more likely to prepay their mortgages than safer borrowers. They also find that subprime borrowers with FICO scores below 620 receive the largest interest rate benefits from accepting a prepayment penalty. (Other studies, such as Ernst, 2005, find a weaker or no relationship between interest rates and prepayment penalties.) In addition, Mayer, Piskorski, and Tchistyi. find that mortgages with prepayment penalties are less likely to default than comparable mortgages without prepayment penalties, perhaps because the lower monthly payments make the mortgages more affordable. Sherlund (2008) also finds no evidence that the probability of default is higher when a prepayment penalty is in effect, although the probability of prepayment is lower.
In short, prepayment penalties clearly decrease the probability that borrowers prepay mortgages. Some borrowers may not know that their mortgages include these provisions, and borrowers who need to refinance to access cash in an emergency will find this access more costly if prepayment penalties are in effect. However, the bulk of the evidence suggests that these penalties did not contribute to the rise in defaults through mid-2008.
Negative Amortization, Interest-Only, and 40-Year Amortization Features
Over the 2003-2007 period, originators of nonprime mortgages increasingly designed and promoted products with lower monthly mortgage payments. By 2006 and 2007, more than one-third of subprime 30-year mortgages had amortization schedules longer than 30 years, more than 44 percent of Alt-A loans allowed borrowers to pay only the interest due on their mortgages, and more than one-quarter of Alt-A loans gave borrowers the option to pay less than the interest due and thus grow their mortgage balances (so-called "option adjustable-rate mortgages"). Because borrowers pay down principal more slowly, if at all, with these mortgages, loan-to-value ratios remain elevated and borrowers have a higher incentive to default.
As with prepayment penalties, theory suggests that credit-constrained borrowers can benefit from these mortgage provisions. Piskorski and Tchistyi (2007) present a model suggesting that these products increase affordability by alleviating liquidity constraints. However, the groups most likely to face liquidity constraints may also be those most likely to have difficulty understanding these provisions (Bucks and Pence, 2008).
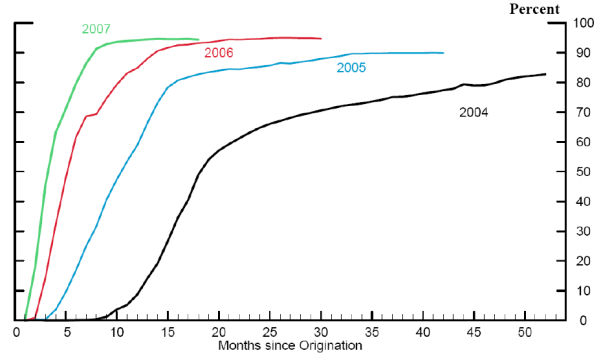
The vast majority of borrowers with option adjustable-rate mortgages appear to have exercised the option to make small "minimum" payments on their mortgages. By making payments less than the accrued interest due, these borrowers increased, rather than decreased, their mortgage balances over time. Figure 1 shows the share of borrowers with option adjustable-rate mortgages in the 2004, 2005, 2006, and 2007 vintages whose mortgage balances in a given number of months were larger than at origination. Most borrowers in the 2004 vintage paid off at least the interest in the first months of their mortgages, but by month 18, over 50 percent of these borrowers had balances that exceeded their size at origination.
The share making small payments increased even more dramatically and at earlier loan ages for more recent vintages. For mortgages originated in 2007, 60 percent had larger balances at month 4 than at origination, and over 90 percent had larger balances at month 8 than at origination. On average, these mortgage balances were around $400,000 at origination; borrowers who increased their balances increased them by around $1,250 a month. Although in theory, borrowers could be using these products to smooth consumption by making lower payments during periods when their incomes are below average or their expenses are above average, the fact that the vast majority of borrowers are making only a minimum payment suggests that other factors are at play.
These products generally only allow borrowers to make minimum or interest-only payments for a period of time, usually five to ten years. At the end of this period, the payment "recasts" into a payment large enough to pay off the mortgage balance in full by the end of the mortgage. This recast can result in a substantial payment increase for at least three reasons: the borrower now has to repay principal; that principal may have increased since the mortgage was originated if the borrower only made minimum payments; and the borrower has to pay off the principal over a shorter period of time than the original 30 years.
Serious delinquency rates on option adjustable-rate mortgages have risen even more steeply than on Alt-A mortgages overall, increasing from 1 percent in January 2007 to 15 percent in July 2008. Recasts, however, cannot explain this rise as most of these mortgages are not scheduled to recast until 2010 or later. However, recasts may become a problem in the future if house prices do not recover and refinancing remains difficult. The fact that so many option adjustable-rate mortgage borrowers exercised their option to make only minimum payments--and thus increase their mortgage balances--suggests that the size of these future recasts will be especially large.
Underwriting and Matching Loans to Borrowers
Deteriorating lending standards appear to be a larger culprit than product complexity in the rise in defaults. Over time, lenders extended loans to increasingly risky borrowers. We find that increases in observable factors such as loan-to-value ratios and in the share of loans with no or low documentation contributed significantly to the rise in defaults, but other changes such as the share of loans originated to investors or to borrowers with low credit scores appear to be less important in the rise in defaults. Underwriting also appears to have deteriorated on aspects of the loan that are less easy to measure, as evidenced by the increasing share of loans that defaulted very soon after origination. Demyanyk and Van Hemert (2008), Keys, Mukherjee, Seru, and Vig (2008), and Mian and Sufi (2008) also point to declining underwriting standards as a contributing factor in the subprime crisis.
Early Payment Defaults
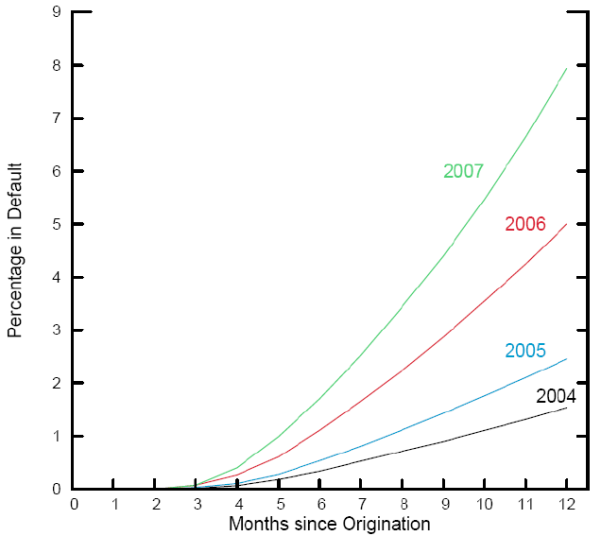
Historically, mortgages that are underwritten well are unlikely to default in the first year of origination. Thus, the reports at the end of 2006 from lenders such as Ownit, New Century, and Novastar that an unusually high share of their loans were becoming delinquent almost immediately were a cause for alarm. This surge in early payment defaults is evident in our data. On average, 1.5 percent of subprime loans in the 2000-2004 vintages were in default after 12 months, and the situation was just a bit worse for the 2005 vintage (Figure 2).3 However, 2 percent of outstanding loans in the 2007 vintage were in default within six months of origination, and 8 percent were in default after 12 months.
Two possibilities might explain the dramatic rise in early payment defaults. First, many borrowers may have been speculating on continued house price appreciation, and when that appreciation did not materialize, those borrowers stopped making payments. Second, loans may have been underwritten so poorly that borrowers were unable to afford the monthly payments almost from the moment of origination.
As we show below, some of the deterioration in underwriting characteristics should have been apparent to investors in mortgage-backed securities. However, the surge in early payment defaults suggests that underwriting also deteriorated on dimensions that were less readily apparent to investors. Research studies and anecdotal evidence suggest fraudulent practices by both borrowers and mortgage brokers (for example, Morgenson and Creswell, 2007). Base Point Analytics (2007) found some degree of borrower misrepresentations in as many as 70 percent of early payment defaults in a study of three million loans originated between 1997 and 2006. These practices may have been stoked by the rise of the "originate-to-distribute" model, which has been faulted for not providing incentives for originators to provide proper due diligence on loans.4
Combined Loan-to-Value Ratios and Second Liens
The rise in combined loan-to-value ratios suggests that lower down payments and an increased use of second liens could have been important contributors to the mortgage crisis. As noted earlier, the median combined loan-to-value ratio on subprime purchase originations rose from 90 percent in 2003 to 100 percent for 2005 to 2007 originations, and the share of subprime originations with a piggyback second lien at origination increased from 7 percent in 2003 to 28 percent in 2006. Similar increases in combined loan-to-value ratios for purchase originations and in the incidence of piggyback loans occurred for Alt-A originations. The increased share of mortgages with piggybacks is also apparent in the HMDA data (Avery, Brevoort, and Canner, 2007).
The default rate patterns line up with the patterns in combined loan-to-value ratios. Subprime purchase loans originated between 2005 and 2007 had both the highest default rates and the highest combined loan-to-value ratios at origination; default rates were lower on two groups with lower combined loan-to-value ratios: subprime purchase mortgages originated before 2005, and Alt-A mortgages. Default rates and combined loan-to-value ratios were also lower for refinances than purchases for both subprime and Alt-A originations, although combined loan-to-value ratios for refinancings may have been held down by the rapid house price appreciation over this period and by house value appraisals that were inflated to justify larger mortgages. One piece of evidence that appraisals were manipulated for some refinanced mortgages is that loans with combined loan-to-value of exactly 80 or 90 percent--which may signify inflated appraisals--have higher default rates than loans with combined loan-to-value slightly smaller or larger than these thresholds (Gerardi, Lehnert, Sherlund, and Willen, forthcoming). However, the facts that defaults are higher for purchase mortgages and that purchase originations rose as a share of subprime originations from 2003 to 2006 suggest that inflated refinancing appraisals may not have been a major driver of the rise in mortgage default.
Sherlund (2008) documents, as have other researchers, that negative equity and a higher combined loan-to-value ratio lead to more defaults, as these borrowers have a more difficult time refinancing and have less to lose through default. Even controlling for combined loan-to-value ratios, however, borrowers with piggyback second liens tend to default at higher rates: a borrower with a 95 percent combined loan-to-value ratio first lien appears to be a better risk than a borrower with an 85 percent first lien and a 10 percent second lien. It is not clear why the composition of the combined loan-to-value matters so much for default. The commercial mortgage market appears to realize that these piggyback liens pose additional risk, as commercial mortgage contracts often have covenants that require borrowers to obtain the lender's permission before taking out additional debt. However, these covenants are uncommon in the residential mortgage market.
Credit Scores
The fact that reported credit scores were stable from 2003 to 2007 suggests that deterioration in credit scores was not a factor in the rise in defaults. As noted earlier, the median FICO score in subprime pools was 615 in 2003 and 613 in 2007, while the median credit score in Alt-A pools moved from 710 in 2003 to 707 in 2007. These statistics may mask a deterioration in credit scores if borrowers artificially manipulated their scores through practices such as "renting out" checking accounts or using the payment history from a stranger's credit card. Some press reports indicate that these practices seemed to "grow exponentially" in 2007 (Creswell, 2007). By contrast, Keys, Mukherjee, Seru, and Vig (2008) argue that credit score manipulation is fairly difficult and unlikely to be widespread. Manipulation of credit scores is hard to observe directly. Our best evidence against credit score manipulation being a major factor in the rise in defaults is indirect: Sherlund (2008) reports that credit scores continue to be an important factor in predicting defaults for subprime loans, even for the most recent vintages where credit score manipulation was reputedly more widespread.
No- and Low-Documentation Loans
The share of subprime mortgages with no or low documentation of income or assets rose modestly from 32 percent of originations in 2003 to 38 percent in 2007. (We combine no- and low-documentation loans because only a small number of loans are identified as "no-doc" in the data.) The no- and low-doc share for Alt-A loans rose more steeply from 62 percent in 2004 to 81 percent in 2007. No- and low-doc loans were originally devised as a solution for borrowers, such as self-employed workers, who have income that is variable or difficult to document. However, over time these loans may have provided a mechanism for borrowers or lenders to mask the fact that the borrowers might not have the resources to repay the loans.
No- and low-doc loans default at much higher rates than fully documented loans, and prepay at lower rates (Sherlund, 2008). Over the 2005 to 2008 period, serious delinquencies on no- and low-doc subprime mortgages rose from 5 to over 25 percent, compared with a rise from 5 to about 20 percent for fully documented loans. The fact that the no- and low-doc loans comprised an increasing share of originations suggests that these loans contributed at least somewhat to the rise in delinquencies overall.
Investor-owned Property
The share of subprime mortgages originated on investor-owned properties was constant around 8 percent from 2003 to 2007, whereas the share of Alt-A originations made to investors dipped from 27 to 21 percent. Investors tend to default at a higher rate than owner-occupiers (Sherlund, 2008). In Massachusetts, multi-family dwellings--which are purchased at least partially for investment reasons--accounted for more than one-third of recent foreclosures, even though they represent only about 10 percent of owned homes.5 Over the 2005 to 2008 period, delinquency rates rose from around 5 to over 22 percent for subprime mortgages on investor-owned properties, compared with a rise from 5 to around 18 percent for owner-occupied properties. However, because our data show that investors were a small or declining share of overall originations, it seems unlikely that they account for much of the rise in the overall delinquency rate unless they increasingly misrepresented themselves as owner-occupiers or their unobserved characteristics deteriorated over time.
Interactions/Risk-Layering
Finally, the share of mortgages that were risky in more than one underwriting dimension increased over this period. For instance, the share of subprime short-term hybrids originated with low credit scores and high loan-to-value ratios increased from 7 percent in 2003 to 15 percent in 2006; the share with no- or low-documentation and high loan-to-value ratios increased by a similar amount. These trends suggest that mortgage originators became increasingly confident in their ability to underwrite risky mortgages as the mortgage boom progressed. However, these types of interactions had never before been tested during economic downturns or periods of stagnant to falling house prices.
Macroeconomic Factors
Increases in house prices, low interest rates, and low unemployment contributed to the increased use (and extension) of subprime credit. Nationally, house price appreciation first began to decelerate in 2005, and interest rates began increasing around the same time. By 2007, house prices had declined in many areas of the country, and this deterioration, along with the increases in unemployment in parts of the Midwest, appear to be large contributors to the mortgage crisis.
Interest Rates
Interest rates were historically low in 2003 and 2004, but began increasing after the Federal Reserve started tightening monetary policy in mid-2004. The interest rates on most subprime adjustable-rate mortgages were fixed for the initial two or three years of the loan and then moved with changes in the six-month London Interbank Offered Rate (LIBOR). From June 2004 to June 2006, the six-month LIBOR rose from just under 2 percent to around 5.5 percent, with an associated increase in the fully indexed rate from 8 to 11.5 percent. The one-year Treasury bill rate, the equivalent index for many Alt-A adjustable-rate mortgages, rose by a similar amount. These interest rate changes imply that a typical borrower with a subprime adjustable-rate mortgage whose teaser period ended in mid-2006 could see a 25 percent increase in monthly payments--around $250 on a $150,000 mortgage--at the time of the mortgage rate reset.
However, borrowers could avoid this 25 percent increase by refinancing into another short-term hybrid; under the subprime teaser rates in effect in mid-2006, their payments would increase by only 10 to 15 percent. Because of house price increases over this period, most borrowers had accumulated enough home equity to refinance fairly easily. But when house prices stopped rising, mortgage defaults accelerated, and lenders tightened underwriting standards, higher-risk borrowers found it much more difficult to refinance and some borrowers may have been forced to default. The greater difficulty in refinancing, though, was offset somewhat by the decline in short-term interest rates that followed Federal Reserve rate cuts in 2007 and 2008. A typical subprime short-term hybrid experiencing a rate reset in June 2008 would have an associated monthly payment increase of about 3 percent, or about $40 on a $150,000 mortgage.
Unemployment
Ohio, Michigan, and Indiana were the first states to see large increases in delinquency rates. The serious delinquency rate on subprime mortgages in these states was 14 percent at the beginning of 2007, well above the 8.5 percent delinquency rate for the nation as a whole. The heightened delinquencies in these states were preceded by difficult economic conditions, including three to four years of elevated unemployment rates and at least one to two years of stagnant to falling house prices.
In areas with widespread increases in unemployment, house prices generally decline; demand for housing falls as income drops and workers migrate to other areas in search of jobs. As a result, it can be difficult to establish whether defaults in these areas are due to unemployment or house prices. In contrast, as we discuss below, borrowers who lose their jobs in an area where house prices are rising are more likely to sell their houses than default on their mortgages.
House Prices
House prices rose at an average annual rate of 11 percent from 2000 through 2005, stagnated, and then fell at an average annual rate of 10 percent from mid-2006 to mid-2008, as measured by the S&P/Case-Shiller national house price index. The increase in house prices likely fueled the growth of the nonprime mortgage market. As house prices skyrocketed, borrowers in search of affordable monthly payments may have turned to products with interest-only provisions, extended amortization, or other features more common in the nonprime market. Borrowers may have been comfortable taking these risks because they believed house prices would continue to rise. This belief in continued house price appreciation may have influenced other borrowers to buy investment properties; Alt-A mortgages, in particular, were often used by investors. Mayer and Pence (forthcoming) document that areas with high house price appreciation saw a rise the following year in subprime mortgage originations. Further, Nadauld and Sherlund (2008) show that mortgages from areas experiencing high house price appreciation are easier to securitize.
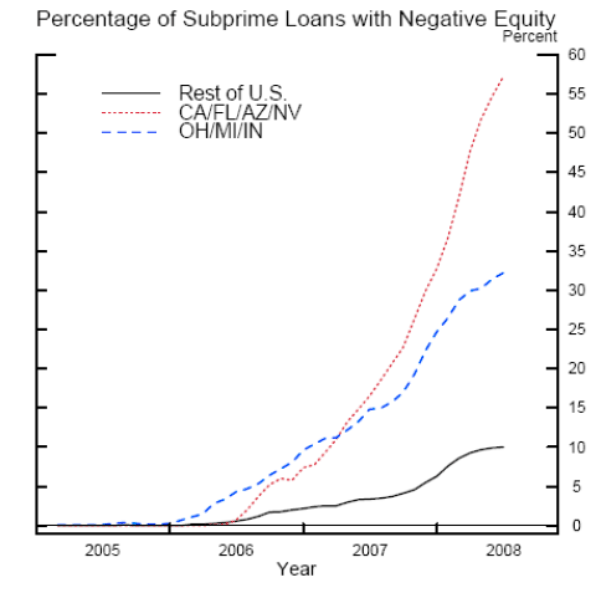
Likewise, the decline in house prices had a disproportionate effect on the nonprime mortgage market. Many nonprime borrowers put down small or no down payments when they purchased their homes, and as a result were likely to have negative equity in their homes when house prices fell. Because house prices in Ohio, Michigan, and Indiana began declining several months before the rest of the country, the share of borrowers with negative equity was initially highest in these states and reached one in three by mid-2008, as we see in Figure 3. In California, Florida, Arizona, and Nevada, where house prices appreciated dramatically in 2004 and 2005 and subsequently dropped sharply, over half of subprime borrowers had negative equity in their homes by mid-2008; elsewhere, about ten percent of subprime borrowers had negative equity by that time.
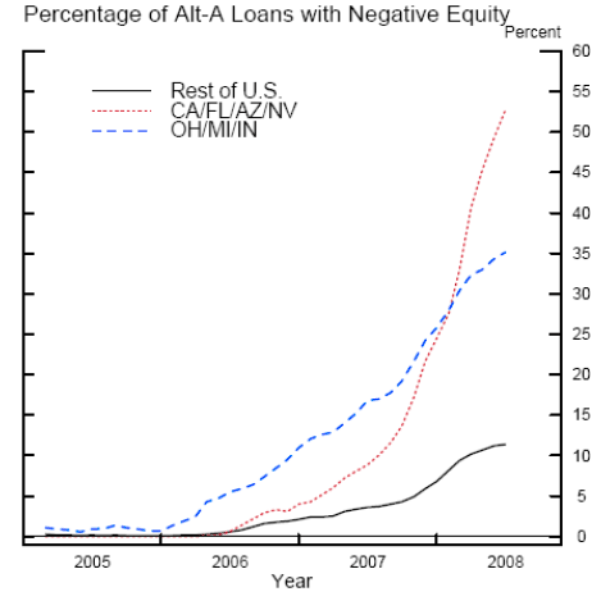
Although borrowers with Alt-A mortgages tended to have a bit larger down payments and thus more initial equity than borrowers with subprime mortgages, the negative equity picture for Alt-A mortgages is surprisingly similar to the subprime picture. As of mid-2008, over half of borrowers in California, Florida, Arizona, and Nevada, over a third of borrowers in Ohio, Michigan, and Indiana, and over ten percent of borrowers in the rest of the United States had negative equity. The only difference between the subprime and Alt-A pictures is the contour of the line for California, Florida, Arizona, and Nevada, which began accelerating later for Alt-A mortgages than for subprime mortgages but reached similar levels by the beginning of 2008. The large share of mortgages with negative equity in California, Florida, Arizona, and Nevada is particularly sobering because, as of July 2008, mortgages in these states accounted for 40 percent of outstanding subprime mortgages nationwide (dollar-weighted) and over 55 percent of Alt-A mortgages.
When borrowers with positive equity in their homes experience financial difficulties, they are likely to respond by refinancing or selling their homes. Even if a borrower cannot afford the current mortgage, it is more profitable for a borrower to sell the house than to have the bank sell it through a foreclosure. Borrowers with negative equity, however, face no such incentive, and are more likely to default on their loans (Foote, Gerardi, and Willen, 2008; Gerardi, Lehnert, Sherlund, and Willen, forthcoming; Sherlund, 2008).
As noted earlier, California, Florida, Arizona, and Nevada experienced much higher house price appreciation over the first few years of the 2000s than the rest of the nation. Correspondingly, only about 3 percent of subprime mortgages originated in these states from 2000 to 2004 defaulted within 3 years of origination, compared with over 8 percent of subprime mortgages originated in the nation overall.
As house prices began to decelerate in 2005, this pattern began to reverse. Over 17 percent of the subprime mortgages that originated in California, Florida, Arizona, and Nevada in 2005 defaulted by mid-2008, compared with nearly 14 percent nationwide. In 2006, house prices began to drop more sharply than in these states. Around 26 percent of 2006 subprime mortgage originations and 18 percent of 2007 subprime mortgage originations in California, Florida, Arizona, and Nevada were in default as of mid-2008. For the nation as a whole, only 13 and 9 percent of subprime mortgages originated in these years were in default.
We assume throughout this paper that the causality largely runs from house prices to nonprime lending. However, there were undoubtedly feedback effects from nonprime lending to house prices as well. As underwriting standards loosened, more new borrowers entered the market, thereby increasing the demand for housing (Mayer and Sinai, 2007, Mian and Sufi,
2008). The recent tightening of credit standards has likely kept borrowers out of the mortgage market and decreased housing demand and, by extension, house prices. Going forward, the glut of foreclosed properties may push house prices down even further.
Conclusions and Future Research
Slackened underwriting standards--manifested most dramatically by lenders allowing borrowers to forego down payments entirely--combined with stagnant to falling house prices in many parts of the country appear to be the most immediate contributors to the rise in mortgage defaults. The surge in early payment defaults and the rise in the share of mortgages with low or no documentation suggest that underwriting also deteriorated along other dimensions. Because down payments were so small, when house prices declined, many borrowers had little or no equity in their properties and thus less incentive to repay their mortgages. In the industrial Midwest, economic distress was also a factor in the heightened defaults. Unorthodox mortgage features such as rate resets, prepayment penalties, or negative amortization provisions do not appear to be significant contributors to date to the defaults because borrowers who experienced problems with these provisions could refinance into other mortgages. However, as markets realized the extent of the poor underwriting and house prices began to fall, refinancing opportunities became more limited. Borrowers may not be able to resolve their problems with these products through refinancing going forward and thus may be forced to default. Our conclusions are consistent with other studies (Sherlund, 2008; Gerardi, Lehnert, Sherlund, and Willen, forthcoming; Gerardi, Shapiro, and Willen, 2007; Haughwout, Peach, and Tracy, 2008).
Our conclusions run counter to the popular perception that unorthodox mortgage features are responsible for the surge in defaults. At first glance, the fact that the most common subprime mortgage was a confusing and complicated product--a short-term hybrid with a prepayment penalty--and that delinquency rates were highest on these products suggest that the mortgage type itself must be to blame. We suggest instead that default rates were highest on these products because they were originated to the borrowers with the lowest credit scores and highest loan-to-value ratios. This interpretation raises the questions of why the riskiest borrowers were matched with the most complicated products and whether it was borrowers, lenders, or both who misjudged the likelihood that borrowers would default. Did borrowers seek out this product because it offered the lowest initial payment and they were focused on short-term affordability? Or did lenders offer this product to borrowers because they thought that this combination of features allowed them to manage the risks of lending to borrowers with high probabilities of default?
News accounts often suggested that borrowers were steered into subprime adjustable-rate mortgages when they could have qualified for fixed-rate or prime mortgages (Brooks and Simon, 2007). Given the poor credit profiles of these borrowers and the high price of housing relative to their incomes, however, it seems more likely that, in the absence of subprime adjustable-rate mortgages, these borrowers would not have gotten credit at all. If so, several more questions spring to mind: First, were these borrowers better off for having the opportunity of home ownership when the possibility of failure was so high? Second, were the associated gains in the homeownership rate illusory, or will some of these gains be sustained?6 Finally, to what extent were house prices pushed up by the entrance of these new buyers into the market?
Alt-A mortgages pose a similar set of questions and issues. As with subprime mortgages, the complicated provisions of these mortgages do not appear to be responsible for the sharp rise in delinquencies. Very few of these mortgages are scheduled to "recast" before 2010, when their payments could potentially increase dramatically. But even more than subprime mortgages, these mortgages were originated to borrowers who may have been speculating on future house price appreciation. As these borrowers were somewhat better credit risks than borrowers with subprime mortgages, they tended to have lower combined loan-to-value ratios at origination and better credit scores. However, the areas where investors speculated most heavily on house price appreciation were also the areas that experienced the most severe house price declines. Although the initial equity cushion kept Alt-A mortgages from defaulting as quickly as subprime mortgages, default rates on Alt-A loans, and on option adjustable-rate mortgages in particular, began to skyrocket in 2007, about twelve months after the surge in subprime delinquencies. Going forward, the key question is whether house prices will decline enough so that borrowers with prime mortgages are also left with little or no equity and thus a higher chance of default.
References
Avery, Robert, Kenneth Brevoort, and Glenn Canner. 2007. "The 2006 HMDA Data." Federal Reserve Bulletin, Vol. 93.
Base Point Analytics. 2007. "Early Payment Default--Links to Fraud and Impact on Mortgage Lenders and Investment Banks."
Board of Governors of the Federal Reserve System. 2007. Report to the Congress on Credit Scoring and Its Effects on the Availability and Affordability of Credit. Submitted to the Congress pursuant to section 215 of the Fair and Accurate Credit Transactions Act of 2003. August 2007. http://www.federalreserve.gov/boarddocs/RptCongress/creditscore/creditscore.pdf.
Board of Governors of the Federal Reserve System. 2008. "Truth in Lending; Final Rule." Federal Register, July 30, 73(147): 44522-614.
Brooks, Rick, and Ruth Simon. 2007. "Subprime Debacle Traps Even Very Credit-Worthy." The Wall Street Journal, December 3, p. A1. http://online.wsj.com/article/SB119662974358911035.html.
Brunnermeier, Marcus K., and Jonathan A. Parker. 2005. "Optimal Expectations." American Economic Review, 95(4): 1092-1118.
Bucks, Brian, and Karen M. Pence. 2008. "Do Borrowers Know Their Mortgage Terms?" Journal of Urban Economics, 64(2): 218-33.
Campbell, John Y. 2006. "Household Finance." Journal of Finance, 61(4): 1553-1604.
Cordell, Larry, Karen Dynan, Andreas Lehnert, Nellie Liang, and Eileen Mauskopf. 2008. "The Incentives of Mortgage Servicers: Myths and Realities." Federal Reserve Working Paper 2008-46.
Creswell, Julie. 2007. "Web Help for Getting Mortgage the Criminal Way." New York Times, June 16.
Demyanyk, Yuliya, and Otto Van Hemert. 2008. "Understanding the Subprime Mortgage Crisis." Available at SSRN: http://ssrn.com/abstract=1020396.
Ernst, Keith. 2005. "Borrowers Gain No Interest Rate Benefits from Prepayment Penalties on Subprime Mortgages." Center for Responsible Lending. http://www.responsiblelending.org/pdfs/rr005-PPP_Interest_Rate-0105.pdf.
Foote, Chris, Kristopher Gerardi, and Paul S. Willen. 2008. "Negative Equity and Foreclosure: Theory and Evidence." Journal of Urban Economics, 64(2): 234-45.
Gabaix, Xavier, and David Laibson. 2006. "Shrouded Attributes, Consumer Myopia, and Information Suppression in Competitive Markets." Quarterly Journal of Economics, 121(2): 505-540.
Gerardi, Kristopher, Andreas Lehnert, Shane M. Sherlund, and Paul Willen. Forthcoming. "Making Sense of the Subprime Crisis." Brookings Papers on Economic Activity.
Gerardi, Kristopher, Adam Hale Shapiro, and Paul S. Willen. 2007. "Subprime Outcomes: Risky Mortgages, Homeownership Experiences, and Foreclosures." Federal Reserve Bank of Boston Working Paper 07-15.
Grubb, Michael. 2008. "Selling to Overconfident Consumers." Available at SSRN: http://ssrn.com/abstract=721701.
Haughwout, Andrew, Richard Peach, and Joseph Tracy. 2008. "Juvenile Delinquent Mortgages: Bad Credit or Bad Economy?" Journal of Urban Economics, 64(2): 246-57.
Inside Mortgage Finance. 2008. The 2008 Mortgage Market Statistical Annual. Bethesda, MD: Inside Mortgage Finance Publications Incorporated.
Keys, Benjamin J., Tanmoy K. Mukherjee, Amit Seru, and Vikrant Vig. 2008. "Did Securitization Lead to Lax Screening? Evidence from Subprime Loans." Available at SSRN: http://papers.ssrn.com/sol3/papers.cfm?abstract_id=1093137.
Lacko, James M., and Janis K. Pappalardo. 2007. Improving Consumer Mortgage Disclosures: An Empirical Assessment of Current and Prototype Disclosure Forms. Federal Trade Commission Bureau of Economics Staff Report. http://www.ftc.gov/os/2007/06/P025505MortgageDisclosureReport.pdf.
Laibson, David. 1997. "Golden Eggs and Hyperbolic Discounting." Quarterly Journal of Economics, 112(2): 443-77.
Mayer, Christopher, and Karen Pence. Forthcoming. "Subprime Mortgages: What, Where, and to Whom?" In Edward Glaeser and John Quigley, eds. Housing and the Built Environment: Access, Finance, Policy. Cambridge, MA: Lincoln Land Institute of Land Policy.
Mayer, Christopher, Tomasz Piskorski, and Alexei Tchistyi. 2008. "The Inefficiency of Refinancing: Why Prepayment Penalties are Good for Risky Borrowers." Unpublished paper, Columbia Business School.
Mayer, Christopher, and Todd Sinai. 2007. "Housing and Behavioral Finance." Paper presented at the Federal Reserve Bank of Boston Conference "Implications of Behavioral Economics on Economic Policy" and forthcoming in a conference volume.
Mian, Atif, and Amir Sufi. 2008. "The Consequences of Mortgage Credit Expansion: Evidence from the 2007 Mortgage Default Crisis." NBER Working Paper 13936.
Miles, David. 2003. The U.K. Mortgage Market: Taking a Longer-Term View, Interim Report: Information, Incentives, and Pricing. HM Treasury.
Morgenson, Gretchen, and Julie Creswell. 2007. "Borrowing Trouble." New York Times. April 1, 2007.
Nadauld, Taylor D., and Shane M. Sherlund. 2008. "The Role of the Securitization Process in the Expansion of Subprime Credit." Unpublished paper, Federal Reserve Board and Ohio State University, September.
Office of the Comptroller of the Currency, Board of Governors of the Federal Reserve System, Federal Deposit Insurance Corporation, Office of Thrift Supervision, and National Credit Union Administration. 2007. "Statement on Subprime Mortgage Lending." June 29. http://www.federalreserve.gov/newsevents/press/bcreg/bcreg20070629a1.pdf.
Piskorski, Tomasz, and Alexei Tchistyi. 2007. "Optimal Mortgage Design." Unpublished paper. Available at: http://www4.gsb.columbia.edu/cbs-directory/detail/6335859/Piskorski.
Sherlund, Shane. 2008. "The Past, Present, and Future of Subprime Mortgages." Unpublished paper, Federal Reserve Board, September.
Standard and Poor's. 2007. "Standard and Poor's Reexamines Risks of Early Payment Defaults in U.S. RMBS." S&P Credit Research. January 23.
U.S. Department of Housing and Urban Development. 2000. "Unequal Burden: Income and Racial Disparities in Subprime Lending in America." http://www.huduser.org/Publications/pdf/unequal_full.pdf.
FIGURE 1: Share of Option Adjustable-Rate Mortgages with Balances Larger than At Origination
Percent
Source. Calculations from First American LoanPerformance data.
Note: Sample restricted to thirty-year first-lien mortgages originated on 1-to-4 family properties in the contiguous United States.
FIGURE 2: Early Payment Defaults on Subprime Loans
Source: Calculations from First American LoanPerformance data.
Note: Sample restricted to thirty-year first-lien mortgages originated on 1-to-4 family properties in the contiguous United States. Adjustments made for calendar effects.
FIGURE 3: Percent of Nonprime Loans With Negative Equity
PANEL A: Subprime Loans
PANEL B: Alt-A Loans
Source: Calculations from S&P/Case-Shiller, Office of Federal Housing Enterprise Oversight, and First American LoanPerformance data.
Note: Sample restricted to thirty-year first-lien mortgages originated on 1-to-4 family properties in the contiguous United States.
TABLE 1: Number of subprime and Alt-A mortgage originations by year
| Collateral Type | 2003 | 2004 | 2005 | 2006 | 2007 (Jan-June) |
ALL |
|---|---|---|---|---|---|---|
| Subprime | 1,081,629 | 1,669,594 | 1,921,637 | 1,445,425 | 233,725 | 6,352,010 |
| Alt-A | 303,969 | 712,056 | 1,093,797 | 921,212 | 279,114 | 3,310,148 |
Source: Federal Reserve Board calculations based on data from First American LoanPerformance.
Note: Sample restricted to thirty-year first-lien mortgages originated on 1-to-4 family properties in the contiguous United States.
TABLE 2: Attributes For Mortgages in Subprime and Alt-A Pools
PANEL A: Market Share of Loans by Year and Loan Type
| Collateral Type, Loan Type |
2003 | 2004 | 2005 | 2006 | 2007 (Jan-June) |
ALL |
|---|---|---|---|---|---|---|
| Subprime: Fixed Rate | 30% | 21% | 17% | 20% | 27% | 21% |
| Subprime: Floating Rate | 0% | 0% | 0% | 0% | 0% | 0% |
| Subprime: Short-Term Hybrid | 68% | 77% | 81% | 77% | 68% | 76% |
| Subprime: Long-Term Hybrid | 1% | 1% | 2% | 3% | 4% | 2% |
| Alt-A: Fixed Rate | 69% | 36% | 39% | 39% | 42% | 41% |
| Alt-A: Floating Rate | 5% | 20% | 26% | 23% | 12% | 21% |
| Alt-A: Short-Term Hybrid | 11% | 23% | 12% | 6% | 1% | 12% |
| Alt-A: Long-Term Hybrid | 16% | 21% | 23% | 32% | 45% | 26% |
TABLE 2: Attributes For Mortgages in Subprime and Alt-A Pools
PANEL B: Median Combined loan-to-values for Mortgages in Subprime and Alt-A pools
| Collateral Type: Loan Purpose |
2003 | 2004 | 2005 | 2006 | 2007 (Jan-June) |
ALL |
|---|---|---|---|---|---|---|
| Subprime: Purchase | 90 | 95 | 100 | 100 | 100 | 95 |
| Subprime: Refinance | 80 | 80 | 80 | 80 | 80 | 80 |
| Alt-A:Purchase | 90 | 90 | 90 | 95 | 95 | 90 |
| Alt-A:Refinance | 74 | 75 | 75 | 79 | 79 | 76 |
TABLE 2: Attributes For Mortgages in Subprime and Alt-A Pools
PANEL C: Attributes of Mortgages in Subprime and Alt-A pools
| Collateral Type | 2003 | 2004 | 2005 | 2006 | 2007 (Jan-June) |
ALL |
|---|---|---|---|---|---|---|
| Purchase loans: Subprime | 30% | 36% | 40% | 42% | 31% | 37% |
| Purchase loans: Alt-A | 46% | 54% | 52% | 49% | 37% | 50% |
| Piggyback Loan: Subprime | 7% | 15% | 24% | 28% | 15% | 19% |
| Piggyback Loan: Alt-A | 12% | 27% | 35% | 42% | 33% | 33% |
| Median FICO: Subprime | 615 | 615 | 618 | 616 | 613 | 616 |
| Median FICO: Alt-A | 710 | 706 | 708 | 701 | 707 | 706 |
| Investor Property: Subprime | 8% | 8% | 7% | 7% | 8% | 7% |
| Investor Property: Alt-A | 27% | 23% | 22% | 21% | 22% | 22% |
| Low or No Documentation: Subprime | 32% | 34% | 36% | 38% | 34% | 35% |
| Low or No Documentation: Alt-A | 63% | 62% | 69% | 80% | 81% | 71% |
| Amortization |
0% | 0% | 4% | 23% | 26% | 7% |
| Amortization |
0% | 0% | 0% | 1% | 1% | 0% |
| Interest Only: Subprime | 2% | 11% | 21% | 13% | 11% | 13% |
| Interest Only: Alt-A | 16% | 37% | 40% | 44% | 52% | 39% |
| Negative Amortization: Subprime | 0% | 0% | 0% | 0% | 0% | 0% |
| Negative Amortization: Alt-A | 2% | 16% | 24% | 26% | 30% | 21% |
| Prepayment Penalty: Subprime | 74% | 73% | 72% | 70% | 69% | 72% |
| Prepayment Penalty: Alt-A | 26% | 33% | 39% | 44% | 40% | 38% |
| Prepayment Penalty Expiring After Reset (adjustable-rate mortgages only): Subprime | 10% | 8% | 6% | 3% | 2% | 7% |
| Prepayment Penalty Expiring After Reset (adjustable-rate mortgages only): Alt-A | 12% | 18% | 30% | 32% | 16% | 26% |
Source: Federal Reserve Board calculations based on data from First American LoanPerformance.
Note: Sample restricted to thirty-year first-lien mortgages originated on 1-to-4 family properties in the contiguous United States.
TABLE 2: Attributes For Mortgages in Subprime and Alt-A Pools
PANEL D: Average Initial Mortgage Rate by Year and Loan Type
| Collateral Type, Loan Type |
2003 | 2004 | 2005 | 2006 | 2007 (Jan-June) |
ALL |
|---|---|---|---|---|---|---|
| Subprime: Fixed Rate | 7.51 | 7.24 | 7.45 | 8.40 | 8.75 | 7.67 |
| Subprime: Floating Rate | 6.79 | 6.50 | 6.60 | 8.36 | 8.09 | 7.22 |
| Subprime: Short-Term Hybrid | 7.76 | 7.33 | 7.57 | 8.53 | 8.56 | 7.79 |
| Subprime: Long-Term Hybrid | 6.43 | 6.32 | 6.80 | 7.74 | 7.99 | 7.08 |
| Alt-A: Fixed Rate | 6.51 | 6.46 | 6.44 | 7.18 | 6.96 | 6.69 |
| Alt-A: Floating Rate | 3.72 | 2.06 | 1.66 | 2.00 | 2.33 | 1.92 |
| Alt-A: Short-Term Hybrid | 6.00 | 5.77 | 6.50 | 7.31 | 6.79 | 6.26 |
| Alt-A: Long-Term Hybrid | 5.60 | 5.63 | 6.20 | 6.78 | 5.93 | 6.23 |
Source: Federal Reserve Board calculations based on data from First American LoanPerformance.
Note: Sample restricted to thirty-year first-lien mortgages originated on 1-to-4 family properties in the contiguous United States.
TABLE 3: Attributes of Various Mortgage Types, 2003 - 2007
| Collateral Type | Fixed Rate | Floating Rate | Long-Term Hybrid | Short-Term Hybrid |
|---|---|---|---|---|
| Median CLTV: Subprime | 80 | 90 | 85 | 89.47 |
| Median CLTV: Alt-A | 80 | 80 | 84.28 | 90 |
| Median FICO: Subprime | 627 | 625 | 660 | 612 |
| Median FICO: Alt-A | 708 | 703 | 710 | 694 |
| Median Initial Rate: Subprime | 7.67 | 7.22 | 7.79 | 7.08 |
| Median Initial Rate: Alt-A | 6.69 | 1.92 | 6.26 | 6.23 |
| Investor Property: Subprime | 9% | 12% | 11% | 7% |
| Investor Property: Alt-A | 26% | 17% | 20% | 21% |
| Prepayment Penalty: Subprime | 73% | 57% | 66% | 72% |
| Prepayment Penalty: Alt-A | 20% | 74% | 35% | 48% |
| Prepayment Penalty Expiring After Reset: Subprime | . | 52% | 0% | 6% |
| Prepayment Penalty Expiring After Reset: Alt-A | . | 72% | 0% | 3% |
| Negative Amortization: Subprime | 0% | 3% | 0% | 0% |
| Negative Amortization: Alt-A | 0% | 91% | 8% | 0% |
| Low or No Documentation: Subprime | 27% | 45% | 40% | 37% |
| Low or No Documentation: Alt-A | 66% | 80% | 73% | 68% |
| Amortization |
0% | 8% | 11% | 9% |
| Amortization |
0% | 0% | 1% | 1% |
Source: Federal Reserve Board calculations based on data from First American LoanPerformance.
Note: Sample restricted to thirty-year first-lien mortgages originated on 1-to-4 family properties
in the contiguous United States.
TABLE 4: Attributes of Purchase and Refinance Mortgages
| Collateral Type | Purchase | Refi |
|---|---|---|
| Median CLTV: Subprime | 95 | 80 |
| Median CLTV: Alt-A | 90 | 76 |
| Median FICO: Subprime | 637 | 602 |
| Median FICO: Alt-A | 715 | 696 |
| Median Initial Rate: Subprime | 7.75 | 7.75 |
| Median Initial Rate: Alt-A | 5.98 | 5.08 |
| % Investor Property: Subprime | 10% | 6% |
| % Investor Property: Alt-A | 25% | 19% |
| % Prepayment Penalty: Subprime | 74% | 71% |
| % Prepayment Penalty: Alt-A | 34% | 42% |
| % Negative Amortization: Subprime | 0% | 0% |
| % Negative Amortization: Alt-A | 13% | 29% |
| Low or No Documentation: Subprime | 41% | 32% |
| Low or No Documentation: Alt-A | 69% | 73% |
| % Amortization |
9% | 7% |
| % Amortization |
0% | 0% |
Source: Federal Reserve Board calculations based on data from First American LoanPerformance.
Note: Sample restricted to thirty-year first-lien mortgages originated on 1-to-4 family properties
in the contiguous United States.