
Skip to: Printable Version (PDF)
Estimation of Average Local-to-Unity Roots in Heterogenous Panels 1
NOTE: International Finance Discussion Papers are preliminary materials circulated to stimulate discussion and critical comment. References to International Finance Discussion Papers (other than an acknowledgment that the writer has had access to unpublished material) should be cleared with the author or authors. Recent IFDPs are available on the Web at http://www.federalreserve.gov/pubs/ifdp/. This paper can be downloaded without charge from the Social Science Research Network electronic library at http://www.ssrn.com/.
Abstract:
This paper considers the estimation of average autoregressive roots-near-unity in panels where the time-series have heterogenous local-to-unity parameters. The pooled estimator is shown to have a potentially severe bias and a robust median based procedure is proposed instead. This median estimator has a small asymptotic bias that can be eliminated almost completely by a bias correction procedure. The asymptotic normality of the estimator is proved. The methods proposed in the paper provide a useful way of summarizing the persistence in a panel data set, as well as a complement to more traditional panel unit root tests.
JEL classification: C22, C23.
Keywords: Local-to-unity, panel data, pooled regression, median estimation, bias correction
1 Introduction
Few concepts have had such an impact on recent econometric practice as unit roots. The modern asymptotic theory developed for integrated processes clearly shows that a failure to account for the order of integration of the data can lead to flawed inference. However, many economic time-series exhibit a nearly persistent behavior with the largest auto-regressive root close to one, which often makes it difficult to distinguish between stationary and non-stationary series in practice. This has led to the increasing popularity of so called nearly integrated processes as a modelling device; rather than maintaining a strict dichotomy between integrated and non-integrated time-series, the largest auto-regressive root is treated as being local-to-unity which allows for a smoother transition between the stationary and non-stationary worlds.
Originally, nearly intergrated processes were mainly used for theoretical excercises, such as evaluating the local power properties of unit-root tests (e.g. Phillips and Perron, 1988, and Elliot et al., 1996). Lately, however, they have also become increasingly popular in practical inference (e.g. Cavanagh et al., 1995, and Campbell and Yogo, 2003). Although the generalization from a standard unit-root environment to a near integrated environment provides more flexibility, it suffers from the drawback that the key characterstic parameter of such a model, the local-to-unity parameter, cannot be estimated in a time-series setting.3 However, as shown in a series of papers by Moon and Phillips (1999, 2000, and 2004), the local-to-unity parameter can be estimated using a panel of observations, when all of the time-series have identical local-to-unity parameters. In practice, the assumption that all of the time-series in the panel have an identical degree of persistence is obviously very restrictive. In this paper I, therefore analyze the estimation of local-to-unity roots in panels where the degree of persistence varies between the time-series.
The purpose of this paper is twofold. First, I consider the properties of the pooled estimator of local-to-unity parameters proposed by Moon and Phillips (2000) in the case where the individual time-series possess differing degrees of persistence. Second, I propose a new estimator for the average local-to-unity root in a panel, based on applying the median operator to extract the crucial cross-sectional information in the panel.
When there is no longer a common local-to-unity parameter in a panel, a desirable property of a panel based estimator would be that it consistently estimates the mean, or average, parameter value in the panel. As is shown, however, the pooled estimator of Moon and Phillips (2000) can be a severely biased estimator of the average parameter, even for relatively modest deviations from the case of identical local-to-unity roots.
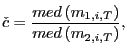
The basic idea of the pooled estimator is that a consistent estimator can be obtained by taking the inconsistent OLS time-series estimator of the local-to-unity parameter and summing up over the cross-section in both the numerator and the denominator. Since this method fails when the local-to-unity parameters are no longer identical, I propose a more robust approach by applying the sample median estimator, rather than the sample mean, in both the numerator and denominator of the time-series estimator.
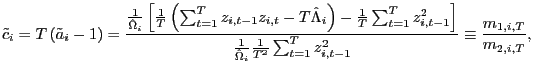
The bias and consistency properties of the resulting estimator cannot be analytically evaluated, but results based on numerical integration are straightforward to obtain. After a simple bias correction, the estimator is shown to be consistent in the case with identical local-to-unity parameters in the panel. More importantly, under the additional assumption that the local-to-unity parameters are normally distributed, it is shown that the estimator converges to a quantity that is very close to the average local-to-unity parameter, regardless of the variance in the distribution of the local-to-unity parameters. That is, in the case of identical near unit-roots in the panel, the estimator is consistent and it is very close to consistent in the case of non-identical roots. The bias in the non-identical case is small, and likely to be negligible compared to the variance of the estimates in any finite sample. The asymptotic normality of the estimator is also shown, as well as the estimation of standard errors and confidence intervals. Monte Carlo simulations support these results and also indicate that the estimator works well in cases where the local-to-unity parameters are not normally distributed.
The results developed in this paper are useful along several dimensions. First, they highlight the potential hazards of applying estimators of near-unit roots designed for the case of identical local-to-unity roots throughout the panel, when there is in fact a possibility that the roots are non-identical. Second, it is shown how to estimate the average near unit-root in a panel data set. This can be useful both as a characterization of the data in itself, as well as a starting point for further empirical analysis. It also provides a complement to panel unit-root tests, which have recently become very popular.4 The methods in this paper provide a simple diagnostic addition to these tests by estimating the average auto-regressive root in the panel. Since confidence intervals for this average root can also be obtained, further conclusions can also be arrived upon. For instance, a confidence interval that is strictly below zero reveals that the average root is significantly less than zero; hence, some of the actual roots in the panel must also be negative.
The rest of the paper is organized as follows. Section 2 details the setup and main assumptions and Section 3 derives the bias properties of the pooled estimator. The main results of the paper are developed in Section 4, where the asymptotic properties of the median based estimator are derived, and Section 5 concludes. All proofs and details of the numerical calculations are found in the Appendix.
A word on notation,
![]() denotes
weak convergence of the associated probability measures and
denotes
weak convergence of the associated probability measures and
![]() denotes
convergence in probability. I write
denotes
convergence in probability. I write
![]() when
when ![]() and
and ![]() go to infinity simultaneously and
go to infinity simultaneously and
![]() when
when ![]() goes to infinity
first while keeping
goes to infinity
first while keeping ![]() fixed,
and then letting
fixed,
and then letting ![]() go to
infinity.
go to
infinity.
2 Model and assumptions
Let the data generating process for each individual time series,
![]() , satisfy
, satisfy
| 1) | ||
where
The following assumptions on the error processes and the local
to unity parameters, ![]() ,
will be useful.
,
will be useful.
(a)
![]()
![]() for some
for some ![]()
![]()
(b) ![]() are
iid across
are
iid across ![]() and over
and over
![]() with
with
![]()
![]() , and finite fourth
order moments.
, and finite fourth
order moments.
Let
![]() ,
,
![]() ,
and
,
and
![]() , so
that
, so
that
![]() and
and
![]() specify
the long-run variance and the one-sided long-run covariance matrix,
respectively, of
specify
the long-run variance and the one-sided long-run covariance matrix,
respectively, of
![]() .
.
Under Assumption 1, it is well known that as
![]()
![]() where
where
![]() and
and
![]() is a standard Brownian motion (e.g. Phillips, 1987).
is a standard Brownian motion (e.g. Phillips, 1987).
3 The bias properties of the pooled estimator
I first show that the pooled estimator of ![]() does not work well when the
does not work well when the
![]() are non-identical
for all
are non-identical
for all ![]() . To keep the
discussion as transparent as possible, consider the simple case
where
. To keep the
discussion as transparent as possible, consider the simple case
where
![]() are
are
![]() across
across
![]() and
and ![]() ; the arguments presented could
easily be modified to account for the general error processes in
Assumption 1. Also, to keep the discussion short, only sequential
limit arguments are presented.
; the arguments presented could
easily be modified to account for the general error processes in
Assumption 1. Also, to keep the discussion short, only sequential
limit arguments are presented.
Noting that
![]() I consider estimators of the form
I consider estimators of the form
![]() . The pooled
estimator of
. The pooled
estimator of ![]() is given
by,
is given
by,
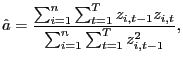
|
(2) |
and the corresponding pooled estimator of
![$\displaystyle =\left[ \frac{1}{n}\sum_{i=1}^{n}\frac {1}{T^{2}}\sum_{t=1}^{T}\left( \beta_{i,0}+y_{i,t-1}\right) ^{2}\right] ^{-1}$](img65.gif)
|
||
![$\displaystyle \times\left[ \frac{1}{n}\sum_{i=1}^{n}\frac{1}{T}\sum_{t=1}^{T}\l... ... \beta _{i,0}+\epsilon_{i,t}+\frac{\eta_{i}}{T}y_{i,t-1}\right) \right] \right]$](img66.gif)
|
||
![$\displaystyle \Rightarrow\left[ \frac{1}{n}\sum_{i=1}^{n}\int_{0}^{1}J_{i,c_{i}}\left( r\right) ^{2}dr\right] ^{-1}$](img67.gif)
|
||
![$\displaystyle \left[ \frac{1}{n}\sum_{i=1}^{n}\int_{0}^{1}J_{i,c_{i}}\left( r\r... ...n}\sum_{i=1}^{n}\eta_{i}\int_{0} ^{1}J_{i,c_{i}}\left( r\right) ^{2}dr\right] ,$](img68.gif)
|
(3) |
as
![$\displaystyle \frac{1}{n}\sum_{i=1}^{n}\int_{0}^{1}J_{i,c_{i}}\left( r\right) ^{2}dr\rightarrow_{p}E\left[ \int_{0}^{1}J_{i,c_{i}}\left( r\right) ^{2}dr\right] ,$](img75.gif)
|
(4) |
|
(5) |
and
![$\displaystyle \frac{1}{n}\sum_{i=1}^{n}\eta_{i}\int_{0}^{1}J_{i,c_{i}}\left( r\... ...arrow_{p}E\left[ \eta_{i}\int_{0}^{1}J_{i,c_{i}}\left( r\right) ^{2}dr\right] .$](img77.gif)
|
(6) |
Combining these results, as
![$\displaystyle T\left( \hat{a}-a\right) \rightarrow_{p}E\left[ \int_{0}^{1}J_{i,... ...t] ^{-1}E\left[ \eta_{i}\int_{0}^{1} J_{i,c_{i}}\left( r\right) ^{2}dr\right] .$](img78.gif)
|
(7) |
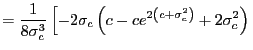
Under the assumption of normally distributed ![]() , the two expectations in (7)
can be calculated more explicitly. Using the properties of
conditional expectations and the moment generating function (mgf)
of the normal distribution,
, the two expectations in (7)
can be calculated more explicitly. Using the properties of
conditional expectations and the moment generating function (mgf)
of the normal distribution,
![]() ,
,
![$\displaystyle E\left[ \int_{0}^{1}J_{i,c_{i}}\left( r\right) ^{2}dr\right]$](img81.gif)
|
||
![$\displaystyle =\int_{0}^{1}\int_{0}^{r}E\left[ e^{2\left( r-s\right) c_{i}}\right] dsdr$](img82.gif)
|
||
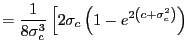
|
||
![$\displaystyle -\left. \sqrt{2\pi}e^{-\frac{c^{2}}{2\sigma_{c}^{2}}}\left( c+2\s... ...c{1}{i}\Phi\left( i\frac{c+2\sigma^{2}}{\sqrt{2}\sigma }\right) \right) \right]$](img84.gif)
|
||
| 8) |
where
![$\displaystyle E\left[ \eta_{i}\int_{0}^{1}J_{i,c_{i}}\left( r\right) ^{2}dr\right]$](img88.gif)
|
||
![$\displaystyle =\int_{0}^{1}\int_{0}^{r}\left( E\left[ c_{i}e^{2\left( r-s\right) c_{i}}\right] -cE\left[ e^{2\left( r-s\right) c_{i}}\right] \right) dsdr$](img89.gif)
|
||
|
||
![$\displaystyle +\left. \sqrt{2\pi}e^{-\frac{c^{2}}{2\sigma_{c}^{2}}}\left( c^{2}... ...c{1}{i}\Phi\left( i\frac{c+2\sigma ^{2}}{\sqrt{2}\sigma}\right) \right) \right]$](img91.gif)
|
||
| 9) |
Thus, in sequential limits, as
| (10) |
and the pooled estimator,
| (11) |
Panel A in Table 1 gives the numerical values of the function
![]() for various combinations
of
for various combinations
of ![]() and
and
![]() . It is
readily apparent that the asymptotic bias of the pooled estimator
for
. It is
readily apparent that the asymptotic bias of the pooled estimator
for ![]() is already large for
fairly small values of
is already large for
fairly small values of
![]() and grows
very large as
and grows
very large as
![]() increases.
Panel B in Table 1 shows the mean values of
increases.
Panel B in Table 1 shows the mean values of ![]() from a Monte Carlo simulation
with
from a Monte Carlo simulation
with ![]() and
and ![]() using
using ![]() repetitions. The distribution of
the
repetitions. The distribution of
the ![]() is normal and
the innovation processes,
is normal and
the innovation processes,
![]() , are
also
, are
also ![]() normal with
normal with
![]() . Figure 1 shows the density
estimates of
. Figure 1 shows the density
estimates of ![]() , from
the same simulation exercise, for the cases where
, from
the same simulation exercise, for the cases where ![]() and
and
![]() . The
graphs clearly illustrate that the pooled estimator performs
excellently for
. The
graphs clearly illustrate that the pooled estimator performs
excellently for
![]() , but that
its density starts drifting to the right as
, but that
its density starts drifting to the right as
![]() increases.
This is by any measure a large panel, and the
increases.
This is by any measure a large panel, and the ![]() are drawn from a normal
distribution, as was assumed when deriving the asymptotic limit
function
are drawn from a normal
distribution, as was assumed when deriving the asymptotic limit
function
![]() .
.
By comparing the values in Panel A and Panel B in Table 1, it is
obvious that the asymptotic limit of ![]() , given by
, given by
![]() , provides a very poor
approximation in finite samples as soon as the variance of the
local-to-unity parameter starts to increase; the size of the sample
in the Monte Carlo simulation was chosen to illustrate that this
remains true also in very large samples. Two conclusions are thus
immediate. First, the asymptotic limit of
, provides a very poor
approximation in finite samples as soon as the variance of the
local-to-unity parameter starts to increase; the size of the sample
in the Monte Carlo simulation was chosen to illustrate that this
remains true also in very large samples. Two conclusions are thus
immediate. First, the asymptotic limit of ![]() given by
given by
![]() cannot be used as a basis
for a bias correcting procedure of
cannot be used as a basis
for a bias correcting procedure of ![]() since it does not provide a good approximation
in finite samples. Of course, even if
since it does not provide a good approximation
in finite samples. Of course, even if
![]() did provide a good
approximation, any bias correction scheme based on it would be
complicated by the fact that
did provide a good
approximation, any bias correction scheme based on it would be
complicated by the fact that
![]() is unknown.
Second, the pooled estimator works very poorly as soon as there is
any variance, or heterogeneity, in the
is unknown.
Second, the pooled estimator works very poorly as soon as there is
any variance, or heterogeneity, in the ![]() . Thus, applying the pooled
estimator for
. Thus, applying the pooled
estimator for ![]() to a panel,
without any strong prior evidence or theory that the
to a panel,
without any strong prior evidence or theory that the ![]() are nearly identical, could
lead to seriously biased inference.
are nearly identical, could
lead to seriously biased inference.
How does one explain the poor finite sample performance of the
asymptotic bias function? Observe that the actual finite sample
bias is typically much smaller than the asymptotic bias, as
![]() grows large.
However, the gap between the asymptotic results and the finite
sample results is not merely a function of the standard deviation,
grows large.
However, the gap between the asymptotic results and the finite
sample results is not merely a function of the standard deviation,
![]() . For smaller
values of
. For smaller
values of ![]() , a larger
standard deviation is needed before the asymptotic value deviates
substantially from the finite sample result. In fact, for large
negative values of
, a larger
standard deviation is needed before the asymptotic value deviates
substantially from the finite sample result. In fact, for large
negative values of ![]() , there
is a very sharp increase in the asymptotic bias after
, there
is a very sharp increase in the asymptotic bias after
![]() exceeds some
value. For example, for
exceeds some
value. For example, for ![]() , the asymptotic limit for
, the asymptotic limit for
![]() is equal
to
is equal
to ![]() , and for
, and for
![]() the limit
is
the limit
is ![]() . Before this
breakpoint, the finite sample results are similar to the asymptotic
ones, but afterwards, they are vastly different. As
. Before this
breakpoint, the finite sample results are similar to the asymptotic
ones, but afterwards, they are vastly different. As ![]() becomes less negative, this effect
becomes less distinct, and the growth of both the asymptotic bias
and its deviation from the finite sample bias become smoother.
becomes less negative, this effect
becomes less distinct, and the growth of both the asymptotic bias
and its deviation from the finite sample bias become smoother.
Given these observations, a tentative explanation for the large
difference between the asymptotic and finite sample results is the
following. When ![]() , the corresponding process is
non-stationary and explosive. For positive
, the corresponding process is
non-stationary and explosive. For positive ![]() , the quantities
, the quantities
![]() and
and
![]() will
therefore grow very quickly in
will
therefore grow very quickly in ![]() . Thus, their mean values will be highly
influenced by the tail behavior, or maximum value, of
. Thus, their mean values will be highly
influenced by the tail behavior, or maximum value, of ![]() . This causes no problems when
calculating their analytical means, of course, but leads to
problems when one tries to simulate them, which is essentially what
is done in the Monte Carlo simulation. If the mean value depends on
the tail behavior, it might be the case that extremely large sample
sizes are needed before the simulated means approach the analytical
ones.5Since the
functions
. This causes no problems when
calculating their analytical means, of course, but leads to
problems when one tries to simulate them, which is essentially what
is done in the Monte Carlo simulation. If the mean value depends on
the tail behavior, it might be the case that extremely large sample
sizes are needed before the simulated means approach the analytical
ones.5Since the
functions
![]() and
and
![]() do not
grow fast in
do not
grow fast in ![]() for
for
![]() non-positive, the
above-mentioned problems only manifest themselves when there is a
large enough probability for
non-positive, the
above-mentioned problems only manifest themselves when there is a
large enough probability for ![]() to be positive that it will significantly affect
the mean. Otherwise, the tail behavior will have less of an impact
on the mean. This would explain why a larger variance is needed for
small
to be positive that it will significantly affect
the mean. Otherwise, the tail behavior will have less of an impact
on the mean. This would explain why a larger variance is needed for
small ![]() before the gap
between the finite sample value and the asymptotic value grows
large. This also provides some intuition for the extremely large
asymptotic biases from which the pooled estimator suffers.
before the gap
between the finite sample value and the asymptotic value grows
large. This also provides some intuition for the extremely large
asymptotic biases from which the pooled estimator suffers.
The above reasoning suggests that the asymptotic bias
approximation might perform better in cases where the support of
the distribution of the local-to-unity parameters is bounded from
above. To analyze this possibility, consider the case where the
![]() are uniformly
distributed on an interval
are uniformly
distributed on an interval
![]() . In this case,
. In this case,
![]() and the asymptotic bias function of the pooled estimator can be
written as
and the asymptotic bias function of the pooled estimator can be
written as
| (12) |
where
The numerical values for the function
![]() , obtained by using the
mgf of the uniform distribution, are given in Panel A of Table 2.
Panel B presents the corresponding mean pooled estimates of
, obtained by using the
mgf of the uniform distribution, are given in Panel A of Table 2.
Panel B presents the corresponding mean pooled estimates of
![]() from a Monte Carlo
simulation identical to the one described above, except that the
local-to-unity parameters are now uniformly distributed. If the
asymptotic limit function
from a Monte Carlo
simulation identical to the one described above, except that the
local-to-unity parameters are now uniformly distributed. If the
asymptotic limit function
![]() provides a good
approximation in finite samples, the corresponding values in Panel
A and Panel B should be close. They are indeed much closer than in
the normal case, and the asymptotic results do provide a good
approximation to the finite sample values, lending some credibility
to the explanation offered above. However, though the asymptotic
results correspond better to the finite sample values in the
uniform case, any inference method relying on these results would
face the problem that the limit function
provides a good
approximation in finite samples, the corresponding values in Panel
A and Panel B should be close. They are indeed much closer than in
the normal case, and the asymptotic results do provide a good
approximation to the finite sample values, lending some credibility
to the explanation offered above. However, though the asymptotic
results correspond better to the finite sample values in the
uniform case, any inference method relying on these results would
face the problem that the limit function
![]() is not monotone in
both
is not monotone in
both ![]() and
and ![]() for all values of
for all values of ![]() and
and ![]() ; the limit of
; the limit of ![]() for
for ![]() is constant for all values
of
is constant for all values
of ![]() that are
considered. Though this does appear to be a problem for large,
positive
that are
considered. Though this does appear to be a problem for large,
positive ![]() , it may
not be relevant in practical applications, where
, it may
not be relevant in practical applications, where ![]() is likely to be less than or
equal to zero.
is likely to be less than or
equal to zero.
4 A median based estimator
4.1 Bias properties
Given the poor performance of the pooled estimator in the previous section, an alternative estimator is proposed in this section. Rather than summing up over the cross-section, consider applying the sample median instead. The intuition behind this approach is simple. The median is generally a more robust estimator than the mean and can perform better in cases where the mean performs poorly.
Let Assumption 1 hold, and let
![]() and
and
![]() be
consistent estimators, as
be
consistent estimators, as
![]() , of
, of
![]() and
and
![]() ,
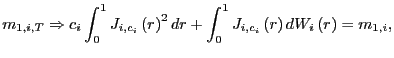
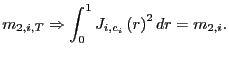
respectively (see Moon and Phillips, 2000, for details). Begin with
the inconsistent estimator of
,
respectively (see Moon and Phillips, 2000, for details). Begin with
the inconsistent estimator of ![]() ,
,
|
(13) |
where
|
(14) |
where
|
(15) |
and
|
(16) |
The division by
Define
![]() ,
,
![]() as
as
|
(17) |
and thus,
| (18) |
Let
 and and 
|
(19) |
| (20) |
So far, it has not been necessary to invoke Assumption 2; the
above results hold for general distributions of the ![]() . However, in order to calculate
. However, in order to calculate
![]() and
and
![]() ,
additional structure needs to be added to the problem. Analytical
expressions for the medians of
,
additional structure needs to be added to the problem. Analytical
expressions for the medians of ![]() and
and ![]() are most likely not attainable, except for
very special cases, but numerical results, given a distributional
assumption on the
are most likely not attainable, except for
very special cases, but numerical results, given a distributional
assumption on the ![]() ,
can be obtained. Therefore, I now make use of Assumption 2, and
calculate numerical values for
,
can be obtained. Therefore, I now make use of Assumption 2, and
calculate numerical values for
![]() and
and
![]() , for
different combinations of
, for
different combinations of ![]() and
and
![]() . The
numerical methods used are described in the Appendix.
. The
numerical methods used are described in the Appendix.
Panel A in Table 3 presents the numerical values of
![]() , under
Assumption 2, for various combinations of
, under
Assumption 2, for various combinations of ![]() and
and
![]() . If
. If
![]() were a
consistent estimator of
were a
consistent estimator of ![]() ,
regardless of
,
regardless of
![]() , all these
values should equal their corresponding value for
, all these
values should equal their corresponding value for ![]() . As is seen, this is not quite the
case, but
. As is seen, this is not quite the
case, but ![]() still turns out to have several desirable properties. First, for
all combinations of
still turns out to have several desirable properties. First, for
all combinations of ![]() and
and
![]() recorded in
Panel A of Table 3, which arguably covers most empirically
interesting cases, the bias is seen to be small and below
recorded in
Panel A of Table 3, which arguably covers most empirically
interesting cases, the bias is seen to be small and below
![]() in absolute value.
Indeed, for positive values of
in absolute value.
Indeed, for positive values of ![]() , the bias is almost zero. Second, and just as
importantly, for a fixed
, the bias is almost zero. Second, and just as
importantly, for a fixed ![]() ,
the bias varies only slightly with the variance parameter
,
the bias varies only slightly with the variance parameter
![]() . The maximum
difference observed, between
. The maximum
difference observed, between
![]() and
and
![]() , is no
larger than
, is no
larger than ![]() in
absolute value, and is likely to be insignificant next to the
variance of the estimates in any finite sample. This suggests that
the same bias correction scheme can be used for a specific
in
absolute value, and is likely to be insignificant next to the
variance of the estimates in any finite sample. This suggests that
the same bias correction scheme can be used for a specific
![]() , regardless of the
value of
, regardless of the
value of
![]() . This is
extremely convenient, since no estimate of
. This is
extremely convenient, since no estimate of
![]() is then
needed. Also, the bias correction is most naturally based on the
case of
is then
needed. Also, the bias correction is most naturally based on the
case of
![]() , unless
some specific prior information is available, for which the
calculation of the bias is greatly simplified as compared to the
case
, unless
some specific prior information is available, for which the
calculation of the bias is greatly simplified as compared to the
case
![]() .
Finally, for
.
Finally, for
![]() , the
ratio
, the
ratio
![]() is a
monotone function of
is a
monotone function of ![]() , making
bias correction feasible.
, making
bias correction feasible.
Given the experience with the pooled estimator, one would
naturally wish to evaluate the correspondence between the
asymptotic results presented in Panel A in Table 3 and the finite
sample properties of the estimator. Panel B in Table 3 shows the
results from a Monte Carlo study with a relatively large panel. The
setup is the same as that used in the pooled case. Each simulated
panel consists of ![]() time series, with
time series, with ![]() observations in each. The innovation processes are normal
observations in each. The innovation processes are normal
![]() and the
and the ![]() are
normally distributed.
are
normally distributed. ![]() repetitions were performed and the mean values
of the estimates are reported in Panel B of Table 3, for each
combination of
repetitions were performed and the mean values
of the estimates are reported in Panel B of Table 3, for each
combination of ![]() and
and
![]() . The
estimates have not been bias corrected in any way, and the serial
correlation correction term of the estimator is not included. Since
the error terms all have the same variance, the division by
. The
estimates have not been bias corrected in any way, and the serial
correlation correction term of the estimator is not included. Since
the error terms all have the same variance, the division by
![]() in
the numerator and denominator is not performed either.
in
the numerator and denominator is not performed either.
If the asymptotic results are valid finite sample
approximations, the values in Panel A and Panel B of Table 3 should
be close for corresponding values of ![]() and
and
![]() . This also
turns out to be the case, and the median estimator does appear to
be robust with regard to the variance of the local-to-unity
parameter.
. This also
turns out to be the case, and the median estimator does appear to
be robust with regard to the variance of the local-to-unity
parameter.
Since the asymptotic bias seems like a reasonable approximation
of the finite sample bias, a simple bias-correction scheme, based
on the asymptotic results, can be implemented. Denote
![]() for
for
![]() . Table 4
tabulates the values of
. Table 4
tabulates the values of
![]() for
for
![]() . As
is seen,
. As
is seen,
![]() is
strictly increasing in
is
strictly increasing in ![]() . A
bias corrected version of
. A
bias corrected version of ![]() , which we will denote
, which we will denote
![]() , is now
obtained by setting
, is now
obtained by setting
![]() . The
estimator
. The
estimator
![]() is now a
nearly consistent estimator of
is now a
nearly consistent estimator of ![]() , in the general case of
, in the general case of
![]() , and
exactly consistent for the special case of
, and
exactly consistent for the special case of
![]() . The bias
correction scheme is particularly simple for the cases of
. The bias
correction scheme is particularly simple for the cases of
![]() and for
and for
![]() .
According to the results of Table 4,
.
According to the results of Table 4,
![]() for
for
![]() and
and
![]() for
for
![]()
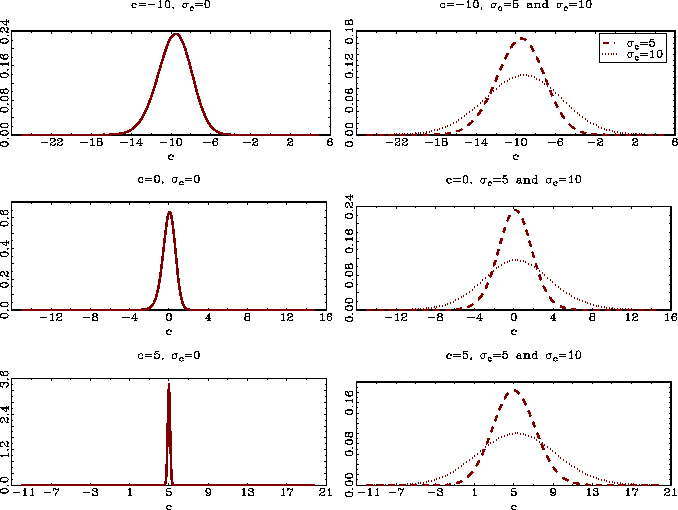
Performing an identical Monte Carlo simulation as the one
described above, the bias corrected estimates
![]() are
calculated and the estimated densities of these estimates are
plotted in Figure 2. The densities of the estimates are centered
very close to the true value of
are
calculated and the estimated densities of these estimates are
plotted in Figure 2. The densities of the estimates are centered
very close to the true value of ![]() even for large values of
even for large values of
![]() .
.
Panels encountered in empirical practice are seldom as large as
the ones used in the Monte Carlo simulation above. In Table 5 and
Figure 3, I show the results from a Monte Carlo simulation with
![]() and
and ![]() . The local-to-unity parameters
are once again drawn from normal distributions, and the innovation
processes are also
. The local-to-unity parameters
are once again drawn from normal distributions, and the innovation
processes are also ![]() normal, with unit variance. The mean values of the estimates
presented in Table 5 generally look good. Considering the estimated
densities, shown in Figure 3, the dispersion of the estimates for
large values of
normal, with unit variance. The mean values of the estimates
presented in Table 5 generally look good. Considering the estimated
densities, shown in Figure 3, the dispersion of the estimates for
large values of
![]() is, of
course, fairly large, given the small sample size. But, for
reasonable values, like
is, of
course, fairly large, given the small sample size. But, for
reasonable values, like
![]() and
and
![]() , the estimator
still appears to perform acceptably, given the sample size.
, the estimator
still appears to perform acceptably, given the sample size.
Simulation results not reported in this paper also illustrate
that the estimator
![]() works
well for estimating average local-to-unity parameters when the
distribution of the
works
well for estimating average local-to-unity parameters when the
distribution of the ![]() is not normal. In the two cases where the
is not normal. In the two cases where the ![]() were drawn from either uniform
distributions or Cauchy distributions, the estimator
were drawn from either uniform
distributions or Cauchy distributions, the estimator
![]() was
shown to deliver nearly unbiased estimates in finite samples. These
results are available from the author upon request.
was
shown to deliver nearly unbiased estimates in finite samples. These
results are available from the author upon request.
4.2 Asymptotic normality and standard error estimation
Having established convergence of ![]() to
to
![]() as
as
![]() , I now derive the
asymptotic distribution of the estimator. Since the bias corrected
estimator
, I now derive the
asymptotic distribution of the estimator. Since the bias corrected
estimator
![]() is
merely a shifted version of
is
merely a shifted version of ![]() , it will have the same asymptotic variance,
but its distribution will be centered on
, it will have the same asymptotic variance,
but its distribution will be centered on
![]() , rather than on
, rather than on
![]() .6
.6
|
21) |
where
| (22) |
In order to perform inference on ![]() and
and
![]() , an
estimate of the limit variance, given in equation (21), is needed.
If one is willing to work with a specific parametric distribution
for the
, an
estimate of the limit variance, given in equation (21), is needed.
If one is willing to work with a specific parametric distribution
for the ![]() , such
as the normal distribution, then the densities
, such
as the normal distribution, then the densities
![]() and
and
![]() can be calculated
numerically for given
can be calculated
numerically for given
![]() and
and
![]() , and
estimates of
, and
estimates of
![]() and
and
![]() are given by
numerical calculation of
are given by
numerical calculation of
![]() and
and
![]() . Similarly, the
expectation
. Similarly, the
expectation
![]() could be numerically calculated. These numerical calculations are
straightforward extensions of the methods used for finding the
medians of
could be numerically calculated. These numerical calculations are
straightforward extensions of the methods used for finding the
medians of ![]() and
and
![]() , and will not be
detailed here.
, and will not be
detailed here.
However, by using non-parametric methods, estimates of the desired quantities can be obtained without making any distributional assumptions. As argued above,
| (23) |
as
|
(24) |
as
|
(25) |
where
Finally, a consistent estimator of
![]() is given
by
is given
by
 |
(26) |
and a consistent estimate of
The non-parametric approach is obviously more robust than the parametric one first described and is recommended in general. It is also the analogue of estimation procedures of the limiting covariance matrix in standard Least Absolute Deviations (LAD) regressions.
5 Conclusion
In this paper, I analyze the problem of estimating the average local-to-unity parameter from a panel data set, where the local-to-unity parameters are treated as random variables. It is shown that the generalization from the setup with identical local-to-unity parameters raises some real issues in terms of consistency.
The pooled estimator for the average local-to-unity parameter is severely biased for even moderate variations in the local-to-unity parameters and could provide very misleading results if used indiscriminately. An alternative median based estimator is proposed instead. The idea behind this estimator is simple. To obtain more robust estimates than those provided by the pooled estimator, the sample median rather than the sample mean is used to extract the crucial cross-sectional information needed to estimate the local-to-unity parameter. The median based estimator is analyzed for the specific case of normally distributed local-to-unity parameters and is shown to exhibit a small asymptotic bias. The bias, however, is almost independent of the variance of the local-to-unity parameters and a simple bias-correction procedure is used to obtain nearly consistent estimates. The estimator is shown to work well in finite samples and appears robust against deviations from the normality assumption.
One issue not considered in this paper is that of heterogenous deterministic trends. Moon and Phillips (1999, 2000, and 2004) show that in the case of identical local-to-unity parameters, heterogenous trends cause the standard pooled estimator to become inconsistent. The effect of deterministic trends on the properties of the median based estimator proposed in this paper is left for future research.
A Appendix
A.1 Numerical calculation of the medians
of  and
and 
First, note that
and, thus,
Further, from Phillips (1987),
Thus,
![$\displaystyle =\int_{-\infty}^{\infty}\left[ \Pr\left( \left. -x\leq J_{i,c_{i}... ...r\right) \leq x\right\vert c_{i}\right) \right] f_{c}\left( c_{i}\right) dc_{i}$](img205.gif) |
||
![$\displaystyle =\int_{-\infty}^{\infty}\left[ 2\Phi\left( \frac{x}{\sqrt{\frac{1... ...left( e^{2rc_{i}}-1\right) }}\right) -1\right] f_{c}\left( c_{i}\right) dc_{i}.$](img206.gif) |
27) |
The median of ![]() , which
we denote
, which
we denote
![]() , is the
solution to
, is the
solution to

In order to derive the median of ![]() , I use the characteristic function approach.
By a result in Tanaka (1996, chapter 4), the characteristic
function of
, I use the characteristic function approach.
By a result in Tanaka (1996, chapter 4), the characteristic
function of ![]() , for a
fixed
, for a
fixed ![]() , is given by
, is given by
![$\displaystyle \Pr\left( \left. m_{2,i}\leq x\right\vert c_{i}\right) =\frac{1}{... ...1-e^{-itx}}{it}\phi_{\left. m_{2}\right\vert c_{i}}\left( t\right) \right] dt. $](img211.gif)
![$\displaystyle \Pr\left( m_{2,i}\leq x\right) =\int_{-\infty}^{\infty}\Pr\left( ... ...2}\right\vert c_{i}}\left( t\right) \right] dtf_{c}\left( c_{i}\right) dc_{i}. $](img212.gif)
Proofs of Theorems
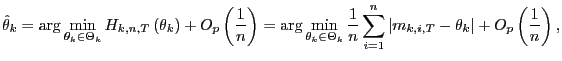
Proof. Proof of Theorem 1. The first order condition
for
![]() , is
, is
![$\displaystyle G_{k,n,T}\left( \theta_{1}\right) =\frac{1}{n}\sum_{i=1}^{n}\left... ...t\{ m_{k,i,T}\leq\theta _{k}\right\} \right] =O_{p}\left( \frac{1}{n}\right) . $](img216.gif)
For fixed ![]() , as
, as
![]() , by
the continuous mapping theorem (CMT),
, by
the continuous mapping theorem (CMT),
![$\displaystyle G_{k,n,T}\left( \theta_{1}\right) \Rightarrow\frac{1}{n}\sum_{i=1... ...ft\{ m_{k,i}\leq \theta_{k}\right\} \right] =G_{k,n}\left( \theta_{k}\right) . $](img217.gif)
The population moment condition for
![]() is
is
![]()
To prove the uniform convergence of
![]() , it is
sufficient to show that
, it is
sufficient to show that
![$\displaystyle \sup_{\theta_{1}\in\Theta_{1}}\left\vert \frac{1}{n}\sum_{i=1}^{n... ...t[ 1\left\{ m_{1,i}\leq\theta_{1}\right\} \right] \right\vert \rightarrow_{p}0 $](img222.gif)
uniformly in
![]() , as
, as
![]() . Consider, for a
fixed
. Consider, for a
fixed
![]() ,
,
![$\displaystyle 1\left\{ m_{1,i,T}\leq\theta_{1}\right\} =1\left\{ \frac{1}{\hat{... ...t-1}\right) \epsilon _{i,t}-T\hat{\Lambda}_{i}\right] \leq\theta_{1}\right\} . $](img223.gif)

as
![]() ,
since
,
since
![]() and
and
![]() . If the
conditions of Corollary 1 of Phillips and Moon (1999) are
satisfied, it then follows that
. If the
conditions of Corollary 1 of Phillips and Moon (1999) are
satisfied, it then follows that
![$\displaystyle \frac{1}{n}\sum_{i=1}^{n}1\left\{ m_{1,i,T}\leq\theta_{1}\right\} \rightarrow_{p}E\left[ 1\left\{ m_{1,i}\leq\theta_{1}\right\} \right] $](img227.gif)
Since ![]() is a
compact space, to establish uniform convergence one only needs to
show that
is a
compact space, to establish uniform convergence one only needs to
show that
![$\displaystyle X_{1,n,T}\left( \theta_{1}\right) =\frac{1}{n}\sum_{i=1}^{n}\left... ...a_{1}\right\} -E\left[ 1\left\{ m_{1,i} \leq\theta_{1}\right\} \right] \right) $](img230.gif)
is stochastically equicontinuous. This follows by standard
arguments and the proof is not detailed here. The same arguments
can be applied to
![]() and will not be
repeated. Thus, as
and will not be
repeated. Thus, as
![]() ,
,
![]()
Proof of Theorem 2. Observe first, that for fixed ![]() , as
, as
![]() ,
,
![\begin{displaymath} \sqrt{n}\left( \begin{array}[c]{c} G_{1,n,T}\left( \theta_{1... ..._{2,i}\leq \theta_{2}^{0}\right\} \right] \end{array}\right) . \end{displaymath}](img234.gif)
By the Lindeberg-Feller central limit theorem (CLT), as
![]() ,
,
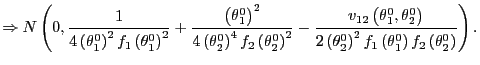
![\begin{displaymath} \frac{1}{\sqrt{n}}\sum_{i=1}^{n}\left( \begin{array}[c]{c} \... ...\} \right] \end{array}\right) \Rightarrow N\left( 0,V\right) , \end{displaymath}](img235.gif)
where
![\begin{displaymath} V=\left( \begin{array}[c]{cc} 1 & E\left[ sign\left( m_{1,i}... ..._{2,i} -\theta_{2}^{0}\right) \right] & 1 \end{array}\right) . \end{displaymath}](img236.gif) Thus, as
Thus, as
![]() ,
,
![\begin{displaymath} \sqrt{n}\left( \begin{array}[c]{c} G_{1,n,T}\left( \theta_{1... ...{0}\right) \end{array}\right) \Rightarrow N\left( 0,V\right) . \end{displaymath}](img237.gif)
Next, for ![]() , for
fixed
, for
fixed ![]() , as
, as
![]() ,
,
![]()
From the expressions of
![]() and
and
![]() , derived in Appendix
A.1, it is obvious that they are both differentiable, and, hence,
so are
, derived in Appendix
A.1, it is obvious that they are both differentiable, and, hence,
so are
![]() and
and
![]() . Having established the
asymptotic normality of
. Having established the
asymptotic normality of
![]() , and the
stochastic equicontinuity of the normalized process
, and the
stochastic equicontinuity of the normalized process
![]() , the asymptotic
normality of
, the asymptotic
normality of
![]() now
follows from standard results for extremum estimators with
non-smooth criterion functions (e.g. Theorem 7.1. in Newey and
Mcfadden, 1994). The limiting covariance matrix is given by
now
follows from standard results for extremum estimators with
non-smooth criterion functions (e.g. Theorem 7.1. in Newey and
Mcfadden, 1994). The limiting covariance matrix is given by
![\begin{displaymath} \left( \begin{array}[c]{c} \frac{d}{d\theta^{\prime}}G_{1}\l... ...ac{1}{f_{2}\left( \theta_{2}\right) ^{2}} \end{array}\right) . \end{displaymath}](img247.gif)
References
1. Billingsley, P., 1995. Probability and Measure, Third Edition (Wiley, New York).
2. Campbell, J., and M. Yogo, 2003. Efficient Tests of Stock Return Predictability, Working Paper, Harvard University.
3. Cavanagh, C., G. Elliot, and J. Stock, 1995. Inference in models with nearly integrated regressors, Econometric Theory 11, 1131-1147.
4. Choi, I., 2001. Unit Root Tests for Panel Data, Journal of International Money and Finance 20, 249-272.
5. Elliot, G., T.J. Rothenberg, and J.H. Stock, 1996. Efficient Tests for an Autoregressive Unit Root, Econometrica 64, 813-836.
6. Levin A., F. Lin, and C. Chu, 2002. Unit Root Tests in Panel Data: Asymptotic and Finite-Sample Properties, Journal of Econometrics 108, 1-24.
7. Maddala, G.S., and S. Wu, 1999. A Comparative Study of Unit Root Tests with Panel Data and a New Simple Test, Oxford Bulletin of Economics and Statistics 61, 631-651.
8. Moon H.R., and B. Perron, 2003. Testing for a Unit Root in Panels with Dynamic Factors, CLEO Working Paper, USC.
9. Moon H.R., B. Perron, and P.C.B Phillips, 2003. Incidental Trends and the Power of Panel Unit Root Tests, Cowles Foundation Discussion Paper 1435.
10. Moon, H.R., and P.C.B. Phillips, 1999. Maximum Likelihood Estimation in Panels with Incidental Trends, Oxford Bulletin of Economics and Statistics 61, 711-748.
11. Moon, H.R., and P.C.B. Phillips, 2000. Estimation of Autoregressive Roots near Unity using Panel Data, Econometric Theory 16, 927-998.
12. Moon, H.R., and P.C.B. Phillips, 2004. GMM Estimation of Autoregressive Roots Near Unity with Panel Data, Econometrica 72, 467-522.
13. Newey, W.K., D. McFadden, 1994. Large sample estimation and hypothesis testing, in Engle, R.F., and D.L. McFadden, eds., Handbook of Econometric, Vol. IV (North-Holland, Amsterdam) 2111-2245.
14. Pagan, A., and A. Ullah, 1999. Nonparametric Econometrics, Cambridge University Press.
15. Phillips, P.C.B, 1987. Towards a Unified Asymptotic Theory of Autoregression, Biometrika 74, 535-547..
16. Phillips, P.C.B., and H.R. Moon, 1999. Linear Regression Limit Theory for Nonstationary Panel Data, Econometrica 67, 1057-1111.
17. Phillips, P.C.B., H.R. Moon, and Z. Xiao, 1998. How to estimate autoregressive roots near unity, Cowles Foundation Discussion Paper 1191.
18. Phillips, P.C.B., and P. Perron, 1988. Testing for a Unit Root in Time Series Regression, Biometrika 75, 335-346.
19. Steele, J.M., 2001. Stochastic Calculus and Financial Applications (Springer, New York).
20. Tanaka, K., 1996. Time Series Analysis: Nonstationary and Noinvetible Distribution Theory (Wiley, New York).
21. Quah, D., 1994. Exploiting Cross-Section Variations for Unit Root Inference in Dynamic Panels, Economics Letters 44, 9-19.
Table 1
The bias properties of the
pooled estimator in the case of normally distributed local-to-unity
parameters. Panel A shows the numerical values for the limit
function of the pooled estimator,
![]() . Panel
B shows the mean values of the pooled estimates of
. Panel
B shows the mean values of the pooled estimates of ![]() ,
, ![]() , from a Monte Carlo simulation with
, from a Monte Carlo simulation with ![]() and
and ![]() , using
, using ![]() repetitions. The innovations are
repetitions. The innovations are ![]() normal with variance
equal to one. The local-to-unity parameters are also drawn from
normal distributions with mean
normal with variance
equal to one. The local-to-unity parameters are also drawn from
normal distributions with mean ![]() given by the left most column and standard deviation
given by the left most column and standard deviation
![]() given by
the top row.
given by
the top row.
Panel A
| 0.0 | 1.0 | 2.0 | 3.0 | 4.0 | 5.0 | 6.0 | 7.0 | 8.0 | 9.0 | 10.0 | |
|---|---|---|---|---|---|---|---|---|---|---|---|
| -50.0 | -50.0 | -50.0 | -49.9 | -49.8 | -49.7 | -49.5 | -49.3 | -48.8 | 76.3 | 110.5 | 148.7 |
| -40.0 | -40.0 | -40.0 | -39.9 | -39.8 | -39.6 | -39.4 | -39.1 | 56.2 | 86.5 | 120.7 | 158.7 |
| -30.0 | -30.0 | -30.0 | -29.9 | -29.7 | -29.5 | -29.1 | 40.1 | 66.5 | 96.7 | 130.8 | 168.8 |
| -20.0 | -20.0 | -20.0 | -19.8 | -19.5 | -19.1 | 29.0 | 50.6 | 76.7 | 106.8 | 140.9 | 178.9 |
| -10.0 | -10.0 | -9.9 | -9.6 | -8.7 | 20.3 | 38.7 | 60.8 | 86.9 | 116.9 | 150.9 | 188.9 |
| -9.0 | -9.0 | -8.9 | -8.5 | -6.6 | 21.4 | 39.7 | 61.8 | 87.9 | 117.9 | 151.9 | 189.9 |
| -8.0 | -8.0 | -7.9 | -7.5 | -2.6 | 22.5 | 40.8 | 62.8 | 88.9 | 118.9 | 152.9 | 191.0 |
| -7.0 | -7.0 | -6.9 | -6.4 | 3.8 | 23.6 | 41.8 | 63.9 | 89.9 | 119.9 | 153.9 | 192.0 |
| -6.0 | -6.0 | -5.8 | -5.2 | 8.5 | 24.7 | 42.8 | 64.9 | 90.9 | 120.9 | 155.0 | 193.0 |
| -5.0 | -5.0 | -4.8 | -3.8 | 10.9 | 25.7 | 43.8 | 65.9 | 91.9 | 122.0 | 156.0 | 194.0 |
| -4.0 | -4.0 | -3.8 | -2.1 | 12.4 | 26.8 | 44.9 | 66.9 | 92.9 | 123.0 | 157.0 | 195.0 |
| -3.0 | -3.0 | -2.7 | 0.2 | 13.6 | 27.8 | 45.9 | 67.9 | 94.0 | 124.0 | 158.0 | 196.0 |
| -2.0 | -2.0 | -1.6 | 2.8 | 14.7 | 28.9 | 46.9 | 69.0 | 95.0 | 125.0 | 159.0 | 197.0 |
| -1.0 | -1.0 | -0.4 | 5.0 | 15.8 | 29.9 | 48.0 | 70.0 | 96.0 | 126.0 | 160.0 | 198.0 |
| 0.0 | 0.0 | 0.9 | 6.6 | 16.9 | 31.0 | 49.0 | 71.0 | 97.0 | 127.0 | 161.0 | 199.0 |
| 1.0 | 1.0 | 2.2 | 7.9 | 18.0 | 32.0 | 50.0 | 72.0 | 98.0 | 128.0 | 162.0 | 200.0 |
| 2.0 | 2.0 | 3.4 | 9.1 | 19.0 | 33.0 | 51.0 | 73.0 | 99.0 | 129.0 | 163.0 | 201.0 |
| 3.0 | 3.0 | 4.5 | 10.2 | 20.1 | 34.1 | 52.0 | 74.0 | 100.0 | 130.0 | 164.0 | 202.0 |
| 4.0 | 4.0 | 5.6 | 11.3 | 21.1 | 35.1 | 53.1 | 75.0 | 101.0 | 131.0 | 165.0 | 203.0 |
| 5.0 | 5.0 | 6.7 | 12.3 | 22.2 | 36.1 | 54.1 | 76.1 | 102.0 | 132.0 | 166.0 | 204.0 |
Panel B
| 0.0 | 1.0 | 2.0 | 3.0 | 4.0 | 5.0 | 6.0 | 7.0 | 8.0 | 9.0 | 10.0 | |
|---|---|---|---|---|---|---|---|---|---|---|---|
| -50.0 | -50.0 | -50.0 | -49.9 | -49.9 | -49.7 | -49.5 | -49.3 | -49.1 | -48.7 | -48.4 | -47.9 |
| -40.0 | -40.0 | -40.0 | -39.9 | -39.8 | -39.6 | -39.4 | -39.1 | -38.8 | -38.3 | -37.8 | -37.1 |
| -30.0 | -30.0 | -30.0 | -29.9 | -29.7 | -29.5 | -29.2 | -28.8 | -28.2 | -27.4 | -26.0 | -23.6 |
| -20.0 | -20.0 | -20.0 | -19.8 | -19.6 | -19.2 | -18.6 | -17.5 | -15.3 | -11.1 | -5.5 | 0.3 |
| -10.0 | -10.0 | -9.9 | -9.6 | -8.9 | -7.0 | -2.5 | 2.6 | 6.7 | 9.7 | 12.3 | 14.8 |
| -9.0 | -9.0 | -8.9 | -8.6 | -7.7 | -5.1 | -0.2 | 4.6 | 8.0 | 10.7 | 13.3 | 16.0 |
| -8.0 | -8.0 | -7.9 | -7.5 | -6.4 | -3.0 | 2.1 | 6.1 | 9.1 | 11.7 | 14.3 | 16.9 |
| -7.0 | -7.0 | -6.9 | -6.4 | -4.8 | -0.7 | 3.9 | 7.5 | 10.2 | 12.8 | 15.4 | 17.9 |
| -6.0 | -6.0 | -5.9 | -5.3 | -3.0 | 1.5 | 5.6 | 8.6 | 11.2 | 13.8 | 16.4 | 18.9 |
| -5.0 | -5.0 | -4.8 | -4.0 | -1.1 | 3.5 | 6.9 | 9.7 | 12.2 | 14.8 | 17.3 | 19.7 |
| -4.0 | -4.0 | -3.8 | -2.6 | 1.0 | 5.0 | 8.1 | 10.7 | 13.2 | 15.8 | 18.3 | 20.9 |
| -3.0 | -3.0 | -2.7 | -1.1 | 2.9 | 6.3 | 9.1 | 11.7 | 14.2 | 16.9 | 19.4 | 21.8 |
| -2.0 | -2.0 | -1.6 | 0.6 | 4.4 | 7.4 | 10.1 | 12.7 | 15.3 | 17.9 | 20.4 | 22.9 |
| -1.0 | -1.0 | -0.4 | 2.3 | 5.7 | 8.5 | 11.1 | 13.7 | 16.3 | 18.8 | 21.4 | 23.9 |
| 0.0 | 0.0 | 0.8 | 3.7 | 6.8 | 9.5 | 12.1 | 14.7 | 17.3 | 19.8 | 22.3 | 24.9 |
| 1.0 | 1.0 | 2.0 | 5.0 | 7.9 | 10.6 | 13.2 | 15.7 | 18.3 | 20.8 | 23.4 | 25.8 |
| 2.0 | 2.0 | 3.2 | 6.1 | 8.9 | 11.5 | 14.2 | 16.8 | 19.3 | 21.7 | 24.4 | 26.8 |
| 3.0 | 3.0 | 4.3 | 7.1 | 9.9 | 12.6 | 15.2 | 17.8 | 20.3 | 22.8 | 25.3 | 27.9 |
| 4.0 | 4.0 | 5.4 | 8.2 | 10.9 | 13.6 | 16.1 | 18.7 | 21.3 | 23.9 | 26.3 | 28.9 |
| 5.0 | 5.0 | 6.4 | 9.2 | 11.9 | 14.6 | 17.2 | 19.7 | 22.2 | 24.8 | 27.3 | 29.8 |
Table 2
The bias properties of the
pooled estimator in the case of uniformly distributed
local-to-unity parameters, where ![]() is given by the left most column and
is given by the left most column and ![]() by the top row. Panel A shows the
numerical values of the function
by the top row. Panel A shows the
numerical values of the function
![]() . Panel B
reports the mean values of the pooled estimates of
. Panel B
reports the mean values of the pooled estimates of ![]() from a Monte Carlo simulation with
from a Monte Carlo simulation with ![]() and
and ![]() , using
, using ![]() repetitions. The local-to-unity
parameters are drawn from uniform distributions with parameters
repetitions. The local-to-unity
parameters are drawn from uniform distributions with parameters ![]() and
and ![]() . The numbers in parentheses are
the true values for
. The numbers in parentheses are
the true values for ![]() .
.
Panel A
| -20.0 | -15.0 | -10.0 | -5.0 | 0.0 | 5.0 | 10.0 | |
|---|---|---|---|---|---|---|---|
| -25.0 | -22.4 | -19.6 | -16.4 | -12.6 | -6.5 | 4.2 | 9.4 |
| -20.0 | -17.4 | -14.5 | -10.9 | -5.4 | 4.2 | 9.4 | |
| -15.0 | -12.3 | -9.2 | -4.3 | 4.2 | 9.4 | ||
| -10.0 | -7.2 | -3.1 | 4.2 | 9.4 | |||
| -5.0 | -1.8 | 4.3 | 9.4 | ||||
| 0.0 | 4.3 | 9.4 | |||||
| 5.0 | 9.4 |
Panel B
| -20.0 | -15.0 | -10.0 | -5.0 | 0.0 | 5.0 | 10.0 | |
|---|---|---|---|---|---|---|---|
| -25.0 | -22.4 | -19.6 | -16.5 | -12.6 | -6.7 | 3.8 | 9.2 |
| (-22.5) | (-20.0) | (-17.5) | (-15.0) | (-12.5) | (-10.0) | (-7.5) | |
| -20.0 | -17.4 | -14.5 | -11.0 | -5.6 | 3.9 | 9.2 | |
| (-17.5) | (-15.0) | (-12.5) | (-10.0) | (-7.5) | (-5.0) | ||
| -15.0 | -12.4 | -9.2 | -4.5 | 4.0 | 9.2 | ||
| (-12.5) | (-10.0) | (-7.5) | (-5.0) | (-2.5) | |||
| -10.0 | -7.3 | -3.2 | 4.1 | 9.3 | |||
| (-7.5) | (-5.0) | (-2.5) | (0.0) | ||||
| -5.0 | -1.8 | 4.2 | 9.3 | ||||
| (-2.5) | (0.0) | (2.5) | |||||
| 0.0 | 4.3 | 9.4 | |||||
| (2.5) | (5.0) | ||||||
| 5.0 | 9.4 | ||||||
| (7.5) |
Table 3
The bias properties of the
median based estimator for normally distributed local-to-unity
parameters. Panel A shows numerical values for the limit function,
![]() , for different
combinations of
, for different
combinations of ![]() and
and ![]() . Panel B
shows mean values of the median based estimates of
. Panel B
shows mean values of the median based estimates of ![]() ,
, ![]() , from a Monte Carlo simulation with
, from a Monte Carlo simulation with ![]() and
and ![]() , using
, using ![]() repetitions. The innovations are
repetitions. The innovations are ![]() normal with variance
equal to one. The local-to-unity parameters are also drawn from
normal distributions with
normal with variance
equal to one. The local-to-unity parameters are also drawn from
normal distributions with ![]() given by the left most column and
given by the left most column and
![]() given by
the top row. The estimates have not been bias corrected.
given by
the top row. The estimates have not been bias corrected.
Panel A
| 0.0 | 1.0 | 2.0 | 3.0 | 4.0 | 5.0 | 6.0 | 7.0 | 8.0 | 9.0 | 10.0 | |
|---|---|---|---|---|---|---|---|---|---|---|---|
| -50.0 | -51.3 | -51.3 | -51.3 | -51.3 | -51.3 | -51.3 | -51.3 | -51.3 | -51.3 | -51.3 | -51.3 |
| -40.0 | -41.3 | -41.3 | -41.3 | -41.3 | -41.3 | -41.3 | -41.3 | -41.3 | -41.3 | -41.3 | -41.3 |
| -30.0 | -31.3 | -31.3 | -31.3 | -31.3 | -31.3 | -31.3 | -31.3 | -31.3 | -31.3 | -31.3 | -31.3 |
| -20.0 | -21.3 | -21.3 | -21.3 | -21.3 | -21.3 | -21.3 | -21.3 | -21.3 | -21.3 | -21.3 | -21.3 |
| -10.0 | -11.3 | -11.3 | -11.3 | -11.3 | -11.3 | -11.3 | -11.2 | -11.2 | -11.2 | -11.2 | -11.2 |
| -9.0 | -10.3 | -10.3 | -10.3 | -10.3 | -10.3 | -10.3 | -10.2 | -10.2 | -10.2 | -10.2 | -10.2 |
| -8.0 | -9.3 | -9.3 | -9.3 | -9.3 | -9.3 | -9.2 | -9.2 | -9.2 | -9.2 | -9.2 | -9.2 |
| -7.0 | -8.3 | -8.3 | -8.3 | -8.3 | -8.3 | -8.2 | -8.2 | -8.2 | -8.2 | -8.2 | -8.2 |
| -6.0 | -7.3 | -7.3 | -7.3 | -7.3 | -7.2 | -7.2 | -7.2 | -7.2 | -7.2 | -7.1 | -7.1 |
| -5.0 | -6.3 | -6.3 | -6.3 | -6.2 | -6.2 | -6.2 | -6.2 | -6.1 | -6.1 | -6.1 | -6.1 |
| -4.0 | -5.3 | -5.3 | -5.2 | -5.2 | -5.2 | -5.2 | -5.1 | -5.1 | -5.1 | -5.1 | -5.1 |
| -3.0 | -4.2 | -4.2 | -4.2 | -4.2 | -4.1 | -4.1 | -4.1 | -4.1 | -4.1 | -4.1 | -4.0 |
| -2.0 | -3.2 | -3.2 | -3.2 | -3.1 | -3.1 | -3.1 | -3.1 | -3.0 | -3.0 | -3.0 | -3.0 |
| -1.0 | -2.1 | -2.1 | -2.1 | -2.0 | -2.0 | -2.0 | -2.0 | -2.0 | -2.0 | -2.0 | -2.0 |
| 0.0 | -0.9 | -0.9 | -0.9 | -0.9 | -0.9 | -0.9 | -0.9 | -0.9 | -0.9 | -0.9 | -0.9 |
| 1.0 | 0.4 | 0.3 | 0.3 | 0.3 | 0.3 | 0.3 | 0.3 | 0.3 | 0.2 | 0.2 | 0.2 |
| 2.0 | 1.7 | 1.6 | 1.5 | 1.5 | 1.5 | 1.4 | 1.4 | 1.4 | 1.4 | 1.4 | 1.4 |
| 3.0 | 2.9 | 2.7 | 2.6 | 2.6 | 2.6 | 2.6 | 2.6 | 2.6 | 2.6 | 2.6 | 2.6 |
| 4.0 | 4.0 | 3.8 | 3.7 | 3.7 | 3.7 | 3.7 | 3.7 | 3.7 | 3.7 | 3.7 | 3.7 |
| 5.0 | 5.0 | 4.8 | 4.8 | 4.8 | 4.8 | 4.8 | 4.8 | 4.8 | 4.8 | 4.8 | 4.8 |
Panel B
| 0.0 | 1.0 | 2.0 | 3.0 | 4.0 | 5.0 | 6.0 | 7.0 | 8.0 | 9.0 | 10.0 | |
|---|---|---|---|---|---|---|---|---|---|---|---|
| -50.0 | -51.0 | -51.0 | -51.0 | -51.0 | -51.0 | -51.0 | -51.0 | -51.0 | -51.0 | -50.9 | -51.0 |
| -40.0 | -41.0 | -41.0 | -41.0 | -41.0 | -41.0 | -41.0 | -41.0 | -41.0 | -41.0 | -41.0 | -41.0 |
| -30.0 | -31.0 | -31.0 | -31.0 | -31.0 | -31.0 | -31.0 | -31.0 | -31.0 | -31.0 | -31.0 | -31.0 |
| -20.0 | -21.1 | -21.1 | -21.1 | -21.1 | -21.0 | -21.1 | -21.0 | -21.0 | -21.0 | -21.0 | -21.0 |
| -10.0 | -11.1 | -11.1 | -11.1 | -11.1 | -11.1 | -11.1 | -11.1 | -11.1 | -11.0 | -11.0 | -11.0 |
| -9.0 | -10.2 | -10.1 | -10.1 | -10.1 | -10.1 | -10.1 | -10.1 | -10.1 | -10.0 | -10.0 | -10.0 |
| -8.0 | -9.1 | -9.2 | -9.1 | -9.1 | -9.1 | -9.1 | -9.1 | -9.1 | -9.0 | -9.0 | -9.0 |
| -7.0 | -8.3 | -8.2 | -8.2 | -8.1 | -8.1 | -8.1 | -8.1 | -8.1 | -8.0 | -8.0 | -8.0 |
| -6.0 | -7.3 | -7.2 | -7.3 | -7.2 | -7.1 | -7.1 | -7.1 | -7.1 | -7.0 | -7.0 | -7.0 |
| -5.0 | -6.3 | -6.2 | -6.3 | -6.2 | -6.1 | -6.1 | -6.1 | -6.0 | -6.1 | -6.0 | -6.0 |
| -4.0 | -5.2 | -5.2 | -5.3 | -5.2 | -5.1 | -5.1 | -5.1 | -5.1 | -5.0 | -5.0 | -5.0 |
| -3.0 | -4.2 | -4.2 | -4.3 | -4.1 | -4.1 | -4.1 | -4.1 | -4.1 | -4.0 | -4.0 | -4.0 |
| -2.0 | -3.3 | -3.2 | -3.1 | -3.1 | -3.1 | -3.0 | -3.0 | -3.0 | -3.0 | -3.0 | -3.0 |
| -1.0 | -2.1 | -2.1 | -2.1 | -2.0 | -2.0 | -2.0 | -2.0 | -2.0 | -1.9 | -1.9 | -1.9 |
| 0.0 | -1.0 | -0.9 | -0.9 | -0.9 | -0.9 | -0.9 | -0.9 | -0.9 | -0.8 | -0.8 | -0.8 |
| 1.0 | 0.4 | 0.3 | 0.3 | 0.3 | 0.3 | 0.3 | 0.3 | 0.3 | 0.3 | 0.3 | 0.3 |
| 2.0 | 1.7 | 1.6 | 1.5 | 1.4 | 1.5 | 1.5 | 1.5 | 1.5 | 1.5 | 1.5 | 1.5 |
| 3.0 | 2.9 | 2.7 | 2.7 | 2.7 | 2.7 | 2.7 | 2.7 | 2.7 | 2.7 | 2.7 | 2.7 |
| 4.0 | 4.0 | 3.8 | 3.8 | 3.8 | 3.8 | 3.8 | 3.8 | 3.8 | 3.8 | 3.8 | 3.8 |
| 5.0 | 5.0 | 4.8 | 4.8 | 4.8 | 4.8 | 4.8 | 4.8 | 4.9 | 4.9 | 4.9 | 4.9 |
Table 4
Numerical values for the limit
function of the median based estimator,
![]() , for the
homogenous case
, for the
homogenous case
![]() .
.
|
|
|
|
|
|
|
||||||
|---|---|---|---|---|---|---|---|---|---|---|---|
| -50.00 | -51.28 | -14.00 | -15.28 | -6.80 | -8.07 | -3.20 | -4.45 | 0.40 | -0.42 | 4.00 | 3.98 |
| -49.00 | -50.28 | -13.00 | -14.28 | -6.70 | -7.97 | -3.10 | -4.35 | 0.50 | -0.28 | 4.10 | 4.08 |
| -48.00 | -49.28 | -12.00 | -13.28 | -6.60 | -7.87 | -3.00 | -4.24 | 0.60 | -0.15 | 4.20 | 4.18 |
| -47.00 | -48.28 | -11.00 | -12.28 | -6.50 | -7.77 | -2.90 | -4.14 | 0.70 | -0.01 | 4.30 | 4.29 |
| -46.00 | -47.28 | -10.00 | -11.28 | -6.40 | -7.67 | -2.80 | -4.04 | 0.80 | 0.13 | 4.40 | 4.39 |
| -45.00 | -46.28 | -9.90 | -11.18 | -6.30 | -7.57 | -2.70 | -3.94 | 0.90 | 0.27 | 4.50 | 4.49 |
| -44.00 | -45.28 | -9.80 | -11.08 | -6.20 | -7.47 | -2.60 | -3.83 | 1.00 | 0.41 | 4.60 | 4.59 |
| -43.00 | -44.28 | -9.70 | -10.98 | -6.10 | -7.37 | -2.50 | -3.73 | 1.10 | 0.54 | 4.70 | 4.69 |
| -42.00 | -43.28 | -9.60 | -10.88 | -6.00 | -7.27 | -2.40 | -3.63 | 1.20 | 0.68 | 4.80 | 4.79 |
| -41.00 | -42.28 | -9.50 | -10.78 | -5.90 | -7.17 | -2.30 | -3.52 | 1.30 | 0.82 | 4.90 | 4.90 |
| -40.00 | -41.28 | -9.40 | -10.68 | -5.80 | -7.07 | -2.20 | -3.42 | 1.40 | 0.96 | 5.00 | 5.00 |
| -39.00 | -40.28 | -9.30 | -10.58 | -5.70 | -6.97 | -2.10 | -3.32 | 1.50 | 1.09 | 6.00 | 6.00 |
| -38.00 | -39.28 | -9.20 | -10.48 | -5.60 | -6.87 | -2.00 | -3.21 | 1.60 | 1.22 | 7.00 | 7.00 |
| -37.00 | -38.28 | -9.10 | -10.38 | -5.50 | -6.77 | -1.90 | -3.11 | 1.70 | 1.36 | 8.00 | 8.00 |
| -36.00 | -37.28 | -9.00 | -10.28 | -5.40 | -6.67 | -1.80 | -3.00 | 1.80 | 1.49 | 9.00 | 9.00 |
| -35.00 | -36.28 | -8.90 | -10.18 | -5.30 | -6.57 | -1.70 | -2.89 | 1.90 | 1.61 | 10.00 | 10.00 |
| -34.00 | -35.28 | -8.80 | -10.08 | -5.20 | -6.47 | -1.60 | -2.79 | 2.00 | 1.74 | ||
| -33.00 | -34.28 | -8.70 | -9.98 | -5.10 | -6.37 | -1.50 | -2.68 | 2.10 | 1.87 | ||
| -32.00 | -33.28 | -8.60 | -9.88 | -5.00 | -6.27 | -1.40 | -2.57 | 2.20 | 1.99 | ||
| -31.00 | -32.28 | -8.50 | -9.78 | -4.90 | -6.17 | -1.30 | -2.46 | 2.30 | 2.11 | ||
| -30.00 | -31.28 | -8.40 | -9.68 | -4.80 | -6.07 | -1.20 | -2.35 | 2.40 | 2.23 | ||
| -29.00 | -30.28 | -8.30 | -9.58 | -4.70 | -5.97 | -1.10 | -2.24 | 2.50 | 2.35 | ||
| -28.00 | -29.28 | -8.20 | -9.48 | -4.60 | -5.87 | -1.00 | -2.13 | 2.60 | 2.47 | ||
| -27.00 | -28.28 | -8.10 | -9.38 | -4.50 | -5.76 | -0.90 | -2.02 | 2.70 | 2.58 | ||
| -26.00 | -27.28 | -8.00 | -9.28 | -4.40 | -5.66 | -0.80 | -1.90 | 2.80 | 2.69 | ||
| -25.00 | -26.28 | -7.90 | -9.18 | -4.30 | -5.56 | -0.70 | -1.79 | 2.90 | 2.81 | ||
| -24.00 | -25.28 | -7.80 | -9.08 | -4.20 | -5.46 | -0.60 | -1.67 | 3.00 | 2.92 | ||
| -23.00 | -24.28 | -7.70 | -8.98 | -4.10 | -5.36 | -0.50 | -1.55 | 3.10 | 3.03 | ||
| -22.00 | -23.28 | -7.60 | -8.88 | -4.00 | -5.26 | -0.40 | -1.43 | 3.20 | 3.14 | ||
| -21.00 | -22.28 | -7.50 | -8.78 | -3.90 | -5.16 | -0.30 | -1.31 | 3.30 | 3.24 | ||
| -20.00 | -21.28 | -7.40 | -8.67 | -3.80 | -5.06 | -0.20 | -1.19 | 3.40 | 3.35 | ||
| -19.00 | -20.28 | -7.30 | -8.57 | -3.70 | -4.96 | -0.10 | -1.06 | 3.50 | 3.46 | ||
| -18.00 | -19.28 | -7.20 | -8.47 | -3.60 | -4.86 | 0.00 | -0.94 | 3.60 | 3.56 | ||
| -17.00 | -18.28 | -7.10 | -8.37 | -3.50 | -4.75 | 0.10 | -0.81 | 3.70 | 3.67 | ||
| -16.00 | -17.28 | -7.00 | -8.27 | -3.40 | -4.65 | 0.20 | -0.68 | 3.80 | 3.77 | ||
| -15.00 | -16.28 | -6.90 | -8.17 | -3.30 | -4.55 | 0.30 | -0.55 | 3.90 | 3.88 |
Table 5
Mean values of the bias
corrected median estimates of ![]() ,
,
![]() , from a
Monte Carlo simulation with
, from a
Monte Carlo simulation with ![]() and
and ![]() , using
, using ![]() repetitions. The innovations are
repetitions. The innovations are ![]() normal with variance equal to one.
The local-to-unity parameters are also drawn from a normal
distribution with
normal with variance equal to one.
The local-to-unity parameters are also drawn from a normal
distribution with ![]() given
by the left most column and
given
by the left most column and ![]() given by the top row.
given by the top row.
| 0.0 | 1.0 | 2.0 | 3.0 | 4.0 | 5.0 | 6.0 | 7.0 | 8.0 | 9.0 | 10.0 | |
|---|---|---|---|---|---|---|---|---|---|---|---|
| -50.0 | -49.1 | -49.1 | -49.1 | -49.1 | -49.0 | -49.1 | -49.0 | -49.0 | -48.9 | -48.9 | -48.8 |
| -40.0 | -39.3 | -39.3 | -39.3 | -39.3 | -39.2 | -39.2 | -39.2 | -39.1 | -39.1 | -39.1 | -39.1 |
| -30.0 | -29.4 | -29.4 | -29.4 | -29.4 | -29.4 | -29.4 | -29.3 | -29.4 | -29.3 | -29.2 | -29.3 |
| -20.0 | -19.5 | -19.5 | -19.6 | -19.5 | -19.5 | -19.5 | -19.5 | -19.4 | -19.5 | -19.4 | -19.4 |
| -10.0 | -9.7 | -9.7 | -9.7 | -9.7 | -9.6 | -9.6 | -9.5 | -9.5 | -9.4 | -9.4 | -9.3 |
| -9.0 | -8.7 | -8.7 | -8.7 | -8.7 | -8.6 | -8.6 | -8.5 | -8.5 | -8.4 | -8.4 | -8.3 |
| -8.0 | -7.7 | -7.7 | -7.7 | -7.7 | -7.7 | -7.6 | -7.5 | -7.5 | -7.5 | -7.4 | -7.4 |
| -7.0 | -6.8 | -6.7 | -6.7 | -6.7 | -6.7 | -6.6 | -6.5 | -6.5 | -6.4 | -6.4 | -6.3 |
| -6.0 | -5.8 | -5.8 | -5.7 | -5.7 | -5.6 | -5.6 | -5.5 | -5.5 | -5.4 | -5.5 | -5.4 |
| -5.0 | -4.8 | -4.8 | -4.7 | -4.7 | -4.7 | -4.6 | -4.6 | -4.5 | -4.5 | -4.5 | -4.4 |
| -4.0 | -3.8 | -3.8 | -3.8 | -3.7 | -3.7 | -3.6 | -3.6 | -3.5 | -3.5 | -3.5 | -3.4 |
| -3.0 | -2.9 | -2.9 | -2.8 | -2.7 | -2.7 | -2.6 | -2.6 | -2.6 | -2.5 | -2.5 | -2.5 |
| -2.0 | -1.9 | -1.9 | -1.8 | -1.8 | -1.7 | -1.7 | -1.7 | -1.6 | -1.6 | -1.5 | -1.5 |
| -1.0 | -1.0 | -0.9 | -0.9 | -0.9 | -0.8 | -0.8 | -0.8 | -0.7 | -0.7 | -0.6 | -0.6 |
| 0.0 | -0.0 | 0.0 | 0.0 | 0.1 | 0.1 | 0.1 | 0.2 | 0.3 | 0.3 | 0.4 | 0.5 |
| 1.0 | 1.0 | 0.9 | 0.9 | 1.0 | 1.0 | 1.1 | 1.1 | 1.2 | 1.3 | 1.3 | 1.4 |
| 2.0 | 2.0 | 1.9 | 1.9 | 1.9 | 2.0 | 2.0 | 2.1 | 2.2 | 2.2 | 2.3 | 2.4 |
| 3.0 | 3.0 | 2.9 | 2.8 | 2.9 | 2.9 | 3.0 | 3.1 | 3.1 | 3.2 | 3.3 | 3.4 |
| 4.0 | 4.0 | 3.8 | 3.8 | 3.9 | 3.9 | 4.0 | 4.1 | 4.2 | 4.3 | 4.3 | 4.3 |
| 5.0 | 5.0 | 4.9 | 4.9 | 4.9 | 5.0 | 5.1 | 5.1 | 5.2 | 5.2 | 5.4 | 5.4 |
Figure 1
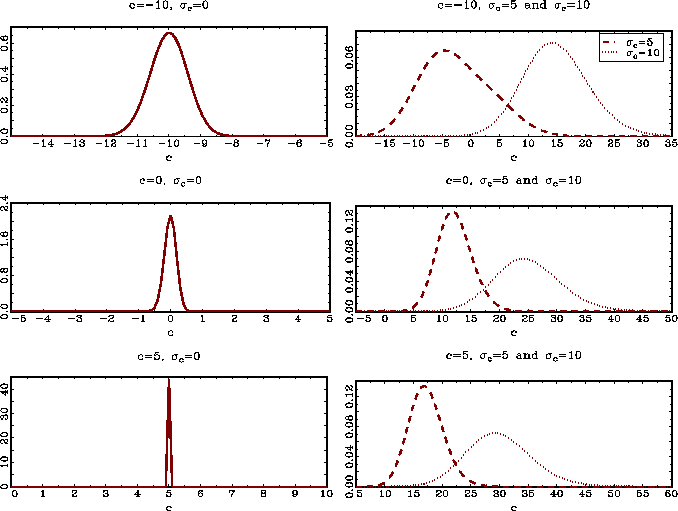
Figure 2
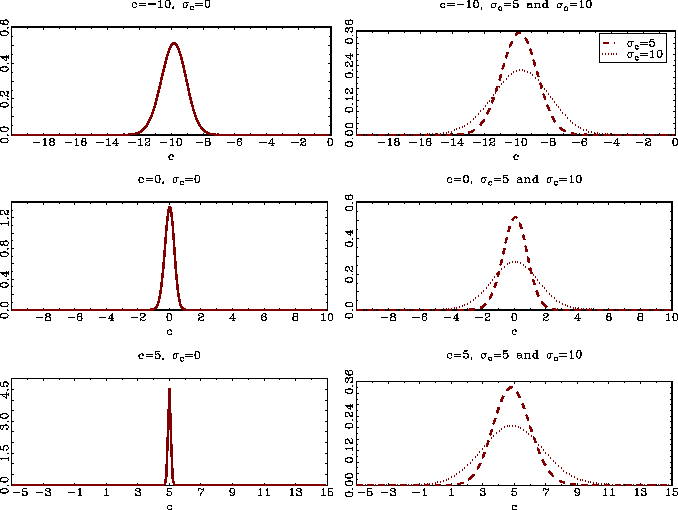
Figure 3
Footnotes
1. I am grateful to Peter Phillips and Don Andrews for providing much useful advice. Other helpful comments have also been provided by Randi Pintoff, Lennart Hjalmarsson, and Catalin Starica as well as seminar participants at the European meeting of the Econometric Society in Madrid, 2004, and the econometrics seminar at Göteborg University. Return to text
2. Tel.: +1-202-452-2436; fax: +1-202-263-4850; email: [email protected]. The views presented in this paper are solely those of the author and do not represent those of the Federal Reserve Board or its staff. Return to text
3. Phillips et al. (1998) do provide a method of estimating local-to-unity roots from a single time-series using a block model. However, their specification of the local-to-unity model is somewhat different from the one typically adopted in the literature. Return to text
4. See for instance Quah (1994), Maddala and Wu (1999), Choi (2001), Levin et al. (2002), Moon and Perron (2003), and Moon et al. (2003). Return to text
5. Steele (2001) gives an
illustrative example of the problems of simulating tail
probabilities. He argues that if one attempts to simulate the value
of
![]() , where
, where
![]() is standard normal,
by naive methods, the number of simulations needs to be of an order
greater than
is standard normal,
by naive methods, the number of simulations needs to be of an order
greater than ![]() . Return to
text
. Return to
text
6. The asymptotic normality of the
estimator is only shown for sequential limits. Subject to some
additional rate restrictions on ![]() and
and ![]() the
result also likely holds in joint limits as
the
result also likely holds in joint limits as
![]() . However, due to
the non-linear nature of the median operator, the proof for joint
limits becomes very technical and is not crucial to the relatively
applied discussion of this paper. Return
to text
. However, due to
the non-linear nature of the median operator, the proof for joint
limits becomes very technical and is not crucial to the relatively
applied discussion of this paper. Return
to text
This version is optimized for use by screen readers. A printable pdf version is available.