FRB: Monetary Policy Report to the Congress, February 27, 2002

Monetary Policy Report submitted to the Congress on February 27, 2002, pursuant to section 2B of the Federal Reserve Act


Section 2

ECONOMIC AND FINANCIAL DEVELOPMENTS IN 2001 AND EARLY 2002

In 2001, the economy turned in its weakest performance in a decade. Real GDP increased at an annual rate of 3/4 percent in the first half of the year and, according to the advance estimate from the Commerce Department, declined at a 1/2 percent annual rate in the second half. Although the effects of the weakening economy were broadly felt, the factory sector was especially hard hit. Faced with slumping demand both here and abroad, manufacturers cut production aggressively to limit excessive buildups of inventories. Moreover, businesses sharply reduced their investment spending, with particularly dramatic cuts in outlays for high-technology equipment. By contrast, household spending was reasonably well maintained, buoyed by lower interest rates and cuts in federal taxes. Firms trimmed payrolls through most of the year, and the unemployment rate moved up nearly 2 percentage points to around 5-3/4 percent by year-end. Job losses were especially large following the terrorist attacks of September 11, which had extremely adverse effects on certain sectors of the economy--most notably, airline transportation and hospitality industries. Nevertheless, by early this year some signs appeared that the economy was beginning to mend.

Chart of Change in real GDP

Inflation declined last year, pulled down by a sharp drop in energy prices. Excluding food and energy items, consumer price inflation leveled off and, by some measures, moved lower last year. Weakening economic activity, the indirect effects of declining energy prices on firms' costs, and continued strong competitive pressures helped keep a lid on core consumer price inflation.

Chart of Change in PCE chain-type price index

The Household Sector

Consumer Spending

Growth in consumer spending slowed last year but remained sufficiently solid to provide an important source of support to overall final demand. Personal consumption expenditures (PCE) increased 3 percent in real terms in 2001 after having advanced 4-1/4 percent in 2000 and around 5 percent in both 1998 and 1999. The deceleration in consumer spending was widespread among durable goods, nondurable goods, and services. However, motor vehicle expenditures remained strong through most of the year and surged in the fall as consumers responded enthusiastically to automakers' aggressive expansion of financing incentives. After September 11, spending declined in certain travel- and tourism-related categories, including air transportation, hotels and motels, and recreation services such as amusement parks; spending in these categories has recovered only partially since then.

Chart of Change in real income and consumption

Last year's downshift in consumption growth reflected the weakening labor market and associated deceleration of income as well as the erosion in household wealth since the middle of 2000. With employment declining over much of last year, real personal income rose only about 1-3/4 percent after a gain of 4-1/2 percent in 2000. The slowing of income growth was even sharper in nominal terms, but price declines for gasoline and other energy items in the latter half of the year substantially cushioned the blow to real incomes. A continued rise in house prices supported the wealth position of many households; in the aggregate, however, household wealth deteriorated further as equity prices moved lower, on net. The decline in wealth since mid-2000 likely exerted a notable restraining influence on household spending last year.

Both monetary and fiscal policy supported consumer spending over the past year. Low interest rates helped enable motor vehicle finance companies to offer favorable financing on new vehicles. In addition, low mortgage rates led to a spate of mortgage refinancing that lasted most of the year, lowering payments and freeing cash to be used by households for other spending needs. Indeed, many households apparently used these refinancings as an opportunity to extract equity from their homes, a move that further accommodated consumer spending. Furthermore, the first wave of tax reductions from the Economic Growth and Tax Relief Reconciliation Act of 2001--including the $300 and $600 rebate checks mailed last summer--likely helped to boost spending in the latter part of the year. The continued phase-in of the tax reductions enacted last year should provide further stimulus to income and consumption this year.

The personal saving rate, which had declined through 1999, leveled off in 2000 and in the first half of 2001. The saving rate moved erratically in the second half of the year but rose on average. It shot up in the summer as households received their tax rebates; it then declined later in the year as households spent some of the rebates and as purchases of new motor vehicles soared in response to the incentives.

Chart of Wealth and saving

Consumer sentiment, as measured by both the University of Michigan Survey Research Center (SRC) and the Conference Board, had been running at extremely high levels through most of 2000 but fell considerably near the beginning of last year as concerns about the economy intensified. By the spring, measures of sentiment leveled off near their historical averages and well above levels normally associated with recessions. Sentiment dropped in September. The SRC measure recovered gradually thereafter, while the Conference Board index fell further before turning up later in the year; by early 2002, both sentiment measures again stood near their historical averages.

Residential Investment

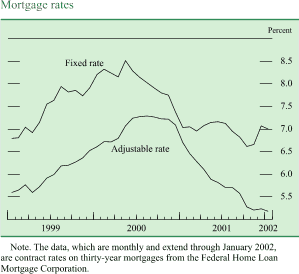
As with consumer spending, real expenditures on housing were well maintained last year, buoyed by favorable mortgage interest rates. Interest rates on thirty-year fixed-rate mortgages, which had been as high as 8-1/2 percent in the spring of 2000, hovered around the low level of 7 percent in the first half of 2001. They moved down further to 6-1/2 percent by late October, before backing up to 7 percent again by December as prospects for the economy improved. As monetary policy eased, contract rates on adjustable-rate mortgages moved down sharply to very low levels in the fourth quarter and into early 2002. According to the Michigan SRC survey, declining mortgage rates have helped elevate consumers' assessments of homebuying conditions substantially since mid-2000.

Chart of Mortgage rates

In the single-family sector, 1.27 million new homes were started last year, 3-1/2 percent more than in 2000, when activity had been held down by higher mortgage rates. The pace of starts moved up further in January 2002, in part because of unusually favorable weather. Furthermore, sizable backlogs of building permits early this year suggest that construction activity will remain solid. Sales of new homes were elevated throughout 2001--indeed, for the year, they were the highest on record--and sales of existing homes remained strong as well. Meanwhile, the increase in home prices moderated last year. The constant-quality price index of new homes, which attempts to control for the mix of homes sold, rose only 1-1/2 percent last year, down from a 6 percent gain in 2000.

Chart of Private housing starts

In the multifamily sector, starts averaged 328,000 units last year, a rate close to the solid pace of the past several years. Conditions are still relatively favorable for the construction of multifamily units. In particular, vacancy rates have remained low, although rents and property values increased at a slower rate last year than in 2000.

Household Finance

Households continued to borrow at a brisk pace last year, increasing their debt outstanding an estimated 8-3/4 percent, a rate about 1 percentage point faster than the average growth over the previous two years. The cumulative declines in mortgage interest rates encouraged households to take on large amounts of mortgage debt, both by fostering homebuying and by making it attractive to refinance existing mortgages and extract some of the accumulated equity; indeed, the Mortgage Bankers Association (MBA) refinancing index in October reached the highest level since its inception in January 1980. The frenzied pace of refinancing activity tailed off some later in the fourth quarter, when fixed mortgage interest rates backed up. All told, mortgage debt grew an estimated 9 percent last year. Strength in durable goods outlays supported growth in consumer credit (debt not secured by real estate) in the first quarter of 2001, but as consumption spending decelerated over the next two quarters, the expansion of consumer credit slowed sharply. However, consumer credit growth surged in the fourth quarter, in large part because of the jump in motor vehicle sales. For the year as a whole, the rate of expansion of consumer credit, at 6-1/4 percent, was well below the 10-1/4 percent rate posted in 2000.

Chart of Household debt service burden

Hefty household borrowing outstripped the growth of disposable personal income in 2001. As a result, despite lower interest rates, the household debt-service burden--an estimate of minimum scheduled payments on mortgage and consumer debt as a share of disposable income--finished the year near the peak recorded at the end of 1986. Measures of household credit quality deteriorated noticeably last year. According to the MBA, delinquency rates on home mortgages continued to trend higher from their historic lows of the late 1990s, and auto loan delinquencies at finance companies edged up, although they too remained at a relatively subdued level. The economic slowdown and the rise in unemployment significantly eroded the quality of loans to subprime borrowers, and delinquency rates for both mortgages and consumer credit in that segment of the market moved sharply higher.

Chart of Delinquency rates on selected types of household loans

The Business Sector

Much of the weakness in activity last year was concentrated in the business sector. In late 2000, manufacturers had begun to cut back production in an effort to reduce an undesired build-up of inventories, and sharp inventory liquidation continued throughout last year. Moreover, the boom in capital outlays that had helped drive the expansion through the late 1990s gave way to a softening of spending in late 2000 and to sharp declines last year. Spending dropped for most types of capital equipment and structures; cutbacks were especially severe for high-tech equipment, some types of which may have been over-bought. A sharp reduction in corporate profits and cash flow contributed to last year's downturn in capital spending, as did general uncertainty about the economic outlook. Despite the reduction in interest rates, which helped restrain businesses' interest expenses, financing conditions worsened somewhat, on balance, given weaker equity values, higher borrowing costs for risky firms, and some tightening of banks' lending standards.

Fixed Investment

Real spending on equipment and software (E&S) declined 8-1/2 percent in 2001 after an increase of the same amount in 2000 and double-digit rates of increase for several preceding years. Spending on high-tech equipment, which has accounted for about 40 percent of E&S spending in recent years, dropped especially sharply last year. Outlays for computers and peripheral equipment, which had risen more than 30 percent in each of the preceding seven years, fell 9 percent in 2001. Spending on communications equipment swung even more severely, moving from increases of more than 20 percent on average from 1998 to 2000 to a decline of more than 30 percent last year. Business spending on software held up comparatively well, falling only 2-1/2 percent in 2001 after having risen around 12 percent in 1999 and 2000.

Chart of Change in real business fixed investment

A number of factors may have weighed on outlays for high-tech equipment, including businesses' decisions to lengthen the replacement cycle for computers in light of weak economic conditions and the absence of new applications requiring the most up-to-date machines. But in addition, the magnitude by which these categories of expenditure had increased in preceding years, together with the abruptness of their downturn, suggests that firms may have been too optimistic about the immediate profitability of some types of high-tech capital; as these expectations were revised, businesses viewed their previous investment as more than sufficient to meet anticipated demand. This possibility is especially likely in the case of communications equipment, for which expectations about prospects for growth in demand appear to have been disappointed. Some of the cutbacks may have reflected a general pulling back in an environment of greater uncertainty. The sharp rise and subsequent decline of equity values in the high-tech sector mirrors the pattern of rising and slowing investment and provides some support for the notion that earnings expectations may have been overly upbeat in the past.

Under the influence of ongoing weakness in the market for heavy trucks, business spending on motor vehicles declined through most of the year. But spending stabilized in the fourth quarter, as the generous incentives on motor vehicles may have helped boost spending by small businesses as well as consumers. Domestic orders for new aircraft declined last year, especially after the terrorist attacks last fall, but these lower orders had not yet affected spending by year-end because of the very long lags involved in producing planes. Apart from spending on transportation and high-tech equipment, real outlays declined 7-1/2 percent last year after having increased 6 percent in 2000, with the turnaround driven by a sharp swing in spending on many types of industrial machinery and on office furniture.

Late last year, conditions in some segments of the high-tech sector showed signs of bottoming. Developments in the semiconductor industry have improved, with production increasing during the fall. Some of the improvement is apparently coming from increased demand for computers. In the advance estimate from the Commerce Department for the fourth quarter, real spending on computers and peripheral equipment was reported to have surged at an annual rate of 40 percent. However, spending on communications equipment, for which evidence of a capital overhang has been most pronounced, continued to decline sharply in the fourth quarter, and orders for communications equipment have yet to display any convincing signs of turning around. As for other types of capital equipment, spending continued to decline in the fourth quarter, but a moderate rebound in new orders for many types of capital goods from their autumn lows hinted that a broader firming of demand may be under way.

Real business spending for nonresidential structures also declined sharply in 2001. Construction of office buildings dropped last year after having increased notably for several years; industrial building remained fairly steady through the first half of last year but plummeted in the second half. Vacancy rates for these two types of properties rose considerably, and by year-end the industrial vacancy rate had reached its highest level since mid-1993. Meanwhile, spending on non-office commercial buildings (a category that includes retail, wholesale, and some warehouse space) decreased moderately last year. Investment in public utilities moved down as well, a decline reflecting, in part, a cutback in spending for communications projects such as the installation of fiber-optic networks. Investment in the energy sector was a pocket of strength last year. Construction of drilling structures surged in 2000 and much of 2001, as the industry responded to elevated prices of oil and natural gas. However, with oil and natural gas prices reversing their earlier increases, drilling activity turned down in the latter part of the year.

Inventory Investment

By late 2000, manufacturers were already cutting production to slow the pace of inventory accumulation as inventories moved up relative to sales. Production cuts intensified in early 2001, and producers and distributers liquidated inventories at increasing rates throughout the year. The runoff of inventories was a major factor holding down GDP growth last year. Indeed, the arithmetic subtraction from real GDP growth attributable to the decline in nonfarm inventory investment was 1-1/2 percentage points over the four quarters of 2001. However, because sales also were weakening, inventory-sales ratios remained high in much of the manufacturing sector, and in some portions of the wholesale sector as well, throughout the year.

Chart of Change in real nonfarm business inventories

The motor vehicle sector accounted for about one-quarter of last year's overall inventory drawdown. Late in 2000 and early last year, automakers cut production in an attempt to clear out excess stocks held by dealers. By the spring, vehicle assemblies had stabilized, and the automakers instead dealt with heavy stocks by further sweetening incentives to boost sales. By the end of the year, inventories of cars and light trucks stood at a relatively lean 2-1/4 million units, nearly 1 million units fewer than were held a year earlier.

Corporate Profits and Business Finance

The profitability of the U.S. nonfinancial corporate sector suffered a severe blow in 2001. The profit slump had begun in the fourth quarter of the previous year, when the economic profits of nonfinancial corporations--that is, book profits from current production with inventory and capital consumption adjustments compiled by the Commerce Department--plummeted almost 45 percent at an annual rate. The first three quarters of 2001 brought little respite, and economic profits spiraled downward at an average annual rate of 25 percent. The ratio of the profits of nonfinancial corporations to the sector's gross nominal output fell to 7-1/2 percent last year, a level not seen since the early 1980s. Earnings reports for the fourth quarter indicate that nonfinancial corporate profits continued to fall late in the year.

Chart of Before-tax profits of nonfinancial corporations 
as a percent of sector GDP

Business borrowing slowed markedly last year because firms slashed investment in fixed capital and inventories even more than the drop in profits and other internally generated funds. Business debt expanded at a 6-1/4 percent annual rate in 2001, well below the double-digit rates of the two previous years, and its composition shifted decidedly toward longer-term sources of funds. Early in the year, favorable conditions in the corporate bond market, combined with firms' desire to lock in low interest rates, prompted investment-grade firms to issue a high volume of bonds. They used the proceeds to strengthen their balance sheets by repaying short-term debt obligations, refinancing other longer-term debt, and building up liquid assets. Junk bond issuance was also strong early in 2001, as speculative-grade yields fell in response to monetary policy easings, although investors shunned the riskiest issues amid increasing economic uncertainty and rising defaults among below-investment-grade borrowers.

Chart of Major components of net business financing

Chart of Financing gap and net equity retirement at 
nonfarm nonfinancial corporations

The heavy pace of bond issuance, along with a reduced need to finance capital investments, enabled firms to decrease their business loans at banks and their commercial paper outstanding. The move out of commercial paper also reflected elevated credit spreads between high- and low-tier issuers resulting from the defaults of California utilities and several debt downgrades among prominent firms early in the year. Announcements of new equity share repurchase programs thinned considerably in the first half of the year, as firms sought to conserve their cash buffers in response to plummeting profits. A significant slowdown in cash-financed merger activity further damped equity retirements, although these retirements still outpaced gross equity issuance, which was restrained by falling share prices. Over the summer, issuance of investment-grade bonds dropped off appreciably. Moreover, market sentiment toward speculative-grade issues cooled, as further erosion in that sector's credit quality took its toll. Business loans and outstanding commercial paper continued to contract, and with share prices in the doldrums, nonfinancial firms raised only a small amount of funds in public equity markets in the third quarter.

The terrorist attacks on September 11 constricted corporate financing flows for a time. The stock market closed for that week, and trading in corporate bonds came to a virtual halt. After the shutdown of the stock market, the Securities and Exchange Commission, in an effort to ensure adequate liquidity, temporarily lifted some restrictions on firms' repurchases of their own shares. According to reports from dealers, this change triggered a spate of repurchases in the first few days after the stock markets reopened on September 17. When full-scale trading in corporate bonds resumed on September 17, credit spreads on corporate bonds widened sharply: Risk spreads on speculative-grade private debt soared to levels not seen since late 1991, and spreads on investment-grade corporate bonds also moved higher, although by a considerably smaller amount. Against this backdrop, junk bond issuance nearly dried up for the rest of the month. Commercial paper rates--even for top-tier issuers--jumped immediately after the attacks, as risk of payment delays increased. In response to elevated rates, some issuers tapped their backup lines at commercial banks, and business loans spiked in the weeks after the attacks. Risk spreads for low-tier borrowers in the commercial paper market remained elevated, even after market operations had largely recovered, because of ongoing concerns about credit quality and ratings downgrades among some high-profile issuers in the fall.

Chart of Spreads of corporate bond yields over the ten-year swap rate

Chart of Spread of low-tier CP rates over high-tier CP rates

By early October, the investment-grade corporate bond market had largely recovered from the disruptions associated with the terrorist attacks, and bond issuance in that segment of the market picked up considerably. Firms capitalized on relatively low longer-term interest rates to pay down short-term obligations, to refinance existing higher-coupon debt, and to boost their holdings of liquid assets. With high-yield bond risk spreads receding moderately, issuance in the speculative-grade segment of the corporate bond market stirred somewhat from its moribund state, although investors remained highly selective. Public equity issuance, after stalling in September, also regained some ground in the fourth quarter, spurred by a rebound in stock prices. As was the case for most of the year, initial public offerings and venture capital financing remained at depressed levels.

Commercial paper issuance recovered somewhat early in the fourth quarter as firms repaid bank loans made in the immediate aftermath of the terrorist attacks and as credit spreads for lower-rated issuers started to narrow. However, the collapse of the Enron Corporation combined with typical year-end pressures to widen quality spreads in early December. All told, the volume of domestic nonfinancial commercial paper outstanding shrank by one-third over the year as a whole. Business loans at banks fell further in the fourth quarter; for the year, business loans contracted 4-1/4 percent, their first annual decline since 1993.

The slowing of sales and the drop in profits caused corporate credit quality to deteriorate noticeably last year. In part because of the decline in market interest rates, the ratio of net interest payments to cash flow in the nonfinancial corporate sector moved only modestly above the relatively low levels of recent years, and most firms did not experience significant difficulties servicing their debt. However, many firms were downgraded, and evidence of financial distress mounted over the course of the year. The twelve-month trailing average of the default rate on corporate bonds nearly tripled last year and by December ran almost 1/2 percentage point higher than its peak in 1991. Delinquency rates on business loans at banks also rose, although not nearly as dramatically. The amount of nonfinancial debt downgraded by Moody's Investors Service last year was more than five times the amount upgraded; downgrades were especially pronounced in the fourth quarter, when ratings agencies lowered debt ratings of firms in the telecommunication, energy, and auto sectors.

Chart of Net interest payments of nonfinancial corporations 
relative to cash flow

Chart of Default rate on outstanding bonds

Commercial mortgage debt, supported by still-strong construction spending, expanded at a brisk 10 percent pace over the first half of 2001. The growth of commercial mortgage debt edged down only 1/2 percentage point in the second half, despite a sharp slowdown in business spending on nonresidential structures. As a result, the issuance of commercial-mortgage-backed securities (CMBS) maintained a robust pace throughout the year. Available data indicate some deterioration in the quality of commercial real estate credit. Delinquency rates on commercial real estate loans at banks rose steadily in 2001 and have started to edge out of their recent record-low range. In addition, CMBS delinquency rates increased, especially toward the end of the year, amid the rise in office vacancy rates. Despite the erosion in credit quality in commercial real estate and heavy issuance of CMBS, yield spreads on investment-grade CMBS over swap rates were about unchanged over the year, suggesting that investors view credit problems in this sector as being contained. Commercial banks, however, stiffened their lending posture in response to eroding prospects for the commercial real estate sector; significant net fractions of loan officers surveyed over the course of the year reported that their institutions had firmed standards on commercial real estate loans.

The Government Sector

Federal Government

Deteriorating economic conditions and new fiscal initiatives have led to smaller federal budget surpluses than had been anticipated earlier. The fiscal 2001 surplus on a unified basis was $127 billion, or about 1-1/4 percent of GDP--well below both the record $236 billion surplus recorded in fiscal 2000 and the $281 billion surplus that the Congressional Budget Office had anticipated for fiscal 2001 at this time last year. Receipts, which had increased at least 6 percent in each of the preceding seven fiscal years, declined around 2 percent in fiscal 2001; the rise in individual tax receipts slowed dramatically and corporate receipts plunged 27 percent. The lower receipts reflected both the weakening economy--specifically, slow growth of personal income, the drop in corporate profits, and a pattern of declines in equity values that led to lower net capital gains realizations--and changes associated with the Economic Growth and Tax Relief Reconciliation Act of 2001. Some provisions of the act went into effect immediately, including the rebate checks that were mailed last summer. In addition, the act shifted some corporate tax payments into fiscal 2002.

Chart of Federal receipts and expenditures

Meanwhile, outlays were up 4 percent in fiscal 2001; abstracting from a decline in net interest payments, outlays increased nearly 6 percent, a second year of increases larger than had prevailed for some time. Outlays have increased across all major categories of expenditure, including defense, Medicare and Medicaid, and social security. As for the part of federal spending that is counted in GDP, real federal outlays for consumption and gross investment increased somewhat more rapidly than in recent years through the first three quarters of 2001 as defense expenditures picked up. Spending rose faster still in the fourth quarter because of increases for homeland security and the additional costs associated with the war in Afghanistan.

Chart of Change in real government expenditures on 
consumption and investment

The existence of surpluses through fiscal 2001 meant that the federal government continued to contribute to the pool of national saving. Nevertheless, gross saving by households, businesses, and governments has been trending down over the past few years from the recent high of around 19 percent of GDP in 1998.

Chart of National saving

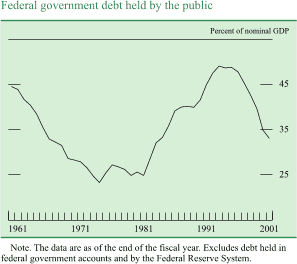
The Treasury used federal budget surpluses over the first half of the year to pay down its outstanding marketable debt. In the third quarter, however, the cut in personal income taxes and a weakening in receipts as the economy contracted led the Treasury to reenter the credit markets as a significant borrower of new funds. The Treasury's budget position swung back into surplus late in the year owing to somewhat stronger-than-expected tax receipts, which helped push fourth-quarter net borrowing below its third-quarter level. Despite the increase in the Treasury's net borrowing over the second half of the year, publicly held debt remained at only about one-third of nominal GDP last year, its lowest level since the mid-1980s and well below the 1993 peak of almost 50 percent.

Chart of Federal government debt held by the public

The terrorist attacks on September 11 and the associated disruptions to financial markets had some spillover effects on Treasury financing. On the day of the attacks, the Treasury cancelled its scheduled bill auction; over the next several days, it drew down nearly all of its compensating balances with commercial banks--about $12-1/2 billion in total--to meet its obligations. On Thursday of that week, the settlement of securities sold the day before the attacks eased the Treasury's immediate cash squeeze, and the incoming stream of estimated quarterly personal income tax payments provided additional funds. Infrastructure problems involving the trading and clearing of Treasury securities were largely resolved over the following week, and when the Treasury resumed its regular bill issuance on September 17, exceptionally strong demand for bills pushed stop-out rates--that is, the highest yield accepted during the auction--to their lowest level since 1961. Although the Treasury cancelled debt buybacks scheduled for late September to conserve cash, it later announced that buyback operations would begin again in October.

With its credit needs still limited, the Treasury announced on October 31 that it was suspending issuance of nominal and inflation-indexed thirty-year securities. Subsequently, the thirty-year Treasury bond yield fell sharply, bid-asked spreads on outstanding bonds widened, and liquidity in the bond sector deteriorated. Although bid-asked spreads narrowed over the balance of the year, market participants reported that liquidity in the bond sector remained below its level before the Treasury's announcement. The announcement on October 31 also indicated that after the January 2002 buyback operations, the Treasury would determine the amount and timing of buybacks on a quarter-by-quarter basis, thereby fueling speculation that future buybacks might be scaled back in light of the changed budget outlook.

State and Local Governments

Real expenditures for consumption and gross investment by states and localities rose 5 percent last year after an increase of 2-1/2 percent in 2000. Much of the acceleration reflected a burst of spending on construction of schools and other infrastructure needs. In addition, outlays at the end of last year were boosted by the cleanup from the September 11 attacks in New York. As for employment, state and local governments added jobs in 2001 at a more rapid pace than they did over the previous year and thereby helped to offset job losses in the private sector.

The fiscal condition of state and local governments has been strained by the deterioration in economic performance. State governments are considering a variety of actions to achieve budget balance in the current fiscal year. Most states are intending to cut planned expenditures, and many are considering drawing down rainy-day funds, which governments had built up in earlier years. According to the National Conference of State Legislators, these rainy-day funds stood at the relatively high level of $23 billion at the end of fiscal 2001 (June 30). Moreover, some states that had planned to fund capital expenditures with current receipts appear to be shifting to debt financing. Finally, a few states are considering actions such as postponing tax cuts that were enacted earlier.

Debt of the state and local government sector expanded rapidly last year after slow growth in 2000. Gross issuance of long-term municipal bonds accelerated over the first half of 2001 as state and local governments took advantage of lower yields to refund outstanding debt. Spurred by falling interest rates and declining tax revenues, these governments continued to issue long-term bonds to finance new capital projects at a rapid clip over the second half of the year. Despite a deterioration in tax receipts, credit quality in the municipal market remained high in 2001. Late in the year, however, signs of weakness had emerged, as the pace of net credit-ratings upgrades slowed noticeably. Especially significant problems continue to plague California and New York, both of which saw their debt ratings lowered in November. In California, the problems were attributed to declining tax revenues and difficulties related to the state's electricity crisis earlier in the year, while New York's slip in credit quality resulted not only from deteriorating tax receipts but also from fears of higher-than-expected costs related to clean up and rebuilding after the terrorist attacks.

The External Sector

Trade and the Current Account

The U.S. current account deficit narrowed significantly during 2001, with both imports and exports of goods and services falling sharply in response to a global weakening of economic activity. The deficit in goods and services narrowed to $333 billion at an annual rate in the fourth quarter of 2001 from $401 billion at the end of the previous year. In addition, the deficit was temporarily reduced further in the third quarter because service import payments were lowered by a large one-time estimated insurance payment from foreign insurers (reported on an accrual basis) related to the events of September 11.1  Excluding the estimated insurance figure, the current account deficit was $434 billion at an annual rate over the first three quarters of the year, or 4-1/4 percent of GDP, compared with $445 billion and 4-1/2 percent for the year 2000. Net investment income payments were about the same during the first three quarters of 2001 as in the corresponding period a year earlier; higher net payments on our growing net portfolio liability position were offset by higher net direct investment receipts.

Chart of U.S. current account

U.S. real exports were hit by slower growth abroad, continued appreciation of the dollar, and plunging global demand for high-tech products. Real exports of goods and services fell 11 percent over the four quarters of 2001, with double-digit declines beginning in the second quarter. Service receipts decreased 7 percent; all of the decline came after the events of September 11. Receipts from travel and passenger fares, which plunged following the terrorist attacks, were about one-fourth lower in the fourth quarter than in the second quarter. Receipts from foreigners for other services changed little over the year. Exports declined in almost all major goods categories, with the largest drops by far in high-tech capital goods and other machinery. Two exceptions were exports of automotive products, which rose during the second and third quarters (largely parts to Canada and Mexico destined ultimately for use in U.S. markets, and vehicles to Canada), and agricultural goods. About 45 percent of U.S. exports of goods were capital equipment; 20 percent were industrial supplies; and 5 percent to 10 percent each were agricultural, automotive, consumer, and other goods. The value of exported goods declined at double-digit rates for almost all major market destinations. Even exports to Canada and Mexico declined sharply, despite support from two-way trade with the United States in such sectors as automotive products.

Chart of Change in real imports and exports of goods and services

As growth of the U.S. economy slowed noticeably, real imports of goods and services turned down and declined 8 percent for 2001 as a whole. Service payments dropped 15 percent last year. The plunge in outlays for travel and passenger fares after September 11 held down total real service payments, bringing their level in the fourth quarter 15 percent below that in the second quarter. Spending on services other than travel and passenger fares changed little during the year.2  Imported goods fell 6 percent last year, with much of the decrease in capital goods (computers, semiconductors, and other machinery). In contrast, real imports of automotive products, consumer goods, oil, and other industrial supplies were little changed, and imports of foods rose. The pattern of import growth appears to have shifted toward the end of the year. Imports of real non-oil goods declined at about a 10 percent annual rate during the first three quarters of the year but fell less rapidly in the fourth quarter. The price of imported non-oil goods, after rising in the first quarter, declined at an annual rate of about 6 percent from the second quarter through the fourth quarter, led by decreases in the price of imported industrial supplies.

The value of imported oil fell more than one-third over the four quarters of 2001, a drop resulting almost entirely from a sharp decline in oil prices. The spot price of West Texas intermediate (WTI) crude decreased about $10 per barrel during the year, with much of the decline occurring after September 11. During the first eight months of 2001, the spot price of WTI averaged $28 per barrel as weakened demand for oil and increased non-OPEC supply were largely offset by OPEC production restraint. In the wake of the terrorist attacks, oil prices dropped sharply in response to a decline in jet fuel consumption, weaker economic activity, and reassurance from Saudi Arabia that supply would be forthcoming. Oil prices continued to drift lower during the fourth quarter, reflecting OPEC's apparent unwillingness to continue to sacrifice market share in order to defend higher oil prices. In late December, however, OPEC worked out an arrangement in which it agreed to reduce its production targets an additional 1.5 million barrels per day, contingent on the pledges from several non-OPEC producers (Angola, Mexico, Norway, Oman, and Russia) to reduce oil exports a total of 462,500 barrels per day. Given the uncertainty over the extent to which these reductions will actually be implemented and the comfortable level of oil inventories, the spot price of WTI remained near $20 per barrel in early 2002.

Chart of Prices of oil and of other commodities

Financial Account

The slowing of U.S. and foreign economic growth over the course of last year had noticeable effects on the composition of U.S. capital flows, especially when the slowing became more pronounced in the second half. On balance, net private capital flowed in at a pace only slightly below the record set in 2000, including unprecedented net inflows through private securities transactions.

During the first half of 2001, sagging stock prices and signs of slower growth brought a shift in the types of U.S. securities demanded by private foreigners but did not reduce the overall demand for them. Indeed, during the first half, foreign private purchases of U.S. securities averaged $137 billion per quarter, a rate well above the record $109 billion pace set in 2000. A slowing of foreign purchases of U.S. equities, relative to 2000, was more than offset by a pickup in foreign purchases of corporate and agency bonds. In addition, private foreigners, who had sold a significant quantity of Treasury securities during 2000, roughly halted their sales in the first half of 2001. The increased capital inflows arising from larger foreign purchases of U.S. securities in the first half was only partly offset by an increase in the pace at which U.S. residents acquired foreign securities, especially equities.

Chart of U.S. international securities transactions

The pattern of private securities transactions changed significantly in the third quarter: Foreign purchases of U.S. equities slowed markedly, and U.S. investors shifted from net purchases of foreign securities to net sales. However, the reduced flows in the third quarter seem to have reflected short-lived reactions to events in the quarter. Preliminary data for the fourth quarter show a significant bounceback in foreign purchases of U.S. securities and a return to purchases of foreign securities by U.S. residents.

The changing economic climate also affected direct investment capital flows. During 2000, foreign direct investment in the United States averaged more than $70 billion per quarter. These flows slowed to less than $60 billion per quarter in the first half and then dropped to only $26 billion in the third quarter (the last available data). The drop resulted in part from a decline in the outlook for corporate profits and a significant reduction in general merger and acquisition activity. By contrast, U.S. direct investment abroad picked up over the course of 2001. The third quarter outflow of $52 billion--a record--reflected both a large merger and robust retained earnings by the foreign affiliates of U.S. firms. Capital inflows from official sources were relatively modest in 2001, totaling only $15 billion, compared with $36 billion in 2000.

The Labor Market

Employment and Unemployment

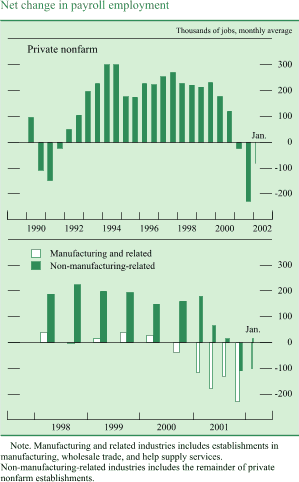
Last year's weakening in economic activity took its toll on the labor market. Payroll employment edged up early last year and then dropped nearly 1-1/2 million by January 2002. Declines were particularly large in manufacturing, which has shed one in twelve jobs since mid-2000. Job cuts accelerated in the months following the terrorist attacks of September 11, with declines occurring in a wide variety of industries. The unemployment rate moved up from 4 percent in late 2000 to 5.8 percent by December 2001. In January 2002, the unemployment rate edged down to 5.6 percent.

Chart of Measures of labor utilization

Early last year, employment in manufacturing, which had been trending down for several years, began to decline more rapidly. Job losses were widespread within the manufacturing sector but were most pronounced in durable-goods industries, such as those producing electrical and industrial machinery and metals. Employment at help supply firms and in wholesale trade--industries that are directly related to manufacturing--also began to decline. Outside of manufacturing and its related industries, private payrolls continued to increase robustly in the first quarter of last year, but hiring then slowed, although it remained positive, on net, in the second and third quarters. Construction payrolls increased into the spring but flattened out thereafter. Employment at retail trade establishments also continued to increase moderately through the spring but began to decline in the late summer. In services industries other than help supply firms--a broad group that accounted for nearly half of the private payroll increases over the preceding several years--job gains slowed but remained positive in the second and third quarters of last year. In all, private payroll employment declined about 115,000 per month in the second and third quarters, and the unemployment rate moved up steadily to 4-1/2 percent by the spring and to nearly 5 percent by August.

Chart of Net change in payroll employment

The labor market was especially hard hit by the terrorist attacks. Although labor demand was weak prior to the attacks, the situation turned far worse following the events of September 11, and private payrolls plunged more than 400,000 per month on average in October and November. Employment fell substantially not only in manufacturing and in industries directly affected by the attacks, such as air transportation, hotels, and restaurants, but also in a wide variety of other industries such as construction and much of the retail sector.

Employment continued to decline in December and January but much less than in the preceding two months. Manufacturing and its related industries lost jobs at a slower pace, and employment leveled off in other private industries. The unemployment rate moved up to 5.8 percent in December but then ticked down to 5.6 percent in January. The recent reversal of the October and November spikes in new claims for unemployment insurance and in the level of insured unemployment also point to some improvement in labor market conditions early this year.

Productivity and Labor Costs

Given economic conditions, growth of labor productivity was impressive in 2001. Productivity growth typically drops when the economy softens, partly because businesses tend not to shed workers in proportion to reduced demand. Last year, however, output per hour in the nonfarm business sector increased a relatively solid 1-1/2 percent, according to the advance estimate, after having risen 2-1/2 percent in 2000--a mild deceleration by past cyclical standards. Indeed, productivity is estimated to have increased at an annual rate of more than 2 percent in the second half of the year, an impressive performance during a period when real GDP was, on net, contracting. The buoyancy of productivity during 2001 provides further support to the view that the underlying trend of productivity growth has stepped up notably in recent years.

Chart of Change in output per hour

Hourly labor compensation costs increased more slowly last year than in 2000, although different compensation measures paint different pictures of the magnitude of that deceleration. The slowing likely reflected the influence of the soft labor market, energy-driven declines in price inflation toward the latter part of the year, and subdued inflation expectations. Compensation probably was also held down by a reduction in variable pay, such as bonuses that are tied to company performance and stock-option activity.

Chart of Measures of the change in hourly compensation

According to the employment cost index, hourly compensation costs increased 4-1/4 percent during 2001, down from a 4-1/2 percent increase in 2000; both the wages and salaries and benefits components recorded slightly smaller increases. The deceleration in the index for wages and salaries was concentrated among sales workers, whose wages often include a substantial commission component and so are especially sensitive to cyclical developments. Although the increase in employers' cost of benefits slowed overall, the cost of providing health insurance increased more than 9 percent last year; the rise continued this component's accelerating contribution to labor costs over the past few years after a period of restrained cost increases in the mid-1990s.

An alternative measure of hourly compensation is the BLS's measure of compensation per hour in the nonfarm business sector, which is derived from compensation information in the national accounts; this measure increased 4 percent last year, a very large drop from the 7-3/4 percent increase registered in 2000. One reason that these two compensation measures may diverge is that only nonfarm compensation per hour captures the cost of stock options. Although the two compensation measures differ in numerous other respects as well, the much sharper deceleration in nonfarm compensation per hour may indicate that stock option exercises leveled off or declined in 2001 in response to the fall in equity values. However, because nonfarm compensation per hour can be revised substantially, one must be cautious in interpreting the most recent quarterly figures from this series.

Unit labor costs, the ratio of hourly compensation to output per hour in the nonfarm business sector, increased about 2 percent last year. Although down from a huge 5 percent increase in 2000 that reflected that year's surge in nonfarm compensation per hour, the figure for 2001 is still a little higher than the moderate increases seen over the preceding several years. Last year's increase in unit labor costs was held up by the smaller productivity increases that accompanied weak economic activity; accordingly, subsequent increases in unit labor costs would be held down if output per hour begins to increase more rapidly as the economy strengthens.

Chart of Change in unit labor costs

Prices

Inflation declined in 2001 largely because of a steep drop in energy prices. The chain-type price index for personal consumption expenditures (PCE) increased 1.3 percent last year after having increased 2.6 percent in 2000; the turnaround in consumer energy prices accounted for almost all of that deceleration. Increases in PCE prices excluding food and energy items also slowed a little last year after having moved up in 2000. The chain-type price index for gross domestic purchases--the broadest price measure for domestically purchased goods and services--decelerated considerably last year. The small increase in this index reflected both the drop in energy prices and a resumption of rapid declines for prices of investment goods, especially computers, following a period of unusual firmness in 2000. The price index for GDP--the broadest price measure for domestically produced goods and services--posted a smaller deceleration of about 1/2 percentage point between 2000 and 2001 because lower oil prices have a smaller weight in U.S. production than in U.S. purchases.

Chart of Change in consumer prices

Consumer energy prices continued to move higher through the early months of 2001 before turning down sharply in the second half of the year. Despite the fact that crude oil prices were declining over the first half of the year, retail gasoline prices increased at an annual rate of 8 percent during that period. The sizable increase in margins on gasoline reflected both refinery disruptions and low inventory levels going into the summer driving season. But gasoline prices fell sharply thereafter as refineries came back on line, imports of gasoline picked up, and crude oil prices moved considerably lower over the latter half of the year. In all, gasoline prices were down 19 percent over the year as a whole. Heating oil prices reflected crude oil developments more directly and declined sharply through most of the year. Meanwhile, spot prices of natural gas peaked in January 2001 at the extraordinarily high level of nearly $10 per million BTUs, and prices at the consumer level continued to surge in the first few months of the year. These increases reflected the pressure from ongoing strength in demand coupled with unusually cold weather early last winter that left stocks at very low levels. But the situation improved as expanded supply allowed stocks to be replenished: Spot prices reversed those earlier increases, and prices of consumer natural gas declined substantially through the rest of the year.

Chart of Change in consumer prices excluding food and energy

In contrast, electricity prices rose through most of last year. The increases reflected the effects of the earlier rises in the prices of natural gas and coal on fuel costs of utilities as well as problems with electricity generation in California. California was able to avoid serious power disruptions last summer because high electricity prices, weak economic activity, and moderate weather all helped keep demand in check.

Alternative measures of price change
Percent  
Chart of table rule
Price measure
2000
2001
Chain-type
   
Gross domestic product
2.4 1.8
Gross domestic purchases
2.5 1.1
Personal consumption expenditures 2.6 1.3
    Excluding food and energy
1.9 1.6
Fixed-weight
   
Consumer price index
3.4 1.9
    Excluding food and energy
2.5 2.7
Chart of table rule

          Note.  Changes are based on quarterly averages and are
measured to the fourth quarter of the year indicated from the
fourth quarter of the preceding year.
 

Consumer food prices increased more rapidly last year, rising about 3 percent after having risen only 2-1/2 percent in 2000. Early in the year, strong demand, both domestic and foreign, led to large increases in livestock prices--especially beef. But these prices softened later in the year under the influence of higher supplies, lower domestic demand, and foreign outbreaks of mad cow disease, which apparently damped demand for beef no matter where produced.

Excluding food and energy items, PCE prices rose 1.6 percent last year, a small deceleration from its 1.9 percent increase over 2000. That deceleration was concentrated in prices of goods, with prices especially soft for motor vehicles and apparel. By contrast, prices of many services continued to accelerate last year. In particular, shelter costs--which include residential rent, the imputed rent of owner-occupied housing, and hotel and motel prices--increased 4-1/4 percent last year after having risen 3-1/2 percent in 2000.

Standing somewhat in contrast to the small deceleration in core PCE prices, the core consumer price index (CPI) increased 2-3/4 percent last year, about the same rate as in 2000. Although components of the CPI are key inputs of the PCE price index, the two price measures differ in a variety of ways. One important difference is that the PCE measure is broader in scope; it includes expenditures made by nonprofit institutions and consumption of items such as checking services that banks provide without explicit charge. Prices for the PCE categories that are outside the scope of the CPI decelerated notably in 2001 and accounted for much of the differential movements of inflation measured by the two price indexes. Another difference is that the CPI places a larger weight on housing than does the PCE price index, and last year's acceleration of housing prices therefore boosted the CPI relative to the PCE measure.

The leveling off or decline in core consumer price inflation reflects a variety of factors, including the weakening of economic activity and the accompanying slackening of resource utilization; the decline in energy prices that reduced firms' costs; and continuing intense competitive pressures in product markets. These factors also likely helped to reduce inflation expectations late last year, and this reduction itself may be contributing to lower inflation. According to the Michigan SRC, median one-year inflation expectations, which had held near 3 percent through 2000 and into last summer, moved down to 2-3/4 percent in the third quarter and plummeted to 1 percent or lower in October and November. Falling energy prices and widespread reports of discounting following the September 11 attacks likely played a role in causing this sharp break in expectations. Part of this drop was reversed in December, and since then, inflation expectations have remained around 2 percent--a rate still well below the levels that had prevailed earlier. Meanwhile, the Michigan SRC's measure of longer-term inflation expectations, which had also remained close to 3 percent through 2000 and the first half of 2001, ticked down to 2-3/4 percent in October and stood at that level early this year.

U.S. Financial Markets

As a consequence of the Federal Reserve's aggressive easing of the stance of monetary policy in 2001, interest rates on short- and intermediate-term Treasury securities fell substantially over the course of the year. Longer-term Treasury bond yields, however, ended the year about unchanged, on balance. These rates had already fallen appreciably in late 2000 in anticipation of monetary policy easing. They may also have been held up last year by an increased likelihood of federal budget deficits and, except in the immediate aftermath of the terrorist attacks, by investors' optimism about future economic prospects. Despite this optimism, the slowdown in final demand, a slump in corporate earnings, and a marked deterioration in credit quality of businesses in a number of sectors made investors more wary about risk. Although interest rates on higher-rated investment-grade corporate bonds generally moved in line with those on comparably dated government securities, lower-rated firms found credit to be considerably more expensive, as risk spreads on speculative-grade debt soared for most of the year before narrowing somewhat over the last few months. Interest rates on commercial paper and business loans fell last year by about as much as the federal funds rate, but risk spreads generally remained in the elevated range. In addition, commercial banks tightened standards and terms for business borrowers throughout the year. Equity prices were exceptionally volatile and fell further, on balance, in 2001.

Increased caution on the part of lenders did not appear to materially damp aggregate credit flows. Private borrowing was robust last year, especially when compared with the marked slowing in nominal spending. Relatively low long-term interest rates encouraged both businesses and households to concentrate borrowing in longer-term instruments, thereby locking in lower debt-service obligations. The proceeds of long-term borrowing were also used to strengthen balance sheets by building stocks of liquid assets. A shift toward safer and more liquid asset holdings showed through in rapid growth of M2, which was spurred further by reduced short-term market interest rates and elevated stock market volatility.

Interest Rates

Short-term market interest rates moved down with the FOMC's cumulative cut in the target federal funds rate of 4-3/4 percentage points, and yields on intermediate-term Treasury securities declined almost 2 percentage points. Longer-term interest rates had already fallen in the latter part of 2000, when investors began to anticipate significant policy easing in response to weakening economic growth. As the FOMC aggressively eased the stance of monetary policy during the winter and spring, investors' expectations of a prompt revival in economic activity took hold and were manifested in a sharp upward tilt of money market futures rates and an appreciable rise in longer-term interest rates over the second quarter. However, signs of the anticipated economic turnaround failed to materialize as the summer progressed. Indeed, the weakening in economic activity was becoming more widespread, which prompted expectations of further monetary policy easing over the near term, and longer-term interest rates turned down again.

Chart of Rates on selected Treasury securities

The terrorist attacks of September 11 dramatically redrew the picture of the nation's near-term economic prospects. Market participants lowered markedly their expected trajectory for the path of the federal funds rate in the immediate aftermath of the attacks, and revisions to policy expectations, combined with considerable flight-to-safety demands, cut short- and intermediate-term Treasury yields substantially over subsequent days. The FOMC, confronted with evidence of additional weakness in final demand and prices, eased policy further over the balance of the year, and short-term market interest rates continued to decline. In early November, however, intermediate- and long-term interest rates turned up, as it became apparent that the economic fallout from the attacks would be more limited than some had originally feared, and as military success in Afghanistan bolstered investors' confidence and moderated safe-haven demands. By the end of the year, yields on intermediate-term Treasury securities had reversed about half of their post-September 11 decline, while yields on longer-term Treasury securities had risen enough to top their pre-attack levels. In early 2002, however, yields on intermediate- and longer-term Treasuries edged down again, as market participants trimmed their expectations for the strength of the economic rebound, and the Congress failed to move forward with additional fiscal stimulus.

Yields on higher quality investment-grade corporate bonds generally followed those on comparably dated Treasury securities last year, although risk spreads widened moderately before narrowing over the last few months. In contrast, interest rates on speculative-grade corporate debt increased steadily in 2001, as risk spreads ballooned in response to mounting signs of financial distress among weaker firms. Even with a considerable narrowing over the final two months of the year, risk spreads on below-investment-grade bonds remained quite wide. Spreads for high-yield bonds edged down further in 2002 after rising sharply in early January, when several important technology and telecommunications companies revised down their earnings forecasts or released corrections to past earnings statements. Interest rates on commercial and industrial (C&I) loans at banks fell last year by about as much as the federal funds rate. According to the Federal Reserve's quarterly Survey of Terms of Business Lending, the spread over the target federal funds rate of the average interest rate on C&I loans varied somewhat over the year, falling for a while then rising sharply between August and November; nonetheless, it has generally remained in the elevated range that has persisted since late 1998. The same survey also indicated that over the course of last year commercial banks, like other lenders, have become especially cautious about lending to marginal credits, as indicated by the average spread on riskier C&I loans not made under a previous commitment, which soared in 2001.

Chart of Corporate bond yields

Chart of Spread of average business loan rate over the intended 
federal funds rate

Equity Markets

The exceptional volatility of equity prices in 2001 likely reflected the dramatic fluctuations in investors' assessment of the outlook for the economy and corporate earnings. Share prices tumbled early last year, as pessimism and uncertainty about the direction of the economy were intensified by a spate of negative earnings announcements and profit warnings in February and March. The pronounced sell-off of equities came to a halt at the end of the first quarter, with the Wilshire 5000--a very broad index of stock prices--down about 13 percent, while the tech-heavy Nasdaq ended the first quarter at its lowest level since 1998 and more than 60 percent below its record high reached in March of 2000.

Chart of Major stock price indexes

Companies, especially in the technology sector, reported weak profits for the first quarter, but their announcements generally surpassed analysts' sharply lowered expectations. With the 1 percentage point reduction in the federal funds rate over March and April, investors became more confident that an improvement in economic conditions was in train, and equity prices rallied; the rebound was particularly strong for technology companies--the Nasdaq rose almost 40 percent between April and the end of May. The forward momentum in equity markets was checked in June, however, in part because analysts slashed their estimates for near-term corporate earnings growth. Although the stock market initially proved resilient in the face of the bleak profit news, suggesting that weak earnings had been largely anticipated by investors, the steady barrage of dismal economic news--particularly in the technology and telecommunications sectors--started to exert downward pressure on share prices by early August. The slide in stock prices intensified in early September, with technology stocks taking an exceptional drubbing. By September 10, the Wilshire 5000 was down almost 10 percent from the end of July, while the Nasdaq had lost more than 16 percent.

The attacks on September 11, a Tuesday, caused stock markets to shut down and to remain closed for the rest of that week. Trading resumed in an orderly fashion on Monday, September 17, but the day ended with the market as a whole down about 5 percent--with airline and hotel stocks pounded most--and trading volume on the New York Stock Exchange hitting a record high. Major stock price indexes, which sagged further in subsequent days and weeks, were weighed down by investors' more pessimistic evaluation of the near-term economic outlook and by sizable downward revisions to analysts' earnings projections for the rest of 2001. By the third week of the month, broad stock price indexes had fallen a total of 12 percent from their levels on September 10.

In late September, stock prices staged a comeback that lasted through the fourth quarter, as incoming information suggested that the economy had proven remarkably resilient and economic prospects were improving. On the perception that the worst for the technology sector would soon pass, share prices of firms in technology industries jumped sharply, lifting the Nasdaq more than 35 percent from its September nadir. On balance, last year's gyrations in stock prices left the Wilshire 5000 down about 10 percent, while the Nasdaq fell 20 percent. The widespread decline in equity prices through the first three quarters of 2001 is estimated to have wiped out nearly $3-1/2 trillion in household wealth, translating into 8-1/4 percent of total household net worth. Of this total, however, about $1-1/4 trillion was restored by the stock market rally in the fourth quarter. Moreover, the level of household net worth at the end of last year was still almost 50 percent higher than it was at the end of 1995, when stepped-up productivity gains had begun to induce investors to boost significantly their expectations of long-term earnings growth. In January and early February of 2002, investors reacted to generally disappointing news about expected earnings, especially in the telecommunications sector, and to concerns about corporate accounting practices by erasing some of the fourth-quarter gain in equity prices. Despite this decline, the price-earnings ratio for the S&P 500 index (calculated using operating earnings expected over the next year) remained close to its level at the beginning of 2001. The relatively elevated ratio reflected lower market interest rates as well as investor anticipation of a return to robust earnings growth.

Chart of Price-earnings ratios for the S and P 500

Debt and Depository Intermediation

The growth of the debt of nonfederal sectors was strong over the first half of the year, as the decline in longer-term interest rates during the final months of 2000 prompted some opportunistic tapping of bond markets by businesses and helped keep the expansion of household credit brisk. However, the combination of a stepdown in the growth of consumer durables purchases, a further drop in capital expenditures, and a substantial inventory liquidation over the second half of the year resulted in a significantly slower pace of private borrowing. On balance, growth of nonfederal debt retreated about 1 percentage point in 2001, to 7-1/2 percent. Federal debt continued to contract early last year; it then turned up as the budget fell into a deficit reflecting the implementation of the tax cut, the effect of the weaker economy on tax receipts, and emergency spending in the wake of the terrorist attacks. As a result, the federal government paid down only 1-1/4 percent of its debt, on net, over 2001, compared with 6-3/4 percent in the previous year. With nominal GDP decelerating sharply, the ratio of nonfinancial debt to GDP moved up notably in 2001, more than reversing its decrease in the previous year.

Chart of Growth of nonfinancial debt

The economic slowdown and the decline in market interest rates last year left a noticeable imprint on the composition of financial flows, with borrowing by businesses and households migrating toward longer-term bond and mortgage markets. As a consequence, credit at depository institutions expanded sluggishly over the year. Growth of loans at commercial banks dropped off sharply, from 12 percent in 2000 to 2-1/4 percent in 2001. The slowdown in total bank credit--after adjustments for mark-to-market accounting rules--was less severe, because banks acquired securities, largely mortgage-backed securities, at a brisk pace throughout the year. A healthy banking sector served as an important safety valve for several weeks after September 11, as businesses tapped backup lines of credit to overcome problems associated with the repayment of maturing commercial paper and issuance of new paper. Moreover, with payment flows temporarily interrupted by the terrorist attacks, a substantial volume of overdrafts was created, causing a spike in the "other" loan category that includes loans to depository institutions. By the end of October, however, the disruptions to business financing patterns and payment systems that bloated bank balance sheets had largely dissipated, and loans contracted sharply.

Commercial banks reported a marked deterioration in loan performance last year. Delinquency and charge-off rates on C&I loans trended up appreciably, although they remained well below rates recorded during the 1990-91 recession. Delinquency rates on credit card accounts increased for the second year in a row, reaching 5 percent for the first time since early 1992. Banks responded to the deteriorating business and household balance sheets by tightening credit standards and terms for both types of loan, according to the Federal Reserve's Senior Loan Officer Opinion Survey on Bank Lending Practices. Banks indicated that they had tightened business lending policies in response to greater uncertainty about the economic outlook and their reduced tolerance for risk. Similarly, the net fractions of banks reporting that they had tightened standards for both credit card and other consumer loans rose markedly over the first half of last year. As household financial conditions continued to slip, the net proportion of banks that tightened standards on consumer loans remained at an elevated level in the second half of the year.

Chart of Delinquency rates on commercial and industrial and 
credit card loans at banks

Chart of Net percentage of domestic banks tightening standards on 
credit card and selected commercial and industrial loans

In response to rising levels of delinquent and charged-off loans, commercial banks significantly boosted the rate of provisioning for loan losses last year, which, along with reduced income from capital market activities, cut into the banking sector's profits. Nonetheless, through the third quarter of 2001--the latest period for which Call Report data are available--measures of industry profitability remained near the elevated range recorded for the past several years, and banks continued to hold substantial capital to absorb losses. Indeed, virtually all assets were at well-capitalized banks at the end of the third quarter, and the substitution of securities for loans on banks' balance sheets also helped edge up risk-based capital ratios. In the fourth quarter, a number of large banks saw their profits decline further because of their exposure to Enron and, to a lesser extent, Argentina. On the positive side, wider net interest margins helped support profits throughout 2001.

Chart of Percent of all U.S. commercial bank assets 
at well-capitalized banks

The Monetary Aggregates

The broad monetary aggregates grew very rapidly in 2001. Over the four quarters of the year, M2 increased 10-1/4 percent, a rate significantly above the pace of the past several years. Because the rates of return provided by many components of M2 move sluggishly, the swift decline in short-term market interest rates last year significantly lowered the opportunity cost of holding M2 assets, especially for its liquid deposits (the sum of checking and savings accounts) and retail money funds components. Moreover, negative returns and elevated volatility in equity markets likely raised household demand for M2 assets through the fall. An unprecedented level of mortgage refinancing activity (which results in prepayments that temporarily accumulate in deposit accounts before being distributed to investors in mortgage-backed securities), as well as increased foreign demand for U.S. currency, also bolstered the growth of M2 over the course of the year.

Chart of M2 growth rate

Involuntary accumulation of liquid deposits resulting from payment system disruptions after the terrorist attacks, combined with elevated safe-haven demands, caused M2 to surge temporarily in the weeks following September 11. At the same time, plunging equity prices led to a sharp step-up in the growth of retail money market mutual funds. After a substantial unwinding of distortions to money flows in October, M2 growth over the balance of the year was spurred by further declines in its opportunity cost resulting from additional monetary policy easings and by heightened volatility in equity markets. The hefty advance in M2 last year outpaced the anemic expansion of nominal income, and M2 velocity--the ratio of nominal GDP to M2--posted a record decline.

Chart of M2 velocity and opportunity cost

M3--the broadest monetary aggregate--grew 13 percent over 2001. In addition to the surge in its M2 component, huge inflows into institutional money funds boosted M3 growth. Investors' appetite for these instruments was enormous last year because their returns were unusually attractive as they lagged the steep decline in market interest rates. The slow-down in the growth of bank credit over the summer, which resulted in a contraction in managed liabilities, damped the rise in M3 somewhat. The velocity of M3 dropped for the seventh year in the row, to a record low.

Chart of M3 growth rate

International Developments

Economic activity in foreign economies weakened substantially in 2001. Early in the year, activity abroad was depressed by high oil prices, the global slump in the high-tech sector, and spillover from the U.S. economic slowdown. The September terrorist attacks further heightened economic uncertainty. On average, foreign economic activity was about flat over the year. The weakest performer among industrial economies was Japan, where output declined. The euro area eked out a slight increase in its real GDP. Activity in most emerging market economies in both Asia and Latin America declined. Asian developing economies were particularly hard hit by the falloff in demand for their high-tech exports. In Latin America, the output decline in Mexico largely reflected sharply reduced export demand from the United States; Argentina's financial crisis precipitated a further sharp drop in output in that country. An easing of average foreign inflation reflected the weakness of activity as well as a net decline in global oil prices over the course of the year.

In response to the pronounced weakness in economic activity, monetary authorities in the major industrial countries eased policy throughout the year. Nevertheless, interest rates on long-term government securities showed little net change from the beginning to the end of the year in most major industrial countries. Weak economic conditions tended to put downward pressure on long-term rates, but moves toward more stimulative macroeconomic policies appeared to encourage market participants to expect economic recovery, thereby supporting long-term interest rates. Following the terrorist attacks in September, interest rates declined around the globe as expected economic activity weakened and demand shifted away from equities and toward the relative safety of bonds. However, toward year-end, as the period of crisis passed, long-term interest rates rebounded strongly.

Chart of Foreign equity indexes

Overall stock indexes in foreign industrial economies declined for the second consecutive year as activity faltered and actual and projected corporate earnings fell sharply. Technology-oriented stock indexes again fell more than the overall indexes. Among emerging market economies, the performance of stocks was mixed; stock indexes in several Asian emerging market economies rebounded strongly late in the year, a move possibly reflecting market participants' hopes for a revival in global demand for the high technology products that feature prominently in these countries' exports. Argentine financial markets came under increasing pressure throughout the year because of growing fears of a debt default and the end of the peso's peg to the dollar. Near year-end, Argentine authorities in fact suspended debt payments to the private sector and, early in 2002, ended the one-to-one peg to the dollar. There was limited negative spillover to other emerging financial markets from the sharp deterioration in Argentina's economic and financial condition, in contrast to the situation that prevailed during other emerging market financial crises of recent years.

The dollar's average foreign exchange value remained strong through most of 2001. The dollar continued to rise despite mounting evidence of weakening U.S. economic activity and the significant easing of monetary policy by the FOMC. Market participants may have felt that the falloff in economic growth in foreign economies and expectations that the United States offered stronger prospects for economic growth in the future outweighed disappointing U.S. economic performance in the near term. The dollar's average foreign exchange value against the currencies of other major industrial countries recorded a net increase of 8 percent over 2001 as a whole. The dollar also strengthened, but by a lesser amount, against the currencies of our most important developing country trading partners. So far this year, the dollar's average value has risen further on balance.

Chart of Nominal U.S. dollar exchange rate indexes

Industrial Economies

The dollar showed particular strength against the Japanese yen last year, appreciating nearly 15 percent. The weakness of the yen reflected serious ongoing structural problems and the relapse of the Japanese economy back into recession. Early in the year, in response to signs of renewed weakening of the economy, the Bank of Japan announced that it was easing policy by shifting its operating target from the overnight rate--already not far above zero--to balances held by financial institutions at the Bank of Japan. Policy was eased further and more liquidity was injected into the banking system when the balances target was raised three times later in the year.The yen received a temporary boost when Junichiro Koizumi, widely seen as more likely to introduce economic reforms, became prime minister in April. The yen again strengthened in the immediate wake of the September terrorist attacks, prompting the Bank of Japan to make substantial intervention sales of yen. However, later in the year, amid signs of a renewed deterioration of economic conditions, the yen again started to weaken significantly.

Chart of U.S. dollar exchange rate against the euro 
and the Japanese yen

For the year as a whole, Japanese real GDP is estimated to have declined more than 1 percent, a reversal of the rebound recorded the previous year. Private investment declined and private consumption moved lower, as households curtailed spending in the face of rising unemployment and falling real income. The winding-down of the large-scale public works programs of recent years more than offset the effect on growth from the additional spending contained in several supplemental budgets. Last year marked the third consecutive year of deflation, with the prices of both consumer goods and real estate continuing to move lower.

The dollar's movements against the euro in 2001 appear to have been mainly influenced by market perceptions of the strength of economic activity in the United States relative to that in the euro area. In the early part of the year, the euro weakened as evidence mounted that the economic slowdown that was already apparent in the United States as the year began was also taking hold in Europe. During the summer, the euro rose against the dollar as market participants appeared to revise downward their expectation of an early U.S. recovery. Then, later in the year, with more signs of a further weakening of activity in Europe, the euro again declined. On balance, the dollar appreciated more than 5 percent relative to the euro over the course of the year. Real GDP in the euro area is estimated to have increased at less than a 1 percent rate in 2001, a sharp slowing from the nearly 3 percent growth rate of the previous year. Fixed investment and inventory investment both are estimated to have made negative contributions to the growth of real GDP, whereas consumption growth remained near the rate of the previous year. The slowing of growth in the euro area was not uniform across countries, with weakness being more pronounced in Germany and less so in France.

The European Central Bank (ECB) held off easing monetary policy in the early months of the year, restrained by the euro's weakness, growth of M3 that remained in excess of the ECB's reference value, and a euro-area inflation rate above its 2 percent target ceiling. In May, evidence of slowing activity prompted the ECB to reduce its key policy rate 25 basis points. Three additional reductions followed later in the year, as activity weakened further and the inflation rate receded toward its target ceiling. The total reduction in the ECB's key policy rate over the course of the year was 150 basis points. The beginning of 2002 saw the introduction of euro notes and coins, a process that proceeded smoothly.

The dollar appreciated 6 percent against the Canadian dollar in 2001 as the Canadian economy slowed abruptly. Real GDP in Canada is estimated to have been about flat last year after growing more than 3 percent in 2000. A key factor in this slowing was the sharp drop-off in Canadian exports to the United States. An inventory correction also depressed output. Earlier in the year, consumption was buoyed by continued employment growth, tax cuts, and a housing boom. However, later in the year, growth of consumption faltered as employment prospects worsened and asset prices weakened. The Bank of Canada has moved aggressively to counter the slowing of economic activity by lowering its key policy interest rate nine times in 2001 and once in January 2002 for a cumulative total of 375 basis points.3  When the Bank of Canada initiated easing moves early in 2001, inflation was slightly above the Bank's target range of 1 percent to 3 percent; but by the end of the year, slack activity and falling energy prices had pushed the inflation rate down to near the bottom of the range.

Emerging Market Economies

Argentina was a main focus of attention among emerging market economies in 2001. In the first part of the year, worse-than-expected data on the fiscal situation and concerns that the government would be unable to implement announced fiscal measures heightened doubts about whether Argentina would be able to avoid a default on its debt. Argentine financial markets received only temporary support from a large-scale debt exchange completed in June and an enhancement of IMF support approved in September. With financial market confidence eroding, conditions took a dramatic turn for the worse late in the year; financial asset prices fell sharply, and funds moved out of the banking system as the government moved to restructure its debt and the one-to-one peg to the dollar looked increasingly precarious. In early December, the government imposed capital controls, including limits on bank account withdrawals. These restrictions led to widespread protests, which triggered the resignation of President de la Rua and an interval of political turmoil. After the resignation of President de la Rua, the government announced it would suspend debt payments to the private sector. The government of the new president, Eduardo Duhalde, suspended Argentina's currency board arrangement and established a temporary dual exchange rate system. In early February, the dual exchange rate system was abandoned, and the peso's floating rate moved to about 2 pesos per dollar amid continuing economic uncertainty. For 2001 as a whole, Argentine real GDP is estimated to have fallen at well over a 5 percent rate, and prices declined further.

Chart of Selected emerging markets

To date, the negative spillover from events in Argentina to other emerging financial markets has been limited, possibly because market participants had been well aware of Argentina's problems for some time and viewed them as largely confined to that country. Brazil was probably most heavily affected by events in Argentina, and the bond spread on Brazilian debt showed a net increase of about 110 basis points over the course of last year while the spread on Argentina debt exploded upward. Other important factors weighing on Brazilian economic activity last year likely were weak growth in the United States--Brazil's most important export market--and the emergence of an energy shortage as drought limited hydroelectric output. For the year as a whole, Brazilian real GDP is estimated to have risen at less than a 1 percent rate after growing at a 4 percent rate the previous two years. The Brazilian currency registered a net depreciation against the dollar of about 16 percent over the course of last year, while stock prices declined more than 10 percent. The Brazilian central bank tightened policy last year in an effort to hold down the inflationary impact of currency depreciation.

Real GDP in Mexico declined about 1 percent in 2001, a sharp reversal from the 5 percent growth rates recorded in the previous two years. The falloff in activity was mainly a reflection of the negative effects on direct trade and confidence in Mexico arising from the slowdown of the U.S. economy. In light of the marked weakening of activity, declining inflation, and a strong peso, the Bank of Mexico started to loosen the stance of monetary policy in May, and short-term interest rates continued to decline over the rest of the year. In February 2002, the Bank of Mexico moved to tighten monetary conditions, citing concerns that an increase in administered prices would raise inflation. Mexican financial markets fared quite well last year, with the peso appreciating 5 percent against the dollar and stock prices rising nearly 15 percent. The effect on Mexican financial markets from Argentina's difficulties appeared to have been quite limited, as indicated by the net decline of the Mexican debt spread by 80 basis points over the course of the year.

Economic growth in the Asian emerging market economies turned negative last year. On average, real GDP in developing Asia is estimated to have declined about 1 percent in 2001, compared with average growth of 6 percent in the previous year. A key factor in this slowing was the sharp falloff in global demand for the high-tech products that had fueled rapid export growth in the region in recent years.

The economies of Taiwan, Singapore, and Malaysia are highly dependent on exports of semiconductors and other high-tech products, and as global demand for these goods was cut back sharply, real GDP in these countries declined by an estimated 5 percent on average last year. Indonesia and Thailand, both relatively less dependent on high-tech exports and experiencing some reduction in political tension over the course of the year, managed to record small positive real GDP growth rates last year, albeit well below rates of the previous year.

Korean real GDP is estimated to have increased about 2 percent in 2001. While in an absolute sense Korea is an important exporter of high-tech products such as semiconductors, it has a relatively more diversified economy than most of its Asian neighbors, and thus the magnitude of its slowdown last year was somewhat muted. Government moves toward monetary and fiscal policy stimulus over the course of the year helped support domestic demand in Korea.

In China, recorded growth of real GDP remained robust last year. China's lesser dependency on exports in general, and high-tech exports in particular, cushioned it from last year's global slowdown, and the government stepped up the pace of fiscal stimulus to offset weakening private demand. Hong Kong, with exports not heavily concentrated in high-tech goods and an economy closely integrated with a rapidly growing Chinese economy, is nevertheless estimated to have experienced a decline in real GDP last year. The peg of Hong Kong's currency to a strengthening U.S. dollar put pressure on its competitive position, and domestic price deflation continued.

Conditions in financial markets in emerging Asia were, for the most part, not particularly volatile last year. Debt spreads were little changed on average for the region as a whole, exchange rates against the dollar generally moved lower, and stock indexes declined somewhat on average.


Footnotes

1.   The "insurance payment" component of imported services is calculated as the value of premiums paid to foreign companies less the amount of losses recovered from foreign companies. In the third quarter, the estimated size of losses recovered far exceeded the amount paid for insurance premiums, resulting in a negative recorded insurance payment. According to NIPA accounting, the entire amount of a recovery is recorded in the quarter in which the incident occurred. Return to text

2.   According to NIPA accounting, the value of the one-time insurance payments by foreign insurers is not reflected in NIPA real imports of services. The deflator for service imports was adjusted down for the third quarter to offset the lower value of service imports; the deflator returned to its usual value in the fourth quarter. Return to text

3.   Among these reductions was one on September 17, when the Bank of Canada (along with the ECB) announced a reduction of its policy rate by 50 basis points, following the 50 basis point reduction in the federal funds rate announced by the FOMC earlier in the day.Return to text

Section 1


Home | News and events | Monetary policy | February 2002 report
Accessibility | Contact Us
Last update: February 27, 2002, 10:00 AM