The Federal Reserve Board eagle logo links to home page
Monetary Policy Report submitted to the Congress on July 19, 2006, pursuant to section 2B of the Federal Reserve Act


Section 2

ECONOMIC AND FINANCIAL DEVELOPMENTS IN 2006

Although last year's hurricanes caused the pace of aggregate economic activity around the turn of the year to be uneven, real GDP increased at an average annual rate of 3.6 percent in the final quarter of 2005 and first quarter of 2006--about the same pace that prevailed during the preceding year and a half. Over this period, payroll employment posted additional solid gains, and the unemployment rate declined further. In recent months, the incoming information on real activity has suggested that the pace of the expansion is moderating, with the deceleration in spending most apparent in the household sector. Still, as of midyear, resource utilization in labor and in product markets remained high.
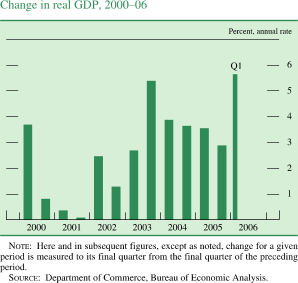
Change in real GDP, 2000–2006. Percent, annual rate. Bar chart. Date range is 2000 to Q1 2006. As shown in the figure, change in real GDP begins at about 3.7 percent, it then decreases to about 0.1 percent in the second half of 2001. In the second half of 2003 it generally increases to about 5.4 percent. Then it decreases to about 2.9 percent in the second part of 2005. Series generally increases to end at about 5.6 percent. NOTE: Here and in subsequent figures, except as noted, change for a given period is measured to its final quarter from the final quarter of the preceding period. SOURCE: Department of Commerce, Bureau of Economic Analysis.

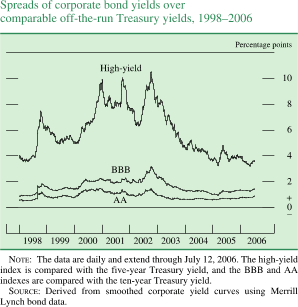
Inflation picked up over the first five months of the year, boosted importantly by the effects of rising energy prices. Long-term inflation expectations fluctuated over the period but remained contained, and increases in unit labor costs were subdued. Although short-term market interest rates rose in line with the FOMC's firming of monetary policy, financial market conditions were still generally supportive of economic expansion in the first half of 2006. Long-term interest rates rose but were still moderate by historical standards, and credit spreads and risk premiums stayed narrow.
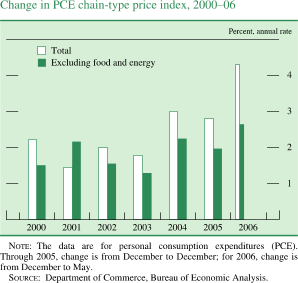
Change in PCE chain-type price index, 2000–06. Percent, annual rate. Bar chart. There are two series (Total and Excluding food and energy). Date range is 2000 to 2006. As shown in the figure, total begins at about 2.3 percent in 2000, then it decreases to about 1.8 percent in 2003. Then it generally increases to end at about 4.3 percent. Excluding food and energy begins at about 1.6 percent in 2000, it then increases to about 2.2 percent in 2001. It then decreases to about 1.3 percent in 2003. Then it generally increases to end at about 2.7 percent. NOTE: The data are for personal consumption expenditures (PCE). Through 2005, change is from December to December; for 2006, change is from December to May. SOURCE: Department of Commerce, Bureau of Economic Analysis.

The Household Sector

Consumer Spending

After increasing at a robust rate around the turn of the year, consumer spending has been rising at a more moderate pace in recent months. Over the first half of 2006, rising employment and the lagged effect of increases in wealth continued to provide support for spending by households. However, consumers' purchasing power was restrained by a further run-up in energy costs in the spring.
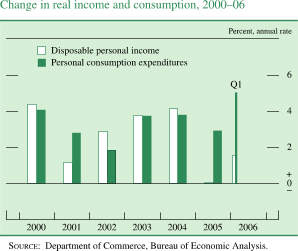
Change in real income and consumption, 2000–06. Percent, annual rate. Bar chart. There are two series (Disposable personal income and Personal consumption expenditures). Date range is 2000 to Q1 2006. As shown in the figure, disposable personal income begins at about 4.2 percent, then it generally decreases to about 1.6 percent in 2001. In 2004 it generally increases to about 4.1 percent, then it decreases to about 0.1 percent in 2005. Series ends at about 1.7 percent. Personal consumption expenditures begins at about 4 percent, then it generally decreases to about 1.9 percent. In 2004 it increases to about 3.9 percent. Series ends at about 5 percent. SOURCE: Department of Commerce, Bureau of Economic Analysis.

Sales of new cars and light trucks bounced back sharply at the turn of the year; those sales had slackened in late 2005 after manufacturers ended the special "employee discount" programs that had boosted sales last summer. New light vehicles sold at an annual rate of 16.8 million units between January and April, about the same as the average rate in 2004 and 2005. However, elevated gasoline prices affected the composition of demand, and consumers shifted their purchases away from light trucks and sport-utility vehicles (SUVs) and toward autos. That shift led to an increase in the market share captured by foreign producers. As households' concerns about the higher price of gasoline weighed on their attitudes toward buying vehicles, sales dipped to an annual rate of 16.2 million units in May and June.

Spending for other household goods, such as furniture, electronic equipment, food, and clothing, was quite strong in the first quarter of 2006; real outlays for goods other than motor vehicles increased at an annual rate of 8-3/4 percent. Some moderation was to be expected after such a surge in spending. Estimates of retail sales, which are available through June, suggest that real expenditures for these goods rose more slowly in the second quarter. In contrast to the uneven pattern of spending for goods, real outlays for consumer services remained on a moderate upward trend over the first half of 2006; they rose at an annual rate of 2-1/2 percent from the fourth quarter of 2005 through May 2006.

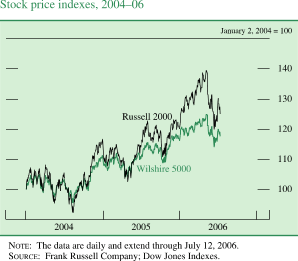
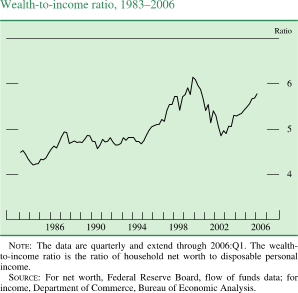
Boosted by gains in nominal wage and salary income, after-tax aggregate personal income rose at an annual rate of 4 percent over the first five months of 2006. However, the acceleration in consumer prices held real income about constant. As a result, the steep decline in the personal saving rate, which began in 2004, extended into 2006. Since 2003, rising household wealth has provided important support for spending, even as gains in real income have been damped by increases in energy prices. In 2005 and the first part of 2006, much of the increase in wealth was the result of the rapid appreciation in the value of homes.
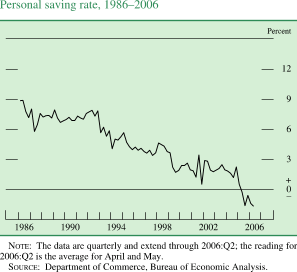
Personal saving rate, 1986–2006. By percent. Line chart. Date range is 1986 to 2006. As shown in the figure, the series begins at about 9 percent, then from 1987 to 1992 it fluctuates within the range of about 6.5 percent and about 8 percent. Then it decreases to end at about negative 1.8 percent. NOTE: The data are quarterly and extend through 2006:Q2; the reading for 2006:Q2 is the average for April and May. SOURCE: Department of Commerce, Bureau of Economic Analysis.

Wealth-to-income ratio,1983–2006. Ratio. Line chart. Date range is 1983 to 2006. As shown in the figure, the series begins at about 4.5. During 1984-1994 it fluctuates within the range of about 4.2 to about 4.9. It generally increases to about 6.2 in 2000, then it decreases to about 4.9 in 2002. It increases to end at about 5.7. NOTE: The data are quarterly and extend through 2006:Q1. The wealth to income ratio is the ratio of household net worth to disposable personal income. SOURCE: For net worth, Federal Reserve Board, flow of funds data; for income, Department of Commerce, Bureau of Economic Analysis.

According to the survey by the University of Michigan Survey Research Center (SRC), the run-up in energy prices contributed importantly to the deterioration in consumer confidence this spring. Consumers' pessimism peaked in May and then lessened somewhat, on average, in June and early July. Nonetheless, at midyear, households indicated that they were still concerned about the effect of the high cost of energy on their financial situation. In addition, households' assessments of current and expected business conditions remained considerably less optimistic than they were at the beginning of the year.
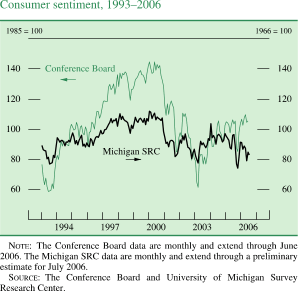
Consumer sentiment, 1993–2006. Two lines chart. Date range is 1993 to 2006. Conference Board (1985 = 100) begins at about 78. Then it decreases to about 60 in the middle of 2993. In 2000 it generally increases to about 145. From 2001-by the end it fluctuates within the range of about 119 and about 61. Series ends at about 105. Michigan SRC (1966 = 100) begins at about 90. Then it increases 110 in 2000. Series fluctuates within the range of about 75 and about 105 from 2001 to 2006. It ends at about 85. NOTE: The Conference Board data are monthly and extend through June 2006. The Michigan SRC data are monthly and extend through a preliminary estimate for July 2006.SOURCE: The Conference Board and University of Michigan Survey Research Center.

Residential Investment

The demand for homes had begun to soften in the summer of 2005, and, by the spring of 2006, starts of new single-family homes were well below the very rapid pace that had prevailed in the preceding two years. The reduced level of activity in real estate markets also led to some easing in house-price appreciation early this year.

Sales of new and existing single-family homes, which had been climbing steadily since 2003, stopped rising during the third quarter of 2005. By May, sales of new and existing homes together were 7-1/4 percent below their peak in June 2005. The cooling in sales caused inventories of unsold homes to rise. In May, the backlog of unsold new homes equaled 5-1/2 months' supply at that month's selling rate, and the backlog of existing homes on the market was 6-1/2 months' supply; in 2005, the stocks of both unsold new and existing homes averaged roughly 4-1/2 months of supply.

An increase in mortgage rates contributed to the slackening in the demand for housing. Since the middle of 2005, the average rate for a thirty-year fixed-rate mortgage has increased about 1 percentage point, to 6-3/4 percent, and the average for a one-year adjustable-rate mortgage has risen a bit more, to 5-3/4 percent. According to respondents to the Michigan SRC survey, the rise in borrowing costs has been an important consideration damping their assessment of buying conditions for homes since mid-2005; the rise in home prices has apparently also weighed on consumers' attitudes.
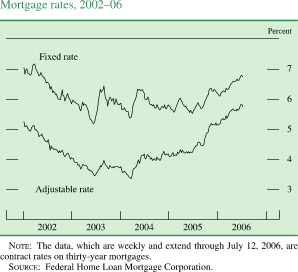
Mortgage rates, 2002–06. Line chart. By Percent. There are two series (Fixed rate and Adjustable rate). Date range is 2002 to 2006. As shown in the figure Fixed rate begins at about 7 percent, then it decreases to about 5.1 percent in 2003. Series fluctuates within the range of about 6.5 percent and about 5.5 percent during 2004-2006. It ends at about 6.8 percent. Adjustable rate begins at about 5.25 percent, then it generally decreases to about 3.3 percent in 2004. Then it increases to end at about 5.8 percent. NOTE: The data, which are weekly and extend through July 12, 2006, are contract rates on thirty-year mortgages. SOURCE: Federal Home Loan Mortgage Corporation.

Although recent increases in house prices have been smaller than those that accompanied the robust real estate markets of 2004 and 2005, the deceleration thus far appears to have been modest. The repeat-transactions index of house prices, which is published by the Office of Federal Housing Enterprise Oversight, increased at an annual rate of 7-1/4 percent in the first quarter of 2006, the smallest quarterly increase since the fourth quarter of 2001; that index attempts to control for the quality of existing single-family homes sold by using prices of homes involved in repeat transactions (excluding refinancings). The first-quarter reading brought the year-over-year change in this measure to 10 percent; in the second and third quarters of 2005, purchase prices according to this index were up 11-1/2 percent from the level of a year earlier. An alternative measure of house prices is the average price of existing single-family homes sold, which is published by the National Association of Realtors. This measure, which does not control for the type of homes sold, showed that the year-over-year change in prices peaked at 11-1/2 percent in August 2005 and then fell to 4 percent in April and May of this year. The greater deceleration in the latter measure suggests that, in addition to some softening in prices, the mix of existing units sold may have shifted toward lower-priced homes.
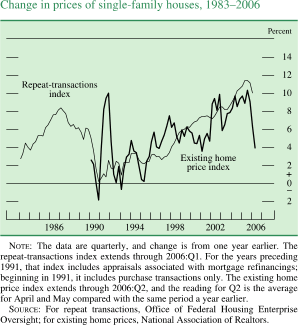
Change in prices of single-family houses, 1983–2006. Line chart. By Percent. There are two series (Repeat-transactions index and Existing home price index). Date range is 1983 to 2006. As shown in the figure Repeat-transactions index begins at about 3 percent in early 1983, then it generally increases to about 8.2 percent in 1987. In 1990 it decreases to about 0.2 percent. During 1991-2006 it increases to end at about 10 percent. Existing home price index begins at about 2.9 percent in 1990, then it generally decreases to about negative 1.9 in the end of 1990. In 1991 it increases to about 10 percent, then generally decreases to about 0 percent in 1992. From 1993 to 2006 series fluctuates within the range of about negative 0.5 and about 11 percent. Series ends at about 4 percent. NOTE: The data are quarterly, and change is from one year earlier. The repeat-transactions index extends through 2006:Q1. For the years preceding 1991, that index includes appraisals associated with mortgage refinancing's; beginning in 1991, it includes purchase transactions only. The existing home price index extends through 2006:Q2, and the reading for Q2 is the average for April and May compared with the same period a year earlier. SOURCE: For repeat transactions, Office of Federal Housing Enterprise Oversight; for existing home prices, National Association of Realtors.

The effect of the slowdown in demand on new construction became apparent during the second half of 2005, when the number of permits issued for new single-family homes began to fall. This year, the decline in permit issuance was relatively steady from January to May. Nonetheless, new single-family homes were started at an exceptionally high annual rate of 1.75 million units during the first quarter, when builders were able to begin work on scheduled projects earlier than normal because of favorable weather conditions. With some starts having been advanced into the first quarter, single-family starts dropped to an average rate of 1.57 million units in April and May. In contrast to the recent trend in the single-family sector, construction of new multifamily homes averaged an annual rate of 360,000 units from January to May, about where it has been for more than four years.
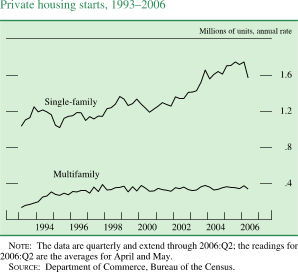
Private housing starts, 1993–2006. Line chart. Millions of units, annual rate. There are two series (Single-family and Multifamily). Date range is 1993-2006. As shown in the figure, single-family begins at about 1. From 1994 through 2000 it fluctuates within the range of about 1 percent and about 1.4. Then it increases to end at about 1.6. Multifamily begins at about 0.2 in early 1993, it than increases to end at about 0.39. NOTE: The data are quarterly and extend through 2006:Q2; the readings for 2006:Q2 are the averages for April and May. SOURCE: Department of Commerce, Bureau of the Census.

Housing activity, as measured by real expenditures on residential structures, contributed almost -1/2 percentage point per year to the annual rate of increase in real GDP in 2004 and 2005. In the first quarter of 2006, that contribution dropped to 0.2 percentage point; with the reduced pace of sales and construction since the winter, a decline in residential investment is likely to have held down the rise in real GDP in the second quarter.

Household Finance

Household debt expanded at an annual rate of about 11-1/2 percent in the first quarter of 2006, about the same pace as in 2005. Despite the rise in mortgage rates and the slowing in housing activity, home mortgage debt expanded rapidly again early in the year as homeowners apparently continued to extract some of the substantial gains in equity that they have accumulated on their homes in the past several years. Indeed, according to industry estimates, although the number of homeowners refinancing their mortgages has remained well below that seen during the refinancing boom of several years ago, a large fraction of homeowners who have refinanced so far this year have chosen to withdraw equity from their homes. As has been the case in recent years, this mortgage-related borrowing likely replaced, in part, some consumer credit borrowing, which, at an annual rate of a bit less than 3 percent, continued to expand modestly in the first five months of 2006.

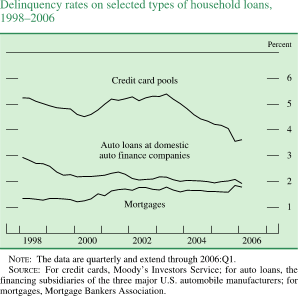
The ratio of household financial obligations to disposable income rose 0.1 percentage point in the first quarter to about 18-3/4 percent, narrowly exceeding the top of its historical range. Nonetheless, the evidence points to only limited pockets of financial distress in the household sector. Delinquency rates on residential mortgages were low by historical standards in the first quarter, though they have edged higher since the middle of last year, particularly in the subprime sector. Delinquency rates on consumer debt also continued to be low. Meanwhile, household bankruptcy filings remained subdued in the first half of 2006, running at a pace well below the average of recent years. Bankruptcies have likely been damped this year in part by the decision of some households in the fall of 2005 to accelerate their filings to avoid the implementation of a stricter bankruptcy law in October. More recently, they may also have been restrained by the greater costs of bankruptcy under the new law.

Household financial obligations ratio, 1992–2006. By Percent. Line chart. Date range is 1992 to 2006. The series begins at about 16.6 percent, then it deceases to about 16.2 percent in 1993. From 1994-2002 it increases to about 18.8 percent. Then it decreases to about 17.9 percent in 2004. Series ends at about 18.6 percent. NOTE: The data are quarterly and extend through 2006:Q1. The financial obligations ratio equals the sum of required payments on mortgage and consumer debt, automobile leases, rent on tenant-occupied property, homeowner’s insurance, and property taxes, all divided by disposable personal income. SOURCE: Federal Reserve Board.

Delinquency rates on selected types of household loans, 1998–2006 . By Percent. Line chart. There are three series (Mortgages, Credit card pools and Auto loans at domestic auto finance companies). Date range is 1998 to 2006. All series start in the beginning of 1998. As shown in the figure, mortgages begin at about 1.3 percent, then it increases to end at about 1.8 percent. Credit card pools begin at about 5.2 percent , then it decreases to about 4.5 percent in 2000. Then it increases to about 5.3 in 2003. Then it generally decreases to end at about 3.7 percent. Auto loans at domestic auto finance companies starts at about 3 percent, then it decreases to end at about 2 percent. NOTE: The data are quarterly and extend through 2006:Q1. SOURCE: For credit cards, Moody’s Investors Service; for auto loans, the financing subsidiaries of the three major U.S. automobile manufacturers; for mortgages, Mortgage Bankers Association.

The Business Sector

Fixed Investment

Real business fixed investment increased at a solid rate, on average, during the final quarter of 2005 and the first quarter of 2006. Over that period, real business spending for new equipment and software rose at an annual rate of 9-3/4 percent, a pace similar to that over the first three quarters of 2005. In addition, investment in nonresidential structures, which had remained weak in 2005, turned up noticeably in early 2006. The underlying determinants of capital spending have stayed quite positive: Businesses have seen steady increases in sales, robust profits, and declining user costs for equipment; they have ample liquid assets; and, despite the rise in interest rates, credit quality is strong.
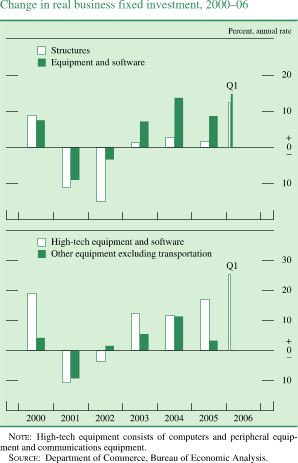
Change in real business fixed investment, 2000–06 . Percent, annual rate. Bar chart. There are four series (Structures, Equipment and software and High-tech equipment and software, Other equipment excluding transportation). Date range is 2000 to Q1 2006. Structures start at about 8 percent in 2000. In 2002 it decreases to about negative 15 percent. Then it increases to end at about 12.5 percent. Equipment and software begins at about 8 percent, then it decreases to about negative 9 percent in 2001. Then it increases to about 14 percent in 2004. Series ends at about 15 percent. High-tech equipment begins at about 19 percent, then it generally decreases to about negative 11 percent in 2001. Then it generally increases to end at about 25 percent. Other equipment excluding transportation starts at about 4 percent, then it decreases to about negative 9 percent. Then series generally increases to about 11 percent in 2004. Series ends at about 4 percent in 2005. NOTE: High-tech equipment consists of computers and peripheral equipment and communications equipment. SOURCE: Department of Commerce, Bureau of Economic Analysis.

Real outlays for equipment and software rose at an annual rate of 14-3/4 percent in the first quarter after having risen at a 5 percent rate in the fourth quarter of 2005. As can often be the case, the timing of spending for a number of types of equipment was uneven between these two quarters. Business purchases of cars and trucks slowed in late 2005, after manufacturers reduced their special discounts on light vehicles, and then recovered in the first quarter. The first- quarter rebound was strengthened by a further acceleration of outlays for medium and heavy trucks. According to industry analysts, businesses have been pulling forward these purchases because the engines in the 2007 models will be required to meet new emission regulations by the Environmental Protection Agency that will make the new vehicles more costly to operate. Deliveries of commercial aircraft to domestic customers also rebounded in the first quarter from a very low level in the fourth quarter.

Demand for high-technology equipment stepped up noticeably in the first quarter because of a sharp jump in outlays for communications equipment. Providers of telecommunications services appear to be investing heavily in fiber-optic networks, which will allow them to offer a wider range of Internet services; the recent spurt likely also includes some replacement demand for equipment damaged by last year's hurricanes. In contrast, business demand for computing equipment, while still increasing at a double-digit pace in real terms, has been relatively modest by historical standards so far this year. Industry analysts suggest that firms may be delaying investment in anticipation of introductions, later this year and in early 2007, of several products that will allow faster and more energy-efficient processing. Spending on equipment other than transportation and high-tech goods continued to trend up at a solid pace, on average, during the fourth and first quarters. Demand was particularly strong for metalworking and general industrial machinery as well as for equipment used in construction, energy extraction, and services industries.

Demand for equipment and software appears to have risen again in the second quarter. The information from U.S. manufacturers on their orders and shipments of nondefense capital goods and the data on imports of capital goods suggest that business spending for equipment other than transportation and high-tech items remained on a strong upward trajectory in April and May. The elevated backlog of unfilled orders at domestic firms likely provided support for factory production of capital equipment in the second quarter. The indicators of demand for high-tech equipment suggest that spending for communications equipment remained at a high level, and real outlays for computing equipment were still rising slowly. Sales of medium and heavy trucks continued to be robust in the second quarter, although they eased slightly from the exceptional rate at the beginning of the year.

Real expenditures for nonresidential construction increased at an annual rate of 12-1/2 percent in the first quarter after having edged up slightly during 2005. Last year, the small net increase in this sector reflected a sharp upturn in spending on structures used in domestic energy exploration; construction of new office and industrial buildings was restrained by elevated vacancy rates. However, vacancy rates for office and industrial properties gradually declined over the course of 2005, and, by the turn of the year, nonresidential construction began to firm. As a result, the increase in nonresidential investment in the first quarter of 2006 was broadly based; it included pickups in outlays in the office, retail, and industrial sectors in addition to another steep rise in spending on structures associated with energy exploration.

Inventory Investment

Business inventories appear generally to be well aligned with sales. In surveys taken during the first six months of 2006, about two-thirds of purchasing managers at manufacturing firms who responded characterized the level of their customers' inventories as about right. A similar proportion of respondents at nonmanufacturing firms reported that they were comfortable with their own levels of inventories. However, dealer stocks of new light motor vehicles, particularly trucks (including SUVs), have risen noticeably as sales have slowed; inventories of light trucks reached an uncomfortable 89 days' supply in May. In late June, a number of manufacturers introduced a new round of incentives aimed at reducing dealer stocks in advance of the introduction of their new models this fall.
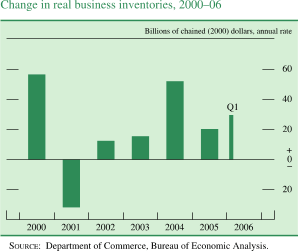
Change in real business inventories,2000-2006. Billions of chained (2000) dollars, annual rate. Bar chart. Date range is 2000 to 2006. As shown in the figure, series begins at about $58 billion, then it generally decreases to about negative $32 billion in 2001, then it generally decreases to about $51 billion in 2004. Series ends at about $30 billion. SOURCE: Department of Commerce, Bureau of Economic Analysis.

Corporate Profits and Business Finance

Corporate profits were again strong in the first quarter of 2006, and earnings per share for S&P 500 firms rose about 15 percent from the same time last year. Gains were widespread but were especially large for firms in the energy sector. Before-tax profits of nonfinancial corporations measured as a share of sector GDP rose to about 14 percent in the first quarter, above the previous peak reached in 1997.
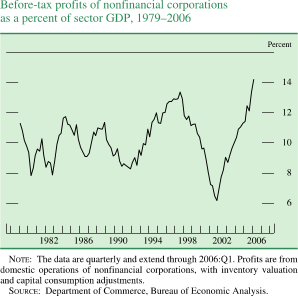
Before-tax profits of nonfinancial corporations as a percent of sector GDP, 1979-2006. Line chart. By percent. Date range is 1979-2006. As shown in the figure, the series begins at about 11.2 percent in the beginning of 1979. From 1980 to 1997 series fluctuates within the range of about 7.9 percent and about 13.3 percent. In 2002 it generally decreases to about 6.1 percent, then it generally increases to end at about 14.1 percent. It generally increases to about 12.5 percent in 1978. From 1980 to 1997 it fluctuates within the range of about 7.9 percent and about 13.5 percent. In 2001 it generally decreases to about 6.1 percent, then it generally increases to end at about 12.1 percent. NOTE: The data are quarterly and extend through 2006:Q1. Profits are from domestic operations of nonfinancial corporations, with inventory valuation and capital consumption adjustments. SOURCE: Department of Commerce, Bureau of Economic Analysis.

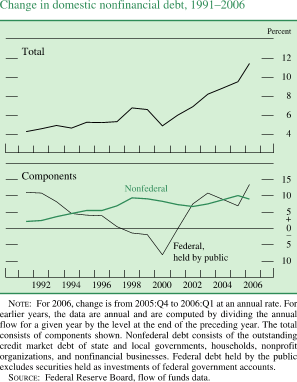
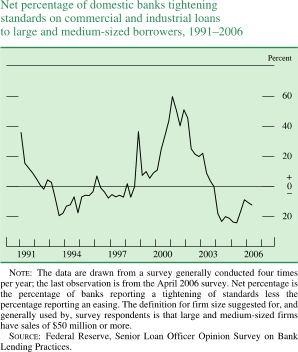
The expansion of business debt picked up to an annual rate of nearly 10 percent in the first quarter of this year, and data in hand suggest a robust pace in the second quarter. A substantial fraction of borrowing proceeds reportedly went to finance mergers and acquisitions in the first half of the year. Net bond issuance has been strong so far in 2006. Short-term borrowing by nonfinancial corporations stepped up in the first quarter of 2006 after slowing somewhat in the fourth quarter of last year; it appears to have remained strong in the second quarter as well. Commercial paper outstanding started rising again, on balance, after edging lower in 2005. Bank business loans outstanding expanded at an annual rate of 15-1/2 percent in the first quarter. Businesses benefited from a more accommodative lending environment: For example, a significant net fraction of respondents to the Federal Reserve's Senior Loan Officer Opinion Survey on Bank Lending Practices in April 2006 noted that their institutions had eased both standards and terms on commercial and industrial loans in the first three months of the year. The most commonly cited reasons for the easing of lending policies were more-aggressive competition from other banks and nonbank lenders, increased liquidity in the secondary market for business loans, and increased tolerance for risk.
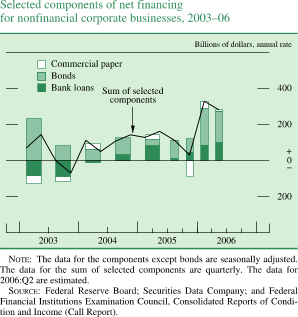
Select components of net business financing 2003-06. Billions of dollars. Bar chart. There are three series (Commercial paper, Bonds and Bank loans) and one line 'Sum of major components'. Date range is 2003 to 2006. Bank loans starts at about negative $90 billion in the first half of 2003. In the second half of 2003 it decreases to about negative $100 billion. Then it generally increases to about $ 100 billion in the first half of 2005. Series ends at about $ 100 billion in Q2 2006. Bonds start at about $250 billion in the beginning of 2003. Then it decreases to about $50 billion in the first half of 2004. From 2004 to Q1 2006 it fluctuates within the range of about 90 and about $20 billion, it ends at about $90 billion. Commercial paper starts at about negative $40 billion in the first half of 2003. Then it generally increases to about $ 50 billion in Q1 2005. Series then decreases to about negative $80 billon in Q4 c2005. Series ends at about $ 10 billion. 'Sum of major components' starts at about $70 billion in 2003. Then it increases to about $150 billion in Q3 2003. Then it generally decreases to about negative $60 billion in Q4 2003. In Q2 2005 it increases to about $160 billion. Then it decreases to about $30 billion in Q4 2005. In Q1 2006 in generally increases to about $320 billon. Series ends at about $290 billion. NOTE: The data for the components except bonds are seasonally adjusted. The data for the sum of selected components are quarterly. The data for 2006:Q2 are estimated. SOURCE: Federal Reserve Board; Securities Data Company; and Federal Financial Institutions Examination Council, Consolidated Reports of Condition and Income (Call Report).

Net percentage of domestic banks tightening standards on commercial and industrial loans to large and medium-sized borrowers, 1991-2006. By percent. Line chart. Date range is 1991-2006. As shown in the figure the series begins at about 38 percent, then it generally decreases to about negative 20 percent in 1993. From 1994-1997 it fluctuates within the range of about negative 18 and about 7 percent, then it increases to about 37 percent in 1998. In 1999 it decreases to about 5 percent, then increases to about 60 percent in 2001. During 2002-2005 it generally decreases to about negative 23 percent. Then it increases to end to about negative 16 percent. NOTE: The data are drawn from a survey generally conducted four times per year; the last observation is from the April 2006 survey. Net percentage is the percentage of banks reporting a tightening of standards less the percentage reporting an easing. The definition for firm size suggested for, and generally used by, survey respondents is that large and medium-sized firms have sales of $50 million or more. SOURCE: Federal Reserve, Senior Loan Officer Opinion Survey on Bank Lending Practices.

Gross equity issuance has remained moderate so far this year, while an elevated level of cash-financed mergers along with record share repurchases has produced further sizable net equity retirements. Taken together, net funds raised by nonfinancial corporations in the credit and equity markets have been slightly negative in 2006, an indication that nonfinancial corporations have financed their increased investment spending with internal funds.
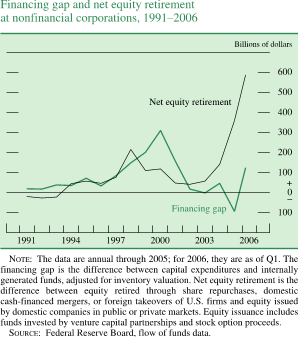
Financing gap and net equity retirement at nonfinancial corporations, 1991-2006. Line chart. Billions of dollars. There are two lines (Net equity retirement and Financing gap). Both lines covering the date range of 1991 to 2006. Net equity retirement begins at about negative $25 billion .Then it generally increases to about $210 billion in 1998. In 2002 series decreases to about $45 billion, then it increases to end at about $590 billion. Financing gap begins at about $25 billion, then it generally increases to about $310 billion in 2000. Then series decreases to about $0 billion in 2003. In 2004 it increases to about $50 billion and then decreases to about negative $ 100 billion. Then it generally increases to end at about $125 billion. NOTE: The data are annual through 2005; for 2006, they are as of Q1. The financing gap is the difference between capital expenditures and internally generated funds, adjusted for inventory valuation. Net equity retirement is the difference between equity retired through share repurchases, domestic cash-financed mergers, or foreign takeovers of U.S. firms and equity issued by domestic companies in public or private markets. Equity issuance includes funds invested by venture capital partnerships and stock option proceeds. SOURCE: Federal Reserve Board, flow of funds data.

With profitability strong and balance sheets flush with liquid assets, credit quality in the nonfinancial business sector generally has remained quite high. The six-month trailing default rate on corporate bonds dropped after some large firms in the troubled airline and automobile sectors defaulted during the past fall and winter. Delinquency rates on business loans have stayed near the bottom of their historical range.
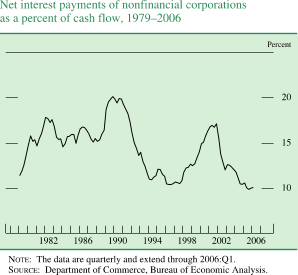
Net interest payments of nonfinancial corporations as a percent of cash flow, 1979-2006 . By percent. Line chart. Date range is 1979-2006. As shown in the figure the series begins at about 11.5 percent, then it increases to about 20 percent in 1989. Then it decreases to about 10 percent in 1996. In 2002 it increases to about 17.5 percent, then it decreases to end at about 10 percent. NOTE: The data are quarterly and extend through 2006:Q1. SOURCE: Department of Commerce, Bureau of Economic Analysis.

Default rate on outstanding corporate bonds,1992-2006. By percent. Line chart. Date range is 1992-2006. As shown in the figure the series begins at about 1.2 percent, then it decreases to about 0.1 percent in 1993. From 1994 to 1998 it fluctuates within the range of about 0.1 percent and about 0.6 percent. In 2002 it generally increases to about 3.7 percent, then it decreases to about 0.2 percent in 2004. Series ends at about 0.2 percent. NOTE: The data are monthly and extend through June 2006. The rate for a given month is the face value of bonds that defaulted in the six months ending in that month, multiplied by two to annualize the defaults and then divided by the face value of all bonds outstanding at the end of the calendar quarter immediately preceding the six-month period. SOURCE: Moody's Investors Service.

Commercial real estate debt expanded briskly in the first half of 2006, albeit not as quickly as during 2005. Spreads on BBB-rated commercial-mortgage-backed securities have fallen this year. The decline reversed an increase that took place at the end of last year, when issuance surged; these spreads are now back in line with those of comparable-quality corporate bonds. With rents climbing and vacancy rates falling, delinquency rates on commercial real estate loans have been low, and credit quality has remained generally good.

The Government Sector

Federal Government

The deficit in the federal unified budget narrowed further during the past year. Over the twelve months ending in June, the unified budget recorded a deficit of $276 billion, about $60 billion less than during the comparable period last year. The federal deficit over the twelve months ending in June was approximately 2 percent of nominal GDP and was significantly lower than its recent fiscal year peak of 3.6 percent of GDP in 2004. Although outlays increased faster than nominal GDP over the past year, the rise in receipts was even larger. Thus, in its recent Mid-Session Review of the budget, the Administration estimated that the federal government will finish fiscal 2006 with a deficit of $296 billion; that figure marks a decline from the fiscal 2005 deficit of $318 billion and is much lower than most analysts had projected at the beginning of this year.

During the twelve months ending in June, federal receipts were 13-1/4 percent higher than over the same period a year earlier and equivalent to almost 18-1/4 percent of nominal GDP. Income tax receipts from individuals have outpaced the rise in nominal income; final tax payments on income from 2005 were especially strong in April and May. Corporate tax payments continued to rise at a robust rate, even faster than corporate profits.
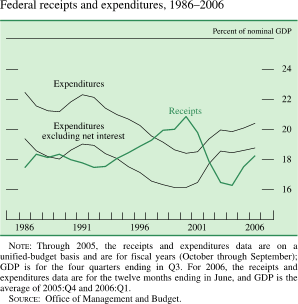
Federal receipts and expenditures 1986-2006. By percent of nominal GDP. Line chart. There are three series (Expenditures, Receipts and Expenditures excluding net interest). Date range is 1986 to 2006. Expenditures and Expenditures excluding net interest generally moving together with Expenditures excluding net interest being about 3 percent lower. Expenditures starts at about 22.5 percent in early 1986 and Expenditures excluding net interest starts at about 19.5 percent. Then during 1987-2000 they generally decrease. Expenditures to about 18.5 percent and Expenditures excluding net interest to about 16 percent. Expenditures end at about 20.5 percent and Expenditures excluding net interest end at about 19 percent. Receipts start at about 17.5 percent. From 1987 to 2000 it increases to about 21 percent, then it generally decreases to about 16 percent in 2004, then increases to end at about 18.5 percent. NOTE: Through 2005, the receipts and expenditures data are on a unified-budget basis and are for fiscal years (October through September); GDP is for the four quarters ending in Q3. For 2006, the receipts and expenditures data are for the twelve months ending in June, and GDP is the average of 2005:Q4 and 2006:Q1. SOURCE: Office of Management and Budget.

Nominal federal outlays rose 9 percent between June 2005 and June 2006 and were about 20-1/2 percent of nominal GDP. The rise in outlays was bolstered by increases in several components of federal spending. Net interest payments increased 20 percent over the year ending in June as federal debt continued to rise and interest rates increased. Medicare outlays were up 14-1/2 percent; since the inception of the new Part D prescription drug program in January, outlays for benefits have added more than $20 billion to spending in this category. Legislative actions related to the hurricanes in the Gulf Coast region last autumn have added significantly to spending for disaster relief over the past ten months. Although defense spending has slowed from the annual double-digit rates of increase from 2002 to 2004, it still has increased about 8 percent per year in the past two years.

As measured in the national income and product accounts (NIPA), real federal expenditures on consumption and gross investment--the part of federal spending that is a direct component of real GDP--increased at an annual rate of 3-3/4 percent, on average, during the final calendar quarter of 2005 and the first calendar quarter of 2006 and contributed roughly 0.3 percentage point to the annualized change in real GDP over the period. Over these two quarters, real defense purchases were about constant, on average, while spending related to disaster relief from the hurricanes contributed importantly to a rise in real nondefense purchases.
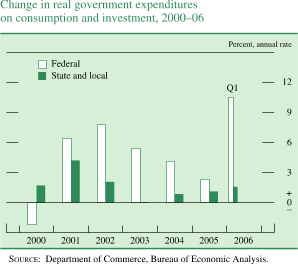
Change in real government expenditures on consumption and investment. Bar chart, 2000-06. By percent. There are two series (Federal , State and local). Date range is 2000 to Q12006. Federal begins at about negative 2 percent. In 2002 it generally increases to about 8 percent. Then it decreases to about 2.5 percent in 2005. Series then generally increases to end at about 10.5 percent. State and local begins at about 1.8 percent. Series increases to about 4.25 in 2001, then it generally decreases to about 0 percent in 2003. Then series increases to end at about 1.5 percent. SOURCE: Department of Commerce, Bureau of Economic Analysis.

The narrowing of the federal deficit recently has reduced its drain on national saving. However, net national saving excluding the federal government has remained low relative to historical norms. Although the saving rate for private business has moved up during the past two years, the improvement has been offset by the further decline in personal saving. Overall, national saving, net of depreciation, stood at 2-1/2 percent of nominal GDP in the first quarter of 2006. Although the recent rate is a noticeable improvement from the lows of the preceding few years, it has been insufficient to avoid an increasing reliance on borrowing from abroad to finance the nation's capital spending.
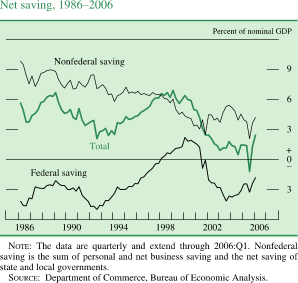
Net saving, 1986-2006. By percent of nominal GDP. line chart. There are three series (Nonfederal saving, Total and Federal saving). All series covering the date range of 1986 to 2006. Nonfederal saving and Total generally moving together with Total being about 4 percent lower. Nonfederal saving starts at about 10 percent, then it generally decreases to about 7.3 percent in 1987. Total starts at about 5.9 percent, then it generally decreases to about 4 percent in 1987. From 1988 to 1998 they fluctuate between about 8.9 and about 2 percent, with total being about 4 percent lower. In 1998 they split. Total decreases to about negative 1 percent in 2005, then increases to end at about 2.5 percent. Nonfederal saving decreases to about 3 percent in 2001,then increases to about 5.8 percent in 2003, then decreases to about 2 percent in 2005. Series ends at about 4.2 percent. Federal saving starts at about negative 4 percent, then it increases to about 2.3 percent in 1998, then it decreases to about negative 5 percent in 1992. From 1993 to 2000 It generally increases to about 2.2 percent, then it decreases to about negative 4 percent in 2003. Series increases to end at about negative 1.9 percent. NOTE: The data are quarterly and extend through 2006:Q1. Nonfederal saving is the sum of personal and net business saving and the net saving of state and local governments. SOURCE: Department of Commerce, Bureau of Economic Analysis.

Federal Borrowing

Federal debt rose at an annual rate of 13 percent in the first quarter, a bit less than in the corresponding quarter of 2005. In February, federal debt subject to the statutory limit reached the ceiling of $8.184 trillion, and the Treasury resorted to accounting devices to avoid breaching the limit. The Congress subsequently increased the debt ceiling to $8.965 trillion in March. In the second quarter, federal debt likely declined temporarily because of a surge in tax receipts. On net, the Treasury has raised substantially less cash in the market so far this year than in the comparable period of 2005.
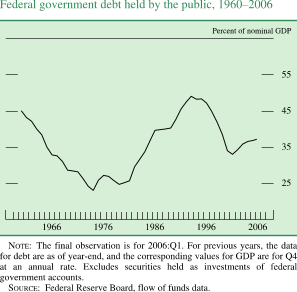
Federal government debt held by the public,1960-2006. By Percent of nominal GDP. Line chart. Date range of 1960 to 2006. As shown in the figure, the series begins at about 45 percent in early 1960. In 1974 it decreases to about 24 percent. In 1993 it increases to about 49 percent, then it decreases to end at about 36 percent. NOTE: The final observation is for 2006:Q1. For previous years, the data for debt are as of year-end, and the corresponding values for GDP are for Q4 at an annual rate. Excludes securities held as investments of federal government accounts. SOURCE: Federal Reserve Board, flow of funds data.

In February, the Treasury conducted an auction of thirty- year bonds for the first time since 2001. The issue generated strong interest, especially from investment funds; foreign investors were awarded only a small fraction of the total. In general, foreign demand for Treasury securities appears to have eased somewhat in 2006. The proportion of nominal coupon securities bought at auction by foreign investors has continued to fall from its peak of 24 percent in 2004; it averaged about 14 percent in the first six months of 2006. Data from the Treasury International Capital system generally suggested subdued demand from both foreign private investors and foreign official institutions over this period. The amount of Treasury securities held in custody at the Federal Reserve Bank of New York on behalf of foreign official and international accounts has changed little since the end of 2005.
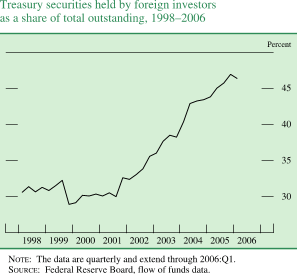
Treasury securities held by foreign investors as a share of total outstanding, 1998–2006. By percent. Line chart. Date range is 1998-2006. As shown in the figure, the series begins at about 31 percent, the it increases to about 32.5 percent in 1999. In 2000 it decreases to about 29 percent and then it increases to end at about 46.5 percent. NOTE: The data are quarterly and extend through 2006:Q1. SOURCE: Federal Reserve Board, flow of funds data.

State and Local Governments

The fiscal positions of states and localities continued to improve through early 2006. In particular, revenues are on track to post a relatively strong gain for a third consecutive year. Tax receipts from sales, property, and personal and corporate income were up 8-1/4 percent during the year ending in the first quarter of 2006, a rate similar to the increase in the preceding year. The sustained strength in revenues has enabled these jurisdictions to increase their nominal spending somewhat while rebuilding their reserve funds. On a NIPA basis, net saving by state and local governments--a measure that is broadly similar to the surplus in an operating budget--rose to an annual rate of $21-1/2 billion in the first quarter of 2006 after having been close to zero in 2005. Although most states have seen improvement, a number of states are still struggling with structural imbalances in their budgets, and those in the Gulf Coast region are coping with demands related to damage from last year's hurricanes. In addition, local governments may face pressure to hold the line on property taxes after the sharp increases in the past several years, and governments at all levels will have to contend with the need to provide pensions and health benefits to a rising number of retirees in coming years.
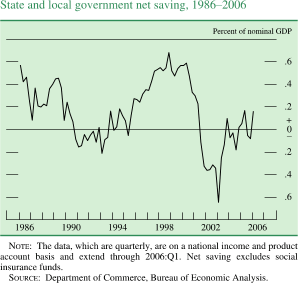
State and local government net saving, 1986-2006. By percent of nominal GDP. line chart. Date range is 1986 to 2006. As shown in the figure, the series begins at about 0.6 percent in early 1986. In 1987 it generally decreases to about 0.1 percent. In 1989 it generally increases to about 0.5 percent. In 1993 it generally decrease to about negative 0.2 percent, then from 1994 to 1998 series increases to about 0.7 percent. In 2002 it generally decreases to about negative 0.65 percent, then it increases to about 0.2 percent in 2005. Then it decreases to about negative 0.1percent in 2006. Series ends at about 0.2 percent. NOTE: The data, which are quarterly, are on a national income and product account basis and extend through 2006:Q1. Net saving excludes social insurance funds. SOURCE: Department of Commerce, Bureau of Economic Analysis.

Real expenditures by state and local governments on consumption and gross investment, as estimated in the NIPA, rose at an annual rate of 1-1/2 percent in the first quarter of 2006 after having increased roughly 1 percent per year in 2004 and 2005. Real expenditures for investment turned up in the first quarter after having fallen during the second half of 2005. Real outlays for current consumption posted a moderate increase in the first quarter, and that trend appears to have continued into midyear. Hiring by state and local governments was slow early in the year but appears to have firmed in the spring. Of the cumulative increase in employment of 100,000 between December and June, 40 percent of the jobs were in education.

State and Local Government Borrowing

Borrowing by state and local governments has slowed thus far in 2006. The deceleration likely reflects the general improvement in budget conditions and a decline in advance refundings, which have dropped below their 2005 pace amid rising interest rates and a dwindling pool of eligible securities. Credit quality in the state and local sector has continued to improve, and upgrades of credit ratings have far outnumbered downgrades. Consistent with the improvement in credit quality, yields on long-dated municipal bonds have increased substantially less than those on comparable- maturity Treasury securities, and the yield ratio has accordingly fallen sharply.

The External Sector

The U.S current account deficit narrowed in the first quarter of 2006 to $835 billion at an annual rate, or about 6-1/2 percent of nominal GDP, from $892 billion in the fourth quarter of 2005. The narrowing resulted from three factors. Unilateral transfer payments to foreigners dropped, largely because of a decrease in government grants. The trade deficit narrowed, primarily because the value of imported oil and natural gas declined. In addition, higher direct investment receipts and lower direct investment payments produced an increase in the investment income balance.
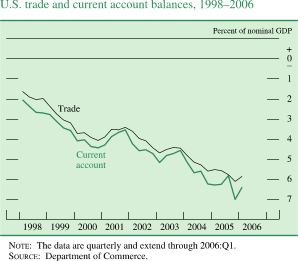
U.S. trade and current account balances, 1998-2006. Percent of nominal GDP. Line chart. There are two lines (Trade and Current account). Date range of 1998 to 2006. Both series generally move together with Current account being slightly lower. They start at about negative 2 percent in early 1998. Then they decrease to about negative 4 percent in 2000, then series increase to about negative 4.5 in 2001. In 2005 they decreases to end. Trade ends at about negative 6.1 percent. Current account ends at about negative 7.6 percent. NOTE: The data are quarterly and extend through 2006:Q1. SOURCE: Department of Commerce.

International Trade

Real exports of goods and services increased 14-3/4 percent at an annual rate in the first quarter of 2006, far faster than the 6-1/2 percent rate recorded in 2005. The surge in export growth in the first quarter resulted in part from a recovery in exports of many types of industrial supplies following a period of hurricane-related disruptions late last year. Exports of capital goods also increased rapidly in the first quarter, with deliveries of aircraft to foreign carriers exhibiting particular strength. The first-quarter increase in exports was widespread across destinations, a sign of robust economic activity in many parts of the world, and exports to Mexico and Canada showed especially large increases. Real exports of services rose at an annual rate of about 6-1/2 percent in the first quarter after increasing just 2-3/4 percent in 2005. Available data for nominal exports in April and May suggest that the increase in real exports was smaller in the second quarter, held down in part by a drop in aircraft exports after a strong first quarter.
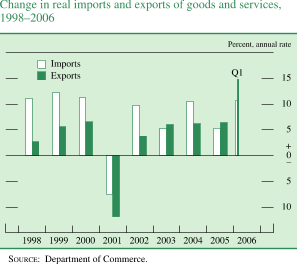
Change in real imports and exports of goods and services, 1998-2006. Percent, annual rate. Bar chart with 2 series (Imports and Exports). Date range of 1998 to Q1 2006. Both series start in 1998. Imports begins at about 12 percent. In 1999 it increases to about 12.5 percent, then generally decreases to about negative 7.5 percent in 2001. During 2002-2005 it fluctuates within the range of about 11 and about 5 percent. Series end at about 11 percent. Exports starts at about 2.5 percent and then it increases to about 6.5 percent in 2000. In 2001 it generally decreases to about negative 12 percent. Then series increases to end at about 15 percent. SOURCE: Department of Commerce.

Prices of exported goods increased at an annual rate of 2-3/4 percent in the first quarter of 2006, a pace somewhat faster than in the second half of 2005. Prices of non-agricultural industrial supplies continued to increase steadily in the first quarter, driven importantly by higher prices for oil and metals. An acceleration in prices for finished goods, especially for capital and consumer goods, contributed to the faster pace of export price inflation in the first quarter. The available data for the second quarter point to further increases in export prices on the strength of additional run-ups in the prices of non-agricultural industrial supplies, especially metals.

Real imports of goods and services rose at an annual rate of 10-3/4 percent in the first quarter, slightly slower than in the fourth quarter but still considerably faster than the 5-1/4 percent rate observed for 2005 as a whole. Robust growth of real GDP in the United States supported the first-quarter increase in imports. Among categories of goods, large increases in imports of consumer goods, automotive products, and capital goods, particularly computers, more than offset declines in imports of oil and some other industrial supplies. The rise in imports in the first quarter was widely distributed across countries, and the increases for China and Mexico were especially large. Real imports of services jumped at an annual rate of 8-1/2 percent in the first quarter. Nominal imports in April and May point to an abrupt slowing of real imports in the second quarter from the first quarter's rapid pace.

Prices of imported goods excluding oil and natural gas rose at an annual rate of about 1 percent in the first quarter of 2006, -3/4 percentage point faster than the pace in the second half of 2005. Prices of material-intensive goods, such as nonfuel industrial supplies and foods, increased steadily in the last quarter of 2005 and in the first quarter of 2006. Also in the first quarter, prices of finished goods, such as consumer goods and many kinds of capital goods, turned up slightly. Available data for the second quarter indicate that prices of finished goods kept rising at a subdued pace. However, prices of material-intensive goods continued to increase sharply, a development reflecting higher prices for metals. The International Monetary Fund's index of global metals prices rose 46 percent between December 2005 and May 2006, largely because of robust global demand. In June, metals prices retreated about 8 percent, although they remained well above the levels of earlier this year.
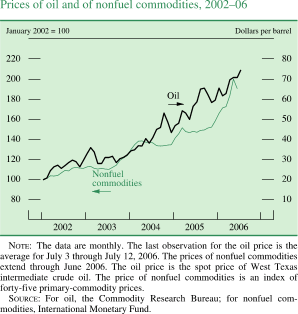
Prices of oil and of nonfuel commodities, 2002-06. Two lines chart (Nonfuel commodities and Oil). Date range of 2002 to 2006. Nonfuel commodities (January 2002 = 100 ) begins at about 100, then it generally increases to about 140 in 2004. In the beginning of 2005 it decreases to about 135, then it increases to end at about 195. 'Oil'(Dollars per barrel) begins at about 20 in early 2001, then it increases to about 39 in 2004. In the middle of 2005 it decreases to about 37. Then series increases to end at about 66. NOTE: The data are monthly. The last observation for the oil price is the average for July 3 through July 12, 2006. The prices of nonfuel commodities extend through June 2006. The oil price is the spot price of West Texas intermediate crude oil. The price of nonfuel commodities is an index of forty-five primary-commodity prices. SOURCE: For oil, the Commodity Research Bureau; for nonfuel commodities, International Monetary Fund.

The spot price of West Texas intermediate crude oil increased from around $60 per barrel at the end of last year to more than $75 per barrel in July, higher than the peak that followed last year's hurricanes. Oil prices have been highly sensitive to news about both supply and demand, particularly in light of the narrow margin of worldwide spare production capacity. Global oil demand has continued to grow as the foreign economic expansion has spread, and developing countries have posted the largest increases in oil consumption. Recent events in the Middle East--including concerns over Iran's nuclear program, violence in Iraq, and the recent conflict in Lebanon--have put additional upward pressure on oil prices. In Nigeria, attacks against oil infrastructure have reduced oil production for most of this year. Government intervention in energy markets also raised concerns about supply from some countries: In recent months, Bolivia nationalized its natural gas reserves, and Venezuela and Russia continued to tighten governmental control of their energy industries.

The rise in the price of the far-dated NYMEX oil futures contract (currently for delivery in 2012) to more than $70 per barrel likely reflects a belief by oil market participants that the balance of supply and demand will remain tight over the next several years.

The Financial Account

The U.S. current account deficit continues to be financed primarily by foreign purchases of U.S. debt securities. Foreign official inflows in the first quarter maintained the strength exhibited in 2005 but remained below the record levels of 2004. As in recent years, the majority of these official inflows were attributable to Asian central banks and have taken the form of purchases of U.S. government securities.
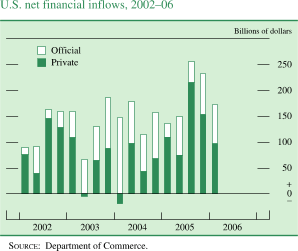
U.S. net financial inflows, 2002-06. Bar chart with 2 series (Official and Private). Billions of dollars. Date range of 2002 to 2006. Private starts at about 70 billions of dollars in Q1 2002, then it decreases to about $40 billion in Q2 2002. In Q3 2002 it generally increases to about $ 140 billion. In Q2 2003 it generally decreases to about negative $10 billion. From Q3 2003 to Q2 2005 it fluctuates within the range of about negative $20 billion and about $120 billion. In Q3 2005 it generally increases to about $215 billion. Then series decreases to end at about $ 95 billion. Official starts at about $10 billion in Q1 2002. From Q2 2002 to Q3 2005 it fluctuates within the range of about $20 billion and about $ 150 billion. Series then increases to end at about $70 billion in Q1 2006. SOURCE: Department of Commerce.

Foreign private purchases of U.S. securities continued in the first quarter at the extraordinary pace set in the second half of 2005. Although private flows into U.S. Treasury bonds were significantly smaller than in recent quarters, this slowing was more than offset by larger flows into agency bonds and equities. Preliminary data for April and May suggest a slowdown in foreign purchases of U.S. securities relative to the first quarter. Foreign direct investment flows into the United States continued in the first quarter near last year's average levels.
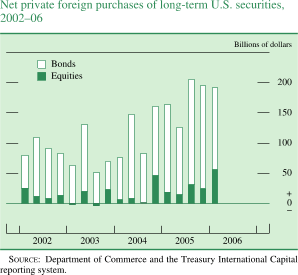
Net private foreign purchases of long-term U.S. securities, 2002-06. Bar chart with two series (Bonds and Equities). Billions of dollars. Date range of 2002 to 2006. Equities begins at about $35 billion in Q1 2002. Then it decreases to about negative $0 billion in Q3 2003. From Q3 2003 to Q4 2005 it fluctuates within the range of about $40 billion and about $10 billion. In Q1 2006 it increases to end at about $60 billion. SOURCE: Department of Commerce and the Treasury International Capital reporting system.

Net purchases of foreign securities by U.S. residents, which represent a financial outflow, strengthened slightly in the first quarter and continued at a solid pace in April and May. In addition, significant outflows were associated with U.S. direct investment abroad, a reversal of some unusual inflows in the second half of 2005. These second- half inflows were prompted by the partial tax holiday offered under the 2004 Homeland Investment Act (HIA), which induced the foreign affiliates of U.S. firms to repatriate a portion of earlier earnings that had been retained abroad. In the first quarter, the foreign affiliates partially unwound the HIA-induced flows by retaining an unusually large portion of their first-quarter earnings. Increased merger activity abroad also boosted direct investment outflows in the first quarter.

The Labor Market

Employment and Unemployment

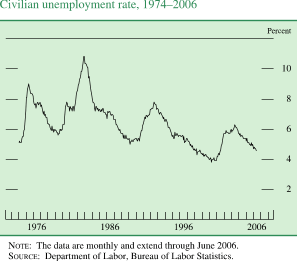
Conditions in the labor market continued to improve in the first half of 2006, although the pace of hiring has slowed in recent months. Nonfarm payroll employment increased 176,000 per month during the first quarter, a rate roughly in line with the relatively brisk pace that prevailed during 2004 and 2005. During the second quarter, hiring slowed, and monthly gains in payrolls averaged 108,000 jobs per month. Over the two quarters, the civilian unemployment rate edged down further, to the lowest quarterly level of joblessness in five years.
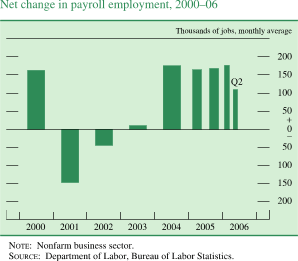
Net change in nonfarm payroll employment, 2000-06. Thousands of jobs, monthly average. Bar chart. Data range is 2000 to Q2 2006. As shown in the figure, the series begins at about 170 in 2000. Then it generally decreases to about negative 150 in 2001. Then it increases to about 180 in Q1 2006. Then series increases to end at about 110. NOTE: Nonfarm business sector. SOURCE: Department of Labor, Bureau of Labor Statistics.

Civilian unemployment rate, 1974-2006. Line chart. By percent. Date range is 1974-2006. As shown in the figure, the series begins at about 5 percent. From 1975 to 1995 it fluctuates within the range of about 5 and 11.5 percent. Then it decreases to about 4 percent in 2000 and then it increases to about 6.2 percent in 2003.Then it decrease to end at about 4.5 percent. NOTE: The data are monthly and extend through June 2006. SOURCE: Department of Labor, Bureau of Labor Statistics.

In the first quarter, with homebuilding quite strong, hiring continued to be particularly robust at construction sites; part of this strength was the result of favorable weather, which allowed more construction activity than is typical during the winter months. Although nonresidential construction activity was firming by the spring, the pullback in housing starts slowed the demand for residential contractors and workers in the building trades. As a result, monthly additions to construction industry payrolls declined from more than 25,000 per month in the first quarter to just 3,000 per month in the second quarter. Cutbacks at retailers also were an important factor holding down the overall gain in employment in the second quarter. After having been stable early in 2006, employment at retail outlets fell almost 30,000 per month between March and June; most of the cutbacks occurred at general merchandisers.

In other sectors, employment remained on a solid upward trend during the first half of the year. As has been the case since mid-2004, establishments providing education and health services, those offering professional and technical business services, and those involved in financial activities, taken together, added more than 60,000 jobs per month. Employment in manufacturing, which had turned up at the end of 2005, rose further over the first half of 2006. Expanding industrial production was also associated with further job gains in related industries, such as wholesale trade and transportation. In addition, the increase in energy production led to a sustained rise in employment in the natural resources and mining industry over the first half of the year.

The increase in job opportunities so far in 2006 led to a further reduction in the civilian unemployment rate, from an average of 5.0 percent in the second half of 2005 to 4.7 percent in the second quarter of 2006. Although hiring moderated in the spring, layoffs remained low. New claims for unemployment insurance (UI) dipped below 300,000 per week in January and February and then fluctuated around a still-low level of about 315,000 per week for most of the period from March through early July. Over the first half of 2006, longer-term unemployment (fifteen weeks or more) also moved down, and the proportion of UI claimants who remained on the unemployment rolls until the exhaustion of their benefits continued to recede.

After having edged up during 2005, the labor force participation rate was relatively stable over the first half of 2006 despite the ongoing improvement in labor market conditions. Rates for most broad age groups were little changed from last year's levels. From a longer perspective, developments during the past decade highlight the importance of structural as well as cyclical influences on participation. The rise in the attachment of adult women to the workforce, which was a significant factor in the secular rise in participation over much of the post-World War II period, appears to have leveled off. And the aging of the population is increasing the proportion of the workforce that is 55 years and older; it rose from less than 12 percent in 1996 to 16-3/4 percent in recent months. Although older workers have tended in recent years to stay in the labor force longer, their participation rate, at 38 percent in the second quarter, was less than half the rate for workers who are age 25 to 54. Thus, the demographic shift to an older population has already begun to reduce the overall rate of labor force participation and has offset part of the rise in participation that has been associated with the cyclical upturn in job creation. The secular forces that are slowing the expansion of the labor force imply that the increase in employment that is consistent with a stable unemployment rate will, over time, be smaller than it was during the period when labor force participation was rising steadily.
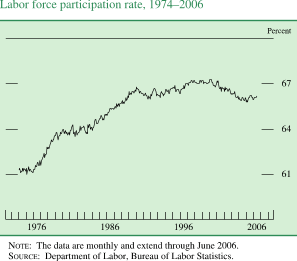
Labor force participation rate, 1974–2006. Line chart. By percent. Date range is 1974-2006. As shown in the figure, the series begins at about 61 percent. In 1998 series increases to about 67 percent, then it decreases to end at about 66 percent. NOTE: The data are monthly and extend through June 2006. SOURCE: Department of Labor, Bureau of Labor Statistics.

Productivity and Labor Costs

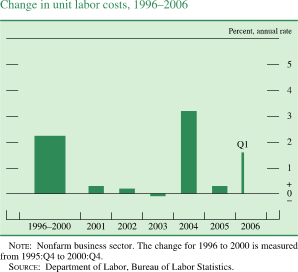
After having advanced at an unusually rapid rate from 2001 to mid-2004, labor productivity in the nonfarm business sector increased at a more moderate annual rate of 2-1/2 percent from mid-2004 to early 2006. Nonetheless, by historical standards, productivity performance recently has still been solid, with gains at a rate matching those during the second half of the 1990s. In an environment of a sustained expansion of aggregate demand, businesses have gradually adjusted their use of labor, capital, and services to achieve ongoing gains in efficiency. Productivity has continued to benefit importantly from investment in new technologies, organizational changes, and improvements in business processes, although the contribution from capital deepening has been smaller in recent years than it was during the capital investment boom of the late 1990s.
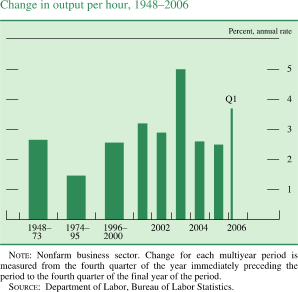
Change in output per hour,1948-2006. By percent, annual rate. Bar chart. Date range is 1948 to Q1 2006. As shown in the figure, in 1948-1973 'Change in output per hour' at about 2.7 percent. In 1974-1995 series at about 1.5 percent. In 1996–2000 it is at about 2.6 percent. In 2003 it generally increases to about 5 percent. In 2005 it generally decreases to about 2.5 percent. Series ends at about 3.8 percent. NOTE: Nonfarm business sector. Change for each multiyear period is measured from the fourth quarter of the year immediately preceding the period to the fourth quarter of the final year of the period. SOURCE: Department of Labor, Bureau of Labor Statistics.

Broad measures of hourly labor compensation, which include both wages and the costs of benefits, posted moderate gains over the year ending in early 2006 despite the run-up in headline price inflation and the further tightening of labor markets. Both the employment cost index (ECI) and the estimate of compensation per hour that uses data from the national income and product accounts increased 2-3/4 percent between the first quarter of 2005 and the first quarter of 2006.1 Both series had reported higher rates of change in hourly labor compensation a year earlier.
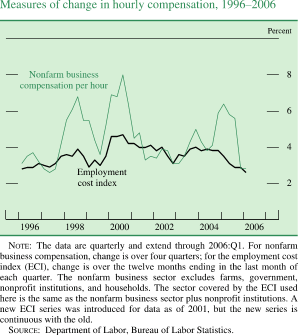
Measures of change in hourly compensation 1996-2006. By percent. Line chart. There are two series (Nonfarm business compensation per hour and Employment cost index). Date range is 1996-2006. Both series start in the beginning of 1996. Nonfarm business compensation per hour begins at about 3.2 percent. Then it decreases to about 2.5 percent in 1997. In 1998 it generally increases to about 6.9 percent, then series decreases to about 3.7 percent in 1999. In 2000 it increases to about 8 percent. From 2001 to 2004 it fluctuates within the range of about 3.2 percent and about 5 percent. In 2005 it generally increases to about 6.2 percent, then series decreases to end to about 2.9 percent. NOTE: The data are quarterly and extend through 2006:Q1. For nonfarm business compensation, change is over four quarters; for the employment cost index (ECI), change is over the twelve months ending in the last month of each quarter. The nonfarm business sector excludes farms, government, nonprofit institutions, and households. The sector covered by the ECI used here is the same as the nonfarm business sector plus nonprofit institutions. A new ECI series was introduced for data as of 2001, but the new series is continuous with the old. SOURCE: Department of Labor, Bureau of Labor Statistics.

Change in unit labor costs, 1996-2006. Percent, annual rate. Bar chart. Data range is 1996- Q1 2006. As shown in the figure, the series begins at about 2.2 percent, then it generally increases to about negative 0.1 percent in 2003. Series then increases to about 3.3 percent in 2004. Series ends at about 1.7 percent. NOTE: Nonfarm business sector. The change for 1996 to 2000 is measured from 1995:Q4 to 2000:Q4. SOURCE: Department of Labor, Bureau of Labor Statistics.

The deceleration in labor compensation appears to have been associated largely with smaller increases in employers' benefit costs. The benefits component of the ECI was up just 3 percent between March 2005 and March 2006, compared with an increase of 5.5 percent between March 2004 and March 2005. The cost of health insurance, which typically accounts for about one-fourth of overall benefit costs, rose just 4-3/4 percent during the year ending in March 2006; between 2000 and 2005, these costs increased, on average, 8-3/4 percent per year. Another likely contributor to the slower rise in benefit costs over the past year was smaller employer contributions to their defined-benefit pension plans; those costs dropped back somewhat after employers made sizable payments to bolster those pension assets in 2004.

Indicators of the recent trend in the wage component of worker compensation have been providing mixed signals. As measured in the ECI, wages rose 2.4 percent between March 2005 and March 2006, slightly less than in the preceding two years. In contrast, the year-over-year change in average hourly earnings of production or nonsupervisory workers--which refers to a narrower group of private nonfarm employees and has tended to show greater cyclical variation than the ECI--has increased steadily over the past three years. Average hourly earnings rose 3.9 percent over the twelve months ending in June 2006, compared with an increase of 2.7 percent over the twelve months ending in June 2005.

Prices

Inflation pressures were elevated during the first half of 2006. The chain-type price index for personal consumption expenditures (PCE) rose at an annual rate of 4-1/4 percent between December 2005 and May 2006. Over the same period, core PCE prices increased at an annual rate of 2.6 percent, nearly 0.6 percentage point faster than over the twelve months of 2005.
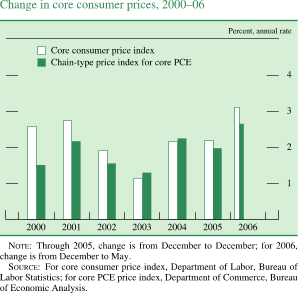
Change in core consumer prices, 2000-2006. By percent, annual rate. Bar chart. There are two series (Core consumer price index and Chain-type price index for core PCE). Both series covering the date range of 200 to 2006. Core consumer price index starts at about 2.6 percent, then it increases to about 2.8 percent in 2001. Series decreases to about 1.3 percent in 2003. Then it generally increases to end at about 3.1 percent. Chain-type price index for core PCE starts at about 1.5 percent, then it increases to about 2.3 percent in 2001. In 2003 it decreases to about 1.3 percent. Series increases to end at about 2.6 percent. NOTE: Through 2005, change is from December to December; for 2006, change is from December to May. SOURCE: For core consumer price index, Department of Labor, Bureau of Labor Statistics; for core PCE price index, Department of Commerce, Bureau of Economic Analysis.

Although energy prices eased temporarily in February, they turned up sharply again from March to May; as a result, the PCE price index for energy increased 13 percent (not at an annual rate) over the first five months of 2006, a rise that marked a continuation of the steep climb in prices that began in 2004. This year, almost the entire rise in energy prices has been associated with higher prices for petroleum- based products. The PCE price index for gasoline and motor fuel, which increased more than 16-1/2 percent last year, climbed another 24 percent (not at an annual rate) by May. Although recent data from the Department of Energy indicate that gasoline prices fell back in June, they moved up again in early July. Retail prices of gasoline this year have risen faster than the cost of crude oil in part because of the additional cost of producing and distributing reformulated product with ethanol. Also, the demand for fuel ethanol has been strong relative to the current capacity to produce it. In contrast, the consumer price of natural gas has turned down this year as inventories have remained relatively high; the price decline between January and May almost completely reversed the steep run-up that occurred last autumn.

Food price inflation remained moderate during the first five months of 2006; between December 2005 and May 2006, the PCE price index for food and beverages increased at an annual rate of 2-1/4 percent. Retail prices of meat and poultry have fallen so far this year. Domestic supplies of meat have been ample. Production has been expanding at a time when export demand for beef has been soft largely because of bans on imports of U.S. beef by Japan and Korea. Prices of processed food have continued to rise at only a moderate rate despite higher prices for grains; export demand for grains has been strong, and the price of corn has been boosted by demand from producers of ethanol. Prices for food consumed away from home, which typically are influenced heavily by labor and other business costs, have continued to increase relatively rapidly, rising at an annual rate of 3-3/4 percent over the first five months of the year.

The pickup in core inflation in the first half of 2006 was evident in the indexes for both goods and services. Prices of consumer goods excluding food and energy, which were unchanged in 2005, edged up at an annual rate of 3/4 percent this year. Prices of consumer services also accelerated this spring; as a result, the PCE price index for non-energy services increased at an annual rate of 3-1/2 percent between December 2005 and May 2006, compared with a rise of 2-3/4 percent in 2005. In the three months ending in May, increases in housing rents were especially steep; the rise may reflect, in part, a shift in demand toward rental units because home purchases have become less affordable. Another contributor to the higher inflation rate for consumer services has been the acceleration in the index for nonmarket services to an annual rate of 4 percent over the first five months of the year from 3 percent last year.2 More broadly, the pickup in core consumer price inflation over the first five months of 2006 likely is the result of the pass-through of higher energy costs to a wide range of goods and services.

The cost pressures from the increase in energy costs during the past three years have been apparent in rising prices of inputs used in the production and sale of final goods and services. The producer price index for intermediate goods, excluding food and energy, rose at an annual rate of 7-1/4 percent between December 2005 and May 2006; this index rose 4-3/4 percent in 2005 and 8-1/4 percent in 2004. In particular, prices of industrial chemicals, fertilizer, and stone and clay products, for which energy represents a relatively high share of the total costs of production, accelerated over the past several years. The costs of a number of important business services, particularly transportation by air, rail, and truck, have also been boosted by higher energy costs. The pass-through of the costs of energy to consumer prices is clear for a few items, such as airfares. For other components of core consumer price indexes, however, the extent of the pass-through is harder to trace. Quantifying the extent of the pass-through is difficult, in part because it is diffused through a wide range of retail goods and services. In addition, the cost of energy is a small share of overall costs--and that share has been declining over time as businesses adopt more energy-efficient technologies and households reduce their consumption of energy. Nonetheless, the cumulative rise in energy costs in recent years has been large enough to show through to pricing of final goods and services even as businesses have seen their labor costs, which represent roughly two-thirds of their costs, remain restrained.
 

Alternative measures of price change, 2003 to 2005
Percent  
Chart of table rule
Price measure
2004
to 2005
2005
to 2006
Chain-type (Q1 to Q1)
Gross domestic product (GDP)
2.8
3.1
Gross domestic purchases
3.1
3.5
Personal consumption expenditures (PCE)
2.7
3.0
    Excluding food and energy
2.2
1.9
Market-based PCE excluding food and energy
1.8
1.5
Fixed-weight
Consumer price index
3.0
4.0
    Excluding food and energy
2.1
2.4
Chart of table rule

      Note:  Changes are based on quarterly averages of
seasonally adjusted data. For the consumer price index, the 2006:Q2 value is calculated as the average for April and May compared with the average for the second quarter of 2005 and is expressed at an annual rate.
      Source:  For chain-type measures, Department of Commerce,
Bureau of Economic Analyis; for fixed-weight measures,
Department of Labor, Bureau of Labor Statistics.
 

Near-term inflation expectations were also influenced importantly over the first half of 2006 by movements in energy prices, but, as of midyear, they were only slightly higher than they were at the turn of the year. The Michigan SRC survey measure of the median expectation of households for inflation over the next twelve months held steady at 3 percent during the first three months of the year but then rose sharply to 4 percent in May as gasoline prices climbed. By early July, this measure of near-term inflation expectations dropped back to 3.1 percent. Longer-term inflation expectations remained within the ranges in which they have fluctuated in recent years. On average over the first half of 2006, the median respondent to the Michigan SRC survey continued to expect the rate of inflation during the next five to ten years to be just under 3 percent. In June, the Survey of Professional Forecasters, conducted by the Federal Reserve Bank of Philadelphia, reported expected inflation at a rate of 2-1/2 percent over the next ten years, an expectation that has been roughly unchanged for the past eight years. Inflation compensation implied by the spread of yields on nominal Treasury securities over their inflation- protected counterparts rose slightly, on net, over the first half of the year; in early July it was just above 2-1/2 percent.

TIPS-based inflation compensation, 2003-06. By percentage points. Line chart. There are two lines (Five-year, five-year ahead and Five-year). Date range is 2003- 2006. Both start in the beginning of 2003. Five-year, five-year ahead begins at about 2.7 percent. During 2003-2004 it fluctuates within the range of about 2.3 and about 3.4 percent. In the middle of 2005 it decreases to about 2.3 percent. Then it increases to about 2.8 percent in the end of 2005. Then it decreases to end at about 2.6 percent. Five-year starts at about 1.25 percent, then it increases to about 1.75 percent in early 2003. It then decreases to about 1.25 percent in the middle of 2003. Then series increases to about 2.6 percent in the middle of 2004. During 2005 it fluctuates within the range of about 2.1 percent and about 2.9 percent. Series ends at about 2.6 percent. NOTE: The data are daily and extend through July 12, 2006. Based on a comparison of the yield curve for Treasury inflation-protected securities (TIPS) with the nominal off-the-run Treasury yield curve. SOURCE: Federal Reserve Board calculations based on data provided by the Federal Reserve Bank of New York and Barclays.

U.S. Financial Markets

U.S. financial markets functioned smoothly in the first half of 2006 against the backdrop of increased volatility in some asset prices. Yields on nominal Treasury coupon securities rose about 70 basis points, on net, through early July as investors came to appreciate that economic conditions and inflation pressures required more monetary policy tightening than they had expected at the end of 2005. Equity prices advanced until mid-May but then reversed those gains. Apparently, evidence of increased inflationary pressures and some softer-than-expected data on economic activity induced market participants to revise down their longer-term outlook for business profits and to perceive greater risks to that outlook. With corporate balance sheets remaining strong and liquid, risk spreads on corporate bonds stayed low, an indication that the revision to the outlook had not sparked broad concerns about credit quality. Firms had ample access to funds, and business-sector debt expanded rapidly in the first quarter. The need to finance brisk merger and acquisition activity was one factor that reportedly induced nonfinancial businesses to tap the credit markets heavily. Bond issuance picked up noticeably, and commercial and industrial loans increased robustly. Banks continued to ease terms and standards on such loans. Household debt expanded further in the first quarter amid rising house prices and brisk cash- out refinancing activity. As was the case in 2005, the M2 monetary aggregate has advanced moderately so far in 2006.

Interest Rates

The FOMC increased the target federal funds rate 25 basis points at each of its four meetings this year. These actions brought the rate to 5-1/4 percent, about 60 basis points above the rate expected at the end of last year for early July. In contrast to the situation earlier in the tightening cycle, when it was evident to investors that considerable monetary policy accommodation was in place and had to be removed, market participants more recently have had to focus to a greater degree on economic data releases and their implications for the outlook for economic growth and inflation to form expectations about near-term policy. Although the information currently available suggests that growth of real output slowed appreciably in the second quarter, incoming price data have pointed to greater-than-expected inflationary pressures throughout the first half of the year. Investors anticipated that the FOMC would act to counter such pressures, and the expected policy path moved upward, on balance, over the first half of 2006. Nevertheless, market participants currently appear to expect the target federal funds rate to ease after the end of the year. Despite investors' apparent awareness that monetary policy decisions increasingly depend on the implications of incoming information for the economic outlook, the implied volatility on short-term Eurodollar rates calculated from option prices has remained near the low end of its historical range.

Yields on nominal Treasury coupon securities rose about 70 basis points across the maturity spectrum through early July, in part because of the expectations for firmer policy. In addition, it appears that a modest rebound in term premiums, including investor compensation for inflation risk, may have contributed to the rise in longer-term rates; still, estimated premiums remain low by historical standards. Yields on inflation-indexed Treasury securities rose less than those on their nominal counterparts, leaving inflation compensation at medium- and long-term horizons 20 to 30 basis points higher than at the turn of the year.

Interest rates on selected Treasury securities, 2003–06. By percentage points. Line chart. There are three series (Ten-year, Two-year and Three-month). Date range is 2003- 2006. Ten-year begins at about 4 percent. From the beginning of 2003 to 2005 it fluctuates within the range of about 3.1 and about 4.9 percent. Series ends at about 5 percent. Two-year begins at about 1.9 percent. Between 2003 and beginning of 2004 it fluctuates within the range of about 1.2 and about 2.1 percent. Then series generally increases to end at about 5 percent. Three-month begins at about 1.1 percent, then it decreases to about 0.8 percent in the middle of 2003. Series increases to end at about 5 percent. NOTE: The data are daily and extend through July 12, 2006. SOURCE: Department of the Treasury.

In the corporate bond market, yields on investment-grade securities moved about in line with those on comparable- maturity Treasury securities through early July. In contrast, those on speculative-grade securities rose only about 40 basis points; as a result, risk spreads were 30 basis points lower in that segment of the market. The narrowness of high-yield spreads was likely a reflection of investors' sanguine views about corporate credit quality over the medium term, given the strength of business balance sheets and the outlook for continued economic expansion.

Spreads of corporate bond yields over comparable off-the-run Treasury yields, 1998-2006. Percentage points. Line chart. There are three series (High yield, BBB and AA). Date range is 1998 to 2006. High yield begins at about 4 percent in early 1998. Then it generally increases to about 7.8 percent in the end of 1998. Then it decreases about 5 percent in 2000. From 2001- 2003 it fluctuates within the range of about 6.2 and about 11 percent. Then series decreases to end at about 3.9 percent. BBB starts at about 1 percent. Then it increases to about 3.2 percent in 2002 and then it decreases to end at about 1.2 percent. AA begins at about 0.5 percent. It fluctuates within the range of about 1.5 and about 0.1 percent during 1998-2005. Series ends at about 0.9 percent. NOTE: The data are daily and extend through July 12, 2006. The high-yield index is compared with the five-year Treasury yield, and the BBB and AA indexes are compared with the ten-year Treasury yield. SOURCE: Derived from smoothed corporate yield curves using Merrill Lynch bond data.

Equity Markets

Broad equity indexes changed little, on net, through early July. Stock prices were boosted up to the first part of May by an upbeat economic outlook and by strong corporate earnings in the first quarter. However, those gains were subsequently reversed as incoming data clouded the prospects for economic growth and continued to point to upward pressures on inflation; the drop in share prices was led by stocks that had logged the largest gains in the previous months, including those of firms with small capitalizations and of firms in cyclically sensitive sectors. A measure of the equity risk premium--computed as the difference between the twelve-month forward earnings-price ratio for the S&P 500 and an estimate of the real long-term Treasury yield--has increased slightly so far this year and remains near the high end of its range of the past two decades. The implied volatility of the S&P 500 calculated from option prices spiked temporarily in late May and early June and remained somewhat elevated compared with its levels earlier in the year.

Stock price indexes, 2004-06. January 2, 2004 = 100. There are two series (Wilshire 5000 and Russell 2000). Date range is 2004-2006. Both series generally move together with Wilshire 5000 being slightly lower. They start in early 2004 at about 100. Then in the middle of 2004 they decrease to about 20. By the end of 2004 they generally increase. Wilshire 5000 increases to about 110 and Russell 2000 increases to about 117. During 2005 they fluctuate within the range of about 103 and about 123. In 2006 both series generally increase to end. Wilshire 5000 ends at about 118, Russell 2000 ends at about 127. NOTE: The data are daily and extend through July 12, 2006. SOURCE: Frank Russell Company; Dow Jones Indexes.

Implied S&P 500 volatility. By percent. Line chart. Date range is 2000-2006. As shown in the figure, the series begins at about 21 percent. From 2000-2003 it fluctuates within the range of about 18 and about 44 percent. In 2003 it generally decreases to end at about 15 percent. NOTE: The data are weekly and extend through July 12, 2006. The series shown is the implied thirty-day volatility of the S&P 500 stock price index as calculated from a weighted average of options prices. SOURCE: Chicago Board Options Exchange.

Net inflows to equity mutual funds were very strong through April, as investors were evidently attracted by the solid performance of the equity market up to that point. In May and June, however, investors withdrew funds as share prices began to sag.

Debt and Financial Intermediation

In the first quarter of 2006, the total debt of domestic nonfinancial sectors expanded at an annual rate of 11 percent. The household, business, and federal government components all increased at double-digit rates, while state and local government debt advanced at about a 6 percent pace. Preliminary data suggest somewhat slower growth of the debt of nonfinancial sectors in the second quarter. The slowdown is particularly noticeable in the federal and state and local government sectors, where strong tax receipts held down borrowing. The available data also point to somewhat reduced growth of nonfinancial business debt in the second quarter.

Change in domestic nonfinancial debt 1991-2006 . By percent. line chart. There are three series (Total, Federal held by public and Nonfederal). Date range is 1991-2006. All series start in the beginning of 1991. Total begins at about 4 percent, then it generally increases to about 7 percent in 1998. In 2000 series decreases to about 5 percent, then generally increases to end at about 12 percent in 2000.Components: Nonfederal begins at about 2.5 percent, then it increases to about 9 percent in 1998. Series decreases to about 7 percent in 2002, then it increases to end at about 9 percent. Federal held by public starts at about 11 percent, then it generally decreases to about negative 8 percent in 2000. Series generally increases to about 11 percent in 2003. Then series decreases to about 7.5 percent in 2005.It ends at about 14 percent. NOTE: For 2006, change is from 2005:Q4 to 2006:Q1 at an annual rate. For earlier years, the data are annual and are computed by dividing the annual flow for a given year by the level at the end of the preceding year. The total consists of components shown. Nonfederal debt consists of the outstanding credit market debt of state and local governments, households, nonprofit organizations, and nonfinancial businesses. Federal debt held by the public excludes securities held as investments of federal government accounts. SOURCE: Federal Reserve Board, flow of funds data.

Commercial bank credit increased at an annual rate of about 11 percent in the first quarter of 2006, a little faster than in 2005, and picked up further to an almost 13 percent pace in the second quarter. A continued rapid increase in business loans was likely supported by brisk merger and acquisition activity, rising outlays for investment goods, ongoing inventory accumulation, and an accommodative lending environment. Growth in commercial mortgages was also strong, as fundamentals in that sector continued to improve. Despite a slowing of housing activity in recent months, residential mortgage holdings expanded robustly. However, higher short-term interest rates likely contributed to a runoff in loans drawn down under revolving home-equity lines of credit. Consumer loans adjusted for securitizations decelerated in the second quarter after rising at a solid pace in the first quarter.

Bank profitability remained solid, and asset quality continued to be excellent in the first quarter. Profits were supported by gains in non-interest income and reductions in loan-loss provisions that more than offset a rise in non-interest expenses. Delinquency and charge-off rates remained low across all loan types. Delinquency rates on residential mortgages on banks' books edged lower in the first quarter after moving up during 2005. Charge-off rates on consumer loans declined to the lowest level seen in recent years after a fourth-quarter surge in charge-offs on credit card loans that was associated with the implementation of the bankruptcy legislation in October of last year.

As the policy debate about the possibility of curbing the balance sheet growth of both Fannie Mae and Freddie Mac continued, the combined size of the mortgage investment portfolios at the two government-sponsored enterprises increased about 1 percent over the first five months of 2006.

The M2 Monetary Aggregate

In the first quarter of 2006, M2 increased at an annual rate of about 6-1/2 percent, but its expansion moderated in the second quarter to a 2-3/4 percent pace, likely because of some slowing in the growth of nominal GDP. Rising short-term interest rates continued to push up the opportunity cost of holding M2 assets. Growth in liquid deposits, whose rates tend to adjust sluggishly to changes in market rates, was particularly slack. By contrast, the expansion in retail money market funds and, especially, small time deposits was brisk, as the yields on those instruments kept better pace with rising market interest rates. Despite apparently modest demand from abroad, currency growth was strong in the first quarter but has slowed since. The velocity of M2 rose at an annual rate of 2-1/4 percent in the first quarter and appears to have continued to rise in the second quarter.

M2 growth rate 1991-2006. By percent. Line chart. Date range is 1991-2006. As shown in the figure, the series begins at about 3.1 percent, then it decreases to about 0.3 percent in 1994. In 1998 it generally increases to about 8.5 percent, then it decreases to about 6 percent in 2000. Series generally increases to about 11 percent in 2001, then it decreases to about 4 percent in 2005. Series ends at about 5 percent. NOTE: Through 2005, the data are annual on a fourth-quarter over fourth-quarter basis; for 2006, change is calculated from 2005:Q4 to 2006:Q2 and annualized. M2 consists of currency, traveler’s checks, demand deposits, other checkable deposits, savings deposits (including money market deposit accounts), small-denomination time deposits, and balances in retail money market funds. SOURCE: Federal Reserve Board, Statistical Release H.6, 'Money Stock Measures' (July 13, 2006).

International Developments

Foreign economic growth was strong in the first quarter of 2006 as the expansion spread to all major regions of the world. Accelerating domestic demand boosted growth in the foreign industrial countries, especially Canada and the euro area. Emerging-market economies continued to benefit from rapid export growth, and Chinese economic activity was also spurred by a surge in investment spending. Data for the second quarter suggest continued strong growth abroad but with moderation in some countries. Rising energy prices have pushed up inflation in many countries this year, but upward pressure on core inflation has generally continued to be moderate.

Foreign monetary policy tightened in the first half of this year in the context of solid growth and some heightened inflation concerns. The European Central Bank (ECB) raised its policy rate 1/4 percentage point in March and again in June, citing rapid credit growth and the ECB's expectation of above-target inflation. At its July policy meeting, the Bank of Canada kept its target for the overnight rate unchanged at 4-1/4 percent, but it had increased its target for the overnight rate 1/4 percentage point at each of its previous seven policy meetings. On July 14, the Bank of Japan (BOJ) ended its zero interest-rate policy by raising its target for the call money rate to 1/4 percent for the first time since 2001. Earlier, on March 9, the BOJ, announcing an end to its five- year-old policy of quantitative easing, said that it would set policy in the future to control inflation over the medium to long run, defined as one to two years ahead.

Official interest rates in selected foreign industrial countries, 2003-06. By percent. line chart. There are four series (United Kingdom, Canada, Euro area and Japan). Date range is 2003-2006. United Kingdom at about 4 percent in 2003, by the end of 2003 it decreases to about 3.5 percent. In the middle of 2004 it increases to about 4.8 percent. Series decreases to end at about 4.5 percent. Euro area begins at about 2.8 percent. From the mid of 2003 to 2005 it decreases and stays at about 2 percent. Then it increases to end at about 2.3 percent. Canada begins at about 2.8 percent, then it increases to about 3.5 percent in the middle of 2003, then it decreases to about 2.2 percent in the middle of 2004. Series then increases to about 2.8 percent in the middle of 2005. Then series increases to end at about 4.5 percent. Japan begins at about 0 percent. Series stays at about 0 percent by the end. NOTE: The data are weekly. The last observation for each series is July 14, 2006. The data shown are the call money rate for Japan, the overnight rate for Canada, the refinancing rate for the euro area, and the repurchase rate for the United Kingdom. SOURCE: The central bank of each area or country shown.

Long-term bond yields abroad have risen along with U.S. bond yields on indications of robust global growth and expectations of additional tightening of monetary policy. Ten-year sovereign yields have risen roughly 70 basis points in the euro area since the end of last year, while the increases on similar securities in Canada and the United Kingdom have been about 50 basis points. Part of the rise in yields abroad has been increased compensation for possible future inflation as measured by the difference in yield between ten-year nominal and inflation-indexed bonds. Yield spreads of emerging-market bonds over U.S. Treasuries narrowed somewhat early in the year, but that narrowing was more than reversed in the second quarter as investors apparently demanded greater compensation for risk amid uncertainties about economic growth and inflation.

Yields on benchmark government bonds in selected foreign industrial countries, 2003-06. By percent. line chart. There are four lines (Canada, United Kingdom, Germany and Japan). Data range 2003-2006. Canada, United Kingdom and Germany generally moving together. All lines start in early 2003. Canada begins at about 5 percent, then it decreases to about 4.1 percent in the middle of 2003.Germany begins at about 4.2 percent, then decreases to about 3.6 percent in the middle of 2003.United Kingdom begins at about 4.5 percent, then it decreases to about 4 percent in the middle of 2003.Between the middle of 2003 and the middle of 2004 lines fluctuate within the range of about 5.1 and about 3.9 percent, then they decrease by the end. Canada ends at about 4.5 percent. Germany ends at about 4 percent. United Kingdom ends at about 4.7 percent. Japan begins at about 0.9 percent, then it decreases to about 0.5 percent in the middle of 2003. Series increases to about 1.9 percent in the middle of 2004, then it decreases to end to about 1.3 percent in the middle of 2005. Then series increases to end at about 2 percent. NOTE: The data are for ten-year bonds and are weekly. The last observation for each series is the average for July 10 through July 12, 2006. SOURCE: Bloomberg L.P.

The foreign exchange value of the dollar has declined about 4-1/2 percent, on net, this year against a basket of the currencies of the major industrial countries but is down only about 1 percent, on net, against the currencies of the other important trading partners of the United States. Much of the dollar's downward move occurred at times when the market was focused on concerns about global current account imbalances. The dollar has recovered some ground since early May, as investors reportedly have engaged in flight-to- safety transactions into dollar- denominated assets in conjunction with the volatility in global commodity and asset markets. On net, the dollar has depreciated since the turn of the year about 6-1/2 percent against the euro and sterling, 3 percent against the Canadian dollar, and 1-1/2 percent against the Japanese yen. In contrast, the dollar has risen roughly 4 percent, on balance, against the Mexican peso this year. During the first half of this year, several smaller countries experienced episodes of substantial financial volatility that in some cases involved sharp depreciations in the exchange value of their currencies.

U.S. dollar nominal exchange rate, broad index 2003-06. Week ending January 3, 2003 = 100. Date range is 2003 to 2006. As shown in the figure, the series begins at about 99, then it decreases to about 90 in the beginning of 2004. Then it generally increases to about 95 in the middle of 2004. By the end of 2004 it decreases to about 88.in the middle of 2005 it increases to about 90. Then series decreases to end at about 87.5. NOTE: The data are weekly and are in foreign currency units per dollar. The last observation is the average for July 10 through July 12, 2006. The broad index is a weighted average of the foreign exchange values of the U.S. dollar against the currencies of a large group of major U.S. trading partners. The index weights, which change over time, are derived from U.S. export shares and from U.S. and foreign import shares. SOURCE: Federal Reserve Board.

U.S. dollar exchange rate against selected major currencies, 2003-06. Week ending January 3, 2003 = 100. Line chart with four lines (Japanese yen, Euro, Canadian dollar and U.K. pound). Date range is 2003-2006. All series start at about 100 in early 2003. 
Japanese yen decreases to about 89 in the beginning of 2004. During 2004 it fluctuates within the range of about 88 and about 95. In 2005 it increases to about 101, then in the beginning of 2006 it decreases to about 94 and then increases to end at about 98. Euro decreases to about 89 in the middle of 2003, then it increases by the end of 2003 to about 95. In the beginning of 2004 it decreases to about 82. From 2004 by the end it fluctuates within the range of about 77 and about 89. Series end at about 82. Canadian dollar decreases to about 83 in 2003. Series increases to about 88 in the middle of 2004, then it decreases to end at about 72. U.K. pound decreases to about 86 in the beginning of 2004. Then it fluctuates within the range of about 84 and about 93 from the middle of 2004 by the end. It ends at about 86. NOTE: The data are weekly and are in foreign currency units per dollar. The last observation for each series is the average for July 10 through July 12, 2006. SOURCE: Bloomberg L.P.

Through the first four months of 2006, a favorable economic outlook and low interest rates supported gains in equity prices in all major foreign countries. During May and early June, however, equity prices registered widespread declines, as market participants grew more concerned about inflation, monetary policy, and global economic growth. More recently, developments in the Middle East have weighed further on stock prices. On net, equity price indexes are up between 1 percent and 4 percent so far in 2006 in Europe and Canada, but they have fallen roughly 8 percent since year-end in Japan. Latin American and Asian emerging-market equity indexes, which had generally gained more than industrial-country indexes early in the year, have fallen more sharply since early May. Equity indexes in Mexico, Brazil, and Argentina have dropped between 12 percent and 15 percent--leaving them still between 5 percent and 7 percent higher so far this year--while stock prices in Korea have fallen about 9 percent, on net, for the year.

Equity indexes in selected foreign industrial countries, 2003-06. Week ending January 3, 2003 = 100. Line chart. There are four series (Japan, Canada, Euro area and United Kingdom). Date range is 2003-2006. All series start at about 100 in the beginning of 2003. Japan increases to 145 in the beginning of 2004, then it decreases to about 135 in 2005 and increases to about 210 in the beginning of 2006. Then it decreases to end to about 185. Canada decreases to about 90 in 2003, then it increases to about 185 in the beginning of 2006. Then it generally decreases to end at about 175. United Kingdom decreases to about 95 in 2003, then it increases to about 160 in the beginning of 2006, then it generally decreases to end at about 155. Euro area decreases to about 80 in 2003, then it increases to about 170 in the beginning of 2006. Then it generally decreases to end at about 165. NOTE: The data are weekly. The last observation for each series is the average for July 10 through July 12, 2006. SOURCE: Bloomberg L.P.

Equity indexes in selected emerging-market economies, 2003-06. Line chart. Week ending January 3, 2003 = 100. There are four series (Argentina, Brazil, Mexico and Asian emerging-market economies). Date range is 2003 to 2006. All lines begin at about 100. Argentina generally increases to about 240 in the beginning of 2004, then in the middle of 2004 it decreases to about 170. It then increases to about 365 in the beginning of 2006. Series ends at about 325. Brazil decreases to about 90 in the beginning of 2003. It generally increases to about 210 in the beginning of 2004, then decreases to about 164 in the middle of 2004. Series increases to about 365 in the beginning of 2006. Series ends at about 325. Mexico increases to about 350 in the beginning of 2006. Series ends at about 325. Asian emerging-market economies decrease to about 97 by mid-2003. Series increases to about 240 365 in the beginning of 2006. Series ends at about 200. NOTE: The data are weekly. The last observation for each series is the average for July 10 through July 12, 2006. The Asian emerging-market economies are China, Hong Kong, India, Indonesia, Malaysia, Pakistan, the Philippines, Singapore, South Korea, Taiwan, and Thailand; each economy’s index weight is its market capitalization as a share of the group’s total. SOURCE: For Asian emerging-market economies, Morgan Stanley Capital International (MSCI) index; for others, Bloomberg L.P.

Industrial Economies

The Japanese economy has continued to strengthen this year, although economic growth has stepped down a bit from the comparatively strong rate recorded in 2005. Household consumption maintained a solid rate of growth in the first quarter, and private investment spending rose 11 percent. However, net exports, which previously had been an additional source of strength, did not contribute to growth in the first quarter; the growth of imports increased while export growth remained firm. The labor market in Japan improved further in April and May: The unemployment rate fell to 4 percent, and the ratio of job offers to applicants reached a thirteen-year high. Although the GDP deflator has continued to decline, other signs indicate that deflation is ending. In the first quarter of 2006, land prices in Japan's six largest cities rose 3.8 percent over their year-ago level, the first increase since 1991. Core consumer prices have shown small twelve- month increases over the past several months.

Real GDP in the euro area accelerated in the first quarter, expanding 2-1/2 percent, a rate of growth somewhat above its average in recent years. The acceleration was spurred by strength in domestic demand, especially private consumption spending, which increased in the first quarter at double its pace in 2005. Retail sales were also strong at the start of the second quarter. The revival in household spending has been supported by a small rise in the growth rate of employment and by an improvement in employer and consumer perceptions of employment prospects. Private investment spending has remained strong in the euro area, and business sentiment has continued to brighten in recent months. Energy price increases have pushed euro-area consumer price inflation to about 2-1/2 percent recently, a level above the ECB's 2 percent ceiling, but core inflation has remained near 1-1/2 percent.

In the United Kingdom, real GDP expanded at an annual rate of 3 percent in the first quarter after rising about 1-3/4 percent in 2005. Consumer spending grew about 1-1/2 percent, the same moderate pace seen last year. House prices, which remained relatively flat during late 2004 and most of 2005, picked up in late 2005 and have continued to rise in the first half of this year. The twelve-month change in consumer prices was 2.2 percent in May. Consumer prices have been boosted importantly by increases in energy prices over the past several months.

In Canada, real GDP grew at an annual rate of nearly 4 percent in the first quarter, an increase led by a jump in spending on consumer durables and housing. Investment in residential structures grew at its fastest rate in more than two years, and business investment continued to exhibit the strength observed in the previous two quarters. Indicators for the second quarter point generally to a deceleration of GDP. Housing starts in the second quarter were significantly below their elevated first-quarter levels; the merchandise trade balance declined, on balance, during the first five months of this year; and in the manufacturing sector, the volume of new orders and of shipments both fell in April. In contrast, in the second quarter, the labor market maintained its strength of the past year, and the unemployment rate has fallen to 6.2 percent, the lowest level in more than thirty years. Consumer prices rose 2.8 percent in the twelve months ending in May.

Emerging-Market Economies

In China, growth of real output was especially robust in the first half. Economic indicators suggest that fixed investment surged and that export growth continued to be strong. The rapid growth of investment prompted the Chinese government to impose a series of new measures to slow capital spending, including controls on credit and land use and stricter criteria for approving investment projects. In addition, to restrain credit, which has soared more than 15 percent over the past year, China's central bank raised the one-year bank lending rate in April and raised banks' reserve requirements 1/2 percentage point in June. The Chinese trade surplus widened in the first half of this year as exports accelerated. Chinese consumer price inflation is about 1-1/2 percent, slightly above its pace in the second half of last year but well below the more than 5 percent rate seen in 2004.

Economic growth in India, Malaysia, and Hong Kong also was quite strong in the first quarter, although the pace of activity of some of the other Asian emerging-market economies has moderated a bit from last year's rapid rate. Concerns about inflationary pressures have increased, largely because of rising energy prices. In response, monetary policy has been tightened in some countries, including Korea, India, and Thailand.

In Mexico, strong performance in the industrial sector, an expansion in services output, and a recovery in agricultural production propelled real GDP growth to more than 6 percent at an annual rate in the first quarter. In addition, a surge in manufacturing exports boosted Mexico's trade and current account balances noticeably. Industrial production continued to increase early in the second quarter. In June, Mexican inflation was 3.2 percent, just above the center of the Bank of Mexico's target range of 2 percent to 4 percent. After easing policy nine times between August and April, the Bank of Mexico signaled in April that it would leave its policy rate unchanged for a time.

Real GDP growth in Brazil also increased in the first quarter, rising to 5-3/4 percent, and was supported by very strong performances in manufacturing, mining, and construction. The rate of inflation has been declining from a high of 8 percent reached in April 2005; in June, the twelve-month change in prices edged down to 4 percent. In late May, the central bank reduced its target for the overnight interest rate 50 basis points, to 15-1/4 percent, bringing the cumulative decline to 450 basis points since the current easing phase began last September. In the minutes of its late-May meeting, the policymaking committee said that the onset of market volatility over the past month had increased its uncertainty about the prospects for inflation and had thus prompted it to ease less than it would have otherwise.

In Argentina, output growth slowed slightly in the first quarter. Amid emerging capacity constraints, inflation rose to about 11 percent, up from 6 percent in 2004. The Argentine government has tried to hold down inflation, with limited success, through voluntary price agreements in several sectors.


Footnote

1.   The Bureau of Labor Statistics (BLS) developed a new ECI series and has provided data for the changes in that seires beginning in 2001. The BLS considers the new ECI to be continuous with the old series.  Return to text

2.   These are services--such as foreign travel or the financial services provided by banks--for which no prices based on market transactions are available; the Bureau of Economic Analysis must impute or estimate these price indexes.  Return to text


Section 1 | Printable Version (340 KB PDF)


Home | News and events | Monetary policy | July 2006 report
Accessibility | Contact Us

Last update: July 19, 2006