| Remarks by Vice Chairman Roger W. Ferguson, Jr. To the Andrew Brimmer Policy Forum: National Economic and Financial Policies for Growth, Employment, and the Improvement of Equity, at the 2005 Annual Convention, Allied Social Science Associations, Philadelphia, Pennsylvania January 7, 2005 Interpreting Labor Market Statistics in the Context of Monetary Policy |
|
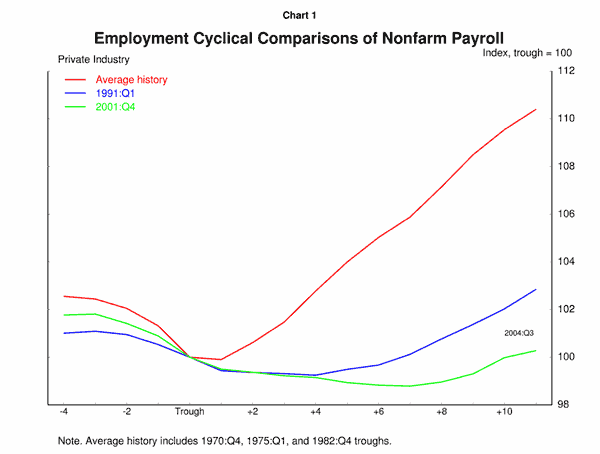
In assessing the appropriate stance of monetary policy, policymakers must come to some judgment about the likely future course of economic performance and, especially, of inflation. To make this judgment, we find a useful concept to be the level of economic slack--defined as the difference between the current level of output and the level of output the economy could produce if all available resources were fully utilized. In many standard models of inflation, an economy operating above its potential is associated with upward pressure on inflation, and an economy operating below its potential is associated with downward pressure on inflation. Unfortunately, economic slack cannot be measured directly but must instead be inferred from the variables we do observe. Labor market measures have traditionally been a valuable source of information about economic slack. In particular, statistics like the unemployment rate can tell us something about the amount of available, but as yet unused, labor in the economy. But even this relation--between the unemployment rate and the concept of economic slack--is not necessarily constant, and thus a given unemployment rate may not indicate the same level of slack at two separate times. For example, shifts in the composition of unemployed individuals across different skill levels, industries, or occupations relative to the demand for workers with these characteristics can complicate this relationship, as can changes in the behavior of the individuals who are out of work. Moreover, the possibility of a change in the relationship between the unemployment rate and economic slack is likely to be greater--and thus the signals from the labor market may be harder to read--when the labor market behaves atypically, as in many respects it has behaved over the past three years. A particular question that is difficult to answer is whether the slow recovery of employment has left significant underutilized resources in the economy that could be readily re-employed, or whether the lag in hiring indicates that the supply of those resources is relatively less forthcoming given the state of demand? In this context, I would like to discuss two aspects of the recent labor market downturn that have received considerable attention and that have the potential to alter the relation between economic slack and the unemployment rate. The first is the possibility that the extended weakness in the labor market reflects permanent shifts in the composition of jobs--which is often referred to as industrial restructuring. The second development I will address is the decline in labor force participation in recent years.1 I should note, my comments today reflect only my views and should not be taken to represent the views of my colleagues on the Board of Governors or in the Federal Reserve System. Industrial Restructuring To many observers, the coincidence of a large share of permanent job losses and sluggish job creation indicates a pronounced shift in the optimal allocation of workers across firms or industries--that is, an elevated pace of economic restructuring. The basic story is as follows: Permanent reductions in employment in declining industries require workers to search for new jobs, a process made difficult and more time consuming by the likelihood that the skills these workers acquired on their previous jobs may be ill-suited to sectors of the economy in which labor demand is rising. Although some workers may accept whatever job is available--whether or not it meets their longer-run expectations for wages, benefits, or stability--our unemployment insurance system provides enough protection that many will search longer for a good match and thus remain out of work longer. Moreover, creating new jobs in expanding industries requires businesses to invest, and the most recent recovery was marked, for some time, by a reluctance of businesses to do so. A slowing in the pace of job creation resulted in limited new opportunities available to these displaced workers. Though these stories sound plausible, restructuring is, in practice, difficult to measure, and alternative measurement techniques have led to very different conclusions about the amount of restructuring that has occurred in recent years.2 Taking a somewhat different approach than previous analyses, we attempted to identify those industries that have performed especially poorly since the 2001 business cycle peak and assess whether these underperforming industries have been characterized by restructuring. We judged the performance of each industry according to two criteria: (1) an industry�s net employment change from March 2001 to November 2004, and (2) the change in an industry�s share of total employment between March 2001 and November 2004 compared with the change in employment shares exhibited over a pre-peak period of similar length.3 Table 1 ranks the performance of two-digit NAICS industries since March 2001 according to the first measure of underperformance. In an absolute sense, the poorest performing industries include durable and nondurable manufacturing, the information sector, retail trade, transportation and warehousing, and professional and technical services. Moreover, four of those six industries--durable manufacturing, information, transportation and warehousing, and professional and technical services--also ranked among the six poorest performers according to the second criterion, which is based on relative performance.
Table 1
Note: Underlined industries ranked poorly according to both measures of underperformance
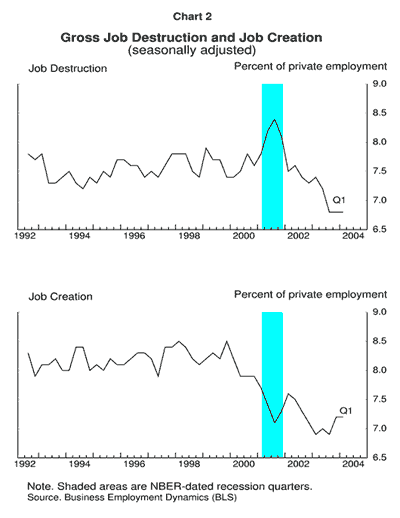
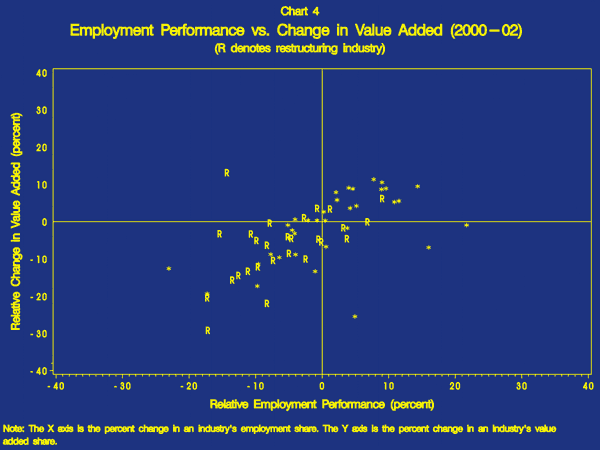
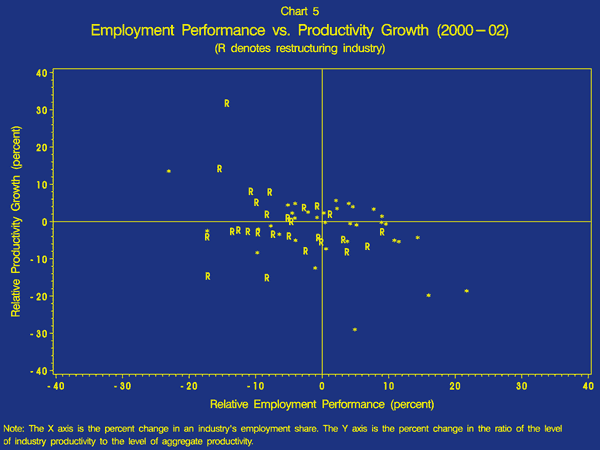
Anecdotally, most of these industries can be associated with elements of restructuring. Within the information industry, for example, telecommunications has suffered from overcapacity--and significant downsizings or business failures--since the cyclical peak. Similarly, transportation includes the airline industry in which many firms have been under stress, and professional and technical services includes several industries that complement business investment and likely suffered in the wake of the sharp slowing in spending on equipment and software early this decade. Within durable goods manufacturing, computers and electronics, primary and fabricated metals, and machinery rank particularly poorly according to our criteria of underperformance, and these industries have also been identified with restructuring in recent years. Corroborating this anecdotal evidence, the durable manufacturing, information, and professional and technical services industries are also among the top six contributors to the post-peak increase in the aggregate permanent layoff rate. These underperformers are also at the top of the list of industries that experienced significant rates of job destruction during the labor market downturn of 2001 and 2002. In fact, the four industries that, according to our two criteria, were the key underperformers in recent years more than accounted for the overall increase in the average pace of job destruction between 1998-2000 and 2001-02. Finally, the relationship between our measures of underperformance and industry productivity growth is also informative about the importance of restructuring. Typically, productivity falls with employment in recessions, as firms--hesitant to sever ties to workers who will be valuable to them when demand recovers--reduce employment less than output. However, if firms perceive changes in demand to be permanent, the reluctance to reduce employment in proportion to output should diminish. In fact, productivity growth from 2000 to 2002 in the four key underperforming industries was not lower, on average, than in industries not experiencing large reductions in labor demand, supporting the notion that firms in these industries believed demand changes to have been permanent. Moreover, labor market underperformance, in general, was associated with slightly greater productivity growth between 2000 and 2002; this association suggests that underperforming industries reacted to changes in labor demand by destroying their least productive jobs--which is also consistent with the restructuring hypothesis. If our hypothesis that restructuring is associated with our four key underperforming industries is correct, the influence of this restructuring on aggregate labor market outcomes would be substantial. These industries, though together composing just 25 percent of private employment, accounted for net job losses totaling nearly 2.6 million from the March 2001 business cycle peak through November 2004 (compared with a net decline of 1.2 million jobs for the private sector as a whole) and for about half the deterioration in the average monthly employment change over this period relative to the average pace before the peak. Given this evidence that restructuring has been a notable feature of the labor market landscape in recent years, it is also worth assessing the relevance of some possible explanations for the high proportion of permanent job losses over this period. These explanations include technological change, international competition, offshoring of less productive jobs, and large industry-specific demand shocks, perhaps related to the 2001 terrorist attacks or the earlier overoptimism in the high-tech sector. To gauge the importance of these various explanations, we first examined the relationship between industry employment and industry output using data for sixty three-digit NAICS industries. As can be seen in chart 4, which plots the change in employment shares from 2000 to 2002 against the change in value added shares over the same period, there is a strong positive correlation between these changes, both for all industries and for the subset of industries that make up the four restructuring sectors we identified previously. In the chart, industries in this subset, designated with an R, are bunched in the lower left quadrant--an indication that most experienced declines in both employment and output shares over this period. These positive correlations suggest that restructuring has been caused mainly by adverse industry demand shocks rather than by positive supply shocks, although as I will highlight later, there are some exceptions. One possible source of these adverse demand shocks is increased international trade. To assess the potential relationship between international trade and restructuring, we examined correlations between changes in import and export shares and changes in employment shares for two-digit manufacturing industries for the period from the start of the recession to the third quarter of 2004. We found it difficult to discern any clear relationship in the data; this lack of clear relationship suggests that international trade has not been an important determinant of the recent pattern of underperformance in the labor market. Martin Baily and Robert Lawrence (2004) present a much more thorough analysis of this issue and come to a similar conclusion.4 To investigate further the relationship between restructuring and labor productivity, we compared the performance of industry employment to the performance of industry productivity for the period from 2000 to 2002 (chart 5). The fact that some industries experienced large declines in employment share and well-above-average gains in productivity suggests that adverse demand shocks may not be the only source of restructuring. Indeed, these industries include computer systems design, information and data-processing services, and publishing (which includes software)--all high-tech categories that have been associated either with positive technology shocks or with the outsourcing of low-productivity jobs. Overall, the evidence points to several tentative conclusions. First, although a period of permanent employment declines is admittedly difficult to distinguish from an extended period of cyclical weakness, the data, on balance, seem to indicate that restructuring has been an important characteristic of the post-2000 labor market downturn. Second, except for a few high-tech industries, restructuring appears to have been caused primarily by adverse shifts in the demand for the output of restructuring industries rather than by positive supply shocks. Finally, any slowing of the current labor market recovery from restructuring, if indeed restructuring has played such a part, has likely been due to a slow transition of workers from restructuring industries to expanding industries rather than a slow pace of restructuring in declining industries. The last conclusion is based on the absence of a positive relation between employment share changes and industry productivity growth and on the high rates of job destruction in underperforming industries, both of which suggest that restructuring industries responded aggressively to adverse demand shocks.
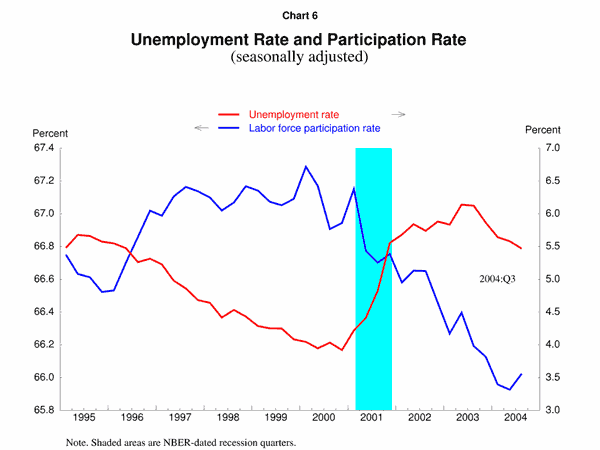
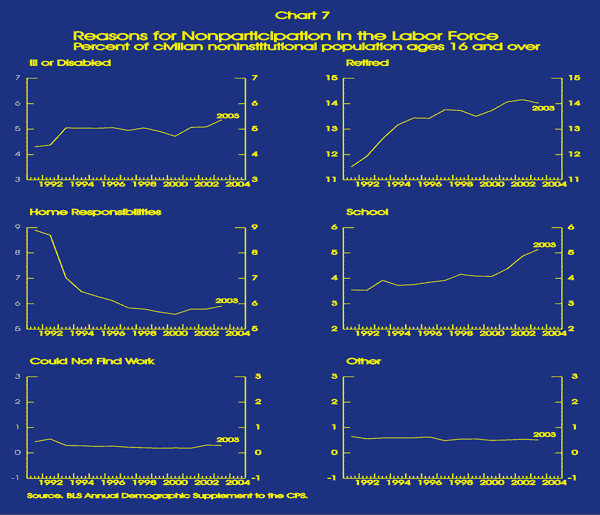
Labor Force Participation Distinguishing very long-term or permanent changes in labor supply from cyclical movements is difficult, but some information can be brought to bear on this issue. First, demographic changes seem not to be an important explanation of the decline in the participation rate. In general, one might expect the aging baby-boom generation to put downward pressure on the participation rate, as this cohort moves into their retirement years during which participation rates have traditionally been lower. Although this possibility is clearly a concern for the future, changes in the age composition of the population have, thus far, not accounted for much of the drop in the participation rate. Instead, the low participation rate reflects pronounced declines in participation rates for a number of demographic groups, most notably teenagers and young adults, as well as individuals between the ages of 25 and 44. In addition, as can be seen in chart 6, the timing of the downturn in labor force participation lines up closely with the weakening of economic activity that began in the second half of 2000. This concordance suggests that the recent weakness in participation is more likely to be associated with this business cycle than with an emerging downward trend, although one obviously cannot rule that out. Finally, we can perhaps learn something from the reasons that individuals give for being out of the labor force. As shown in chart 7, the proportion of the population who say that they are out of the labor force because they cannot find a job has increased only slightly. Instead, the rise in nonparticipation since 2000 is associated with an increase in the proportions of individuals attending school, reporting themselves as ill or disabled, or retired. Whether these patterns are more indicative of cyclical or of structural changes in participation is difficult to pin down, however. Although the absence of a sizable increase in discouraged workers might be viewed as evidence against a cyclical interpretation, the rise in school enrollment may reflect a decline in the opportunity cost of attending school associated with the lack of new job opportunities in a weak labor market. Similarly, the increase in disability rates--or even, to some extent, retirement rates--could have both cyclical and structural elements. In sum, the available information is far from definitive. The absence of any clear demographic shift suggests that at least some portion of the unusually large declines in labor force participation has been associated with this business cycle. Nevertheless, individuals who have recently exited the labor force likely have weaker ties to the labor market than currently unemployed individuals. Thus, it is an open question how quickly, if at all, recent increases in nonparticipation due to schooling, disability, or retirement will be reversed.
Restructuring and Participation To investigate this possibility further, we examined data from the most-recent displaced worker survey. Table 2 shows the proportions of displaced workers from restructuring and nonrestructuring industries (according to our classification scheme), as well as the shares of employment for these two groups of industries.5 Qualitatively, the data are similar to those I have already presented: Displaced workers come disproportionately from restructuring industries. Of course, since more than half of displaced workers come from other industries, restructuring at the industry level is, by no means, the only cause of worker displacement. It is also true that displaced workers were more likely than other job losers to have been out of the labor force in January 2004. Putting these facts together, it would not be unreasonable to infer a linkage between restructuring and the decline in the participation rate.
Table 2
Source: Displaced Worker Supplement to the CPS.
The Labor Market and Monetary Policy In such a situation, I view the conduct of monetary policy as a balancing of risks. One risk is that industrial restructuring has been quite extensive. Because restructuring decreases the value of human capital that is specific to downsizing industries, it acts, in effect, as a negative supply shock, temporarily depressing the level of employment as the workers displaced by restructuring must either search longer to find a job appropriate for their skills or seek retraining. An additional risk is that declines in labor force participation have been predominantly structural, so that many of the individuals who have exited the labor force over the past three years will be unlikely to return, at least in the near-term. Under such conditions, the amount of economic slack could be very small, and thus expansive monetary policy could lead to a pickup in inflationary pressures. Alternatively, restructuring, though ongoing, may have resulted in relatively little mismatch between the skills needed in restructuring industries and the skills demanded in expanding industries and, thus, should not impede job creation. In addition, although the prolonged slow recovery in hiring may have taken a greater toll on worker confidence than in earlier cycles, those workers who have recently exited the labor force may not have significantly reduced their availability for work. In this scenario, a substantial pool of unused labor may remain in the labor market, and an overly restrictive monetary policy would prevent the economy from moving as quickly as possible to the level of full employment. As you can see, transforming the information available from published statistics into concepts useful for assessing the consequences of monetary policy is, in fact, quite complex. And, the evidence is more ambiguous than one would like, indicating that it would be unwise to assume that labor market indicators are complete predictors of slack. Nevertheless, I believe that our ability to interpret labor market statistics will continue to benefit greatly from additional research on the topics I have discussed today and from the exchange of ideas that this type of forum encourages.
Charts
References Aaronson, Daniel, Ellen R. Rissman, and Daniel G. Sullivan (2004). �Can Sectoral Reallocation Explain the Jobless Recovery?� (997 KB PDF) Federal Reserve Bank of Chicago, Economic Perspectives, vol. 28 (Second Quarter), pp. 36-49. Baily, Martin Neil, and Robert Z. Lawrence (2004). �What Happened to the Great U.S. Job Machine? The Role of Trade and Electronic Offshoring,� paper presented at the Brookings Panel on Economic Activity, Brookings Institution, Washington, September. Groshen, Erica L., and Simon Potter (2003). �Has Structural Change Contributed to a Jobless Recovery?� Federal Reserve Bank of New York, Current Issues in Economics and Finance, vol. 9 (August), pp. 1-7.
Footnotes 1. My presentation today is based on work with Andrew Figura, Bruce Fallick, and William Wascher. Return to text 2. For example, both Groshen and Potter (2003) and Aaronson, Rissman, and Sullivan (2004) construct summary measures of the extent of restructuring. While the Groshen-Potter measure shows an elevated level of restructuring in recent years, the Aaronson-Rissman-Sullivan measure indicates that the labor market has not experienced an unusual amount of restructuring recently. These authors will present updates of their earlier research at these meetings. Return to text 3. The latter measure helps to distinguish industries that are in long-term decline (for example, textiles) from the industries that may have experienced a more recent episode of restructuring. It also allows us to identify those industries that have had upward trends but that have experienced a period of relatively weak job growth in recent years. Return to text 4. The criteria we use to identify restructuring industries are not designed to capture long-standing restructuring associated with foreign competition, such as in the textile industry. Also, both anecdotal evidence and the Bailey and Lawrence study suggest that foreign competition in the past couple of years has been an important factor for some industries. Return to text 5. Displaced workers are defined here as those individuals who, at some point between 2001 and 2003, permanently lost a job on which they had at least three years of tenure. Return to text |
| |