In this appendix, we describe in detail the model simulations used in Vice Chairman Ferguson's speech on the U.S. current account deficit.1 For these simulations, we used the FRB/Global model to assess the following five explanations for the deterioration in the trade balance that has occurred since 1997: expansionary fiscal policy, an autonomous decline in the private saving rate, an acceleration in productivity, an autonomous decline in foreign investment, and improved global financial intermediation that reduces the risk premium for holding U.S. assets. We describe our methodology for estimating the magnitude of each of these shocks over the simulation period (1997-2004) and then discuss the effects of each of these shocks on key U.S. variables, including the trade deficit.
The FRB/Global model is a large-scale macroeconomic model consisting of thirty country blocks. The U.S. block of FRB/Global is taken from the staff's domestic model, FRB/US, which has extensive sectoral coverage. Our procedure for estimating the shocks takes advantage of FRB/Global's ability to exactly track the historical path of all its variables, as each equation is either an identity or an estimated behavioral equation with a residual. Thus, the first step in our estimation procedure is to calculate the full set of residuals so that the model's simulated path matches the actual data over the 1997-2004 period.
The next step is to recalculate the appropriate residuals for each scenario under the assumption that the shock never occurred. For the productivity and fiscal shocks, we have reasonably good measures of the magnitude of these shocks. According to data from the Bureau of Labor Statistics, multifactor productivity growth for the 1996-2004 period was about 1.1 percent, compared with 0.5 percent over 1973-1996. On the basis of these data, we reversed the shocks to productivity by recalculating the innovations to productivity so that they imply slower growth of 0.6 percent per year in trend multifactor productivity. We base our measure of the exogenous shocks to fiscal policy on estimates by the staff of the Federal Reserve Board. These estimates suggest that the structural increase in government spending since 2001 is about 1 percentage point of GDP and that the structural fall in personal tax revenues since 2001 has been about 2 percentage points of GDP. Accordingly, our fiscal shocks begin in 2002 and are roughly consistent with these fiscal policy changes.
We have no reliable estimates of the magnitude of exogenous shocks to U.S. private saving, foreign investment, and the risk premium on U.S. assets. We estimate these three shocks by simulating the model so that--in their absence, and in the absence of the fiscal and productivity shocks--the broad real dollar, the national saving rate, and the share of investment to GDP in the G-7 countries (excluding the United States) and developing Asia (excluding China) would have remained unchanged at their 1996 levels. In doing so, we assume that these five shocks are uncorrelated with each other and with the other residuals in the model.2 It is important to note that this way of estimating these three shocks does not provide a basis for giving each shock a unique interpretation. For example, to the extent that other factors besides improvements in financial intermediation led to an autonomous decline in saving in the United States, the shock we identify would commingle these factors with the change in financial innovation.
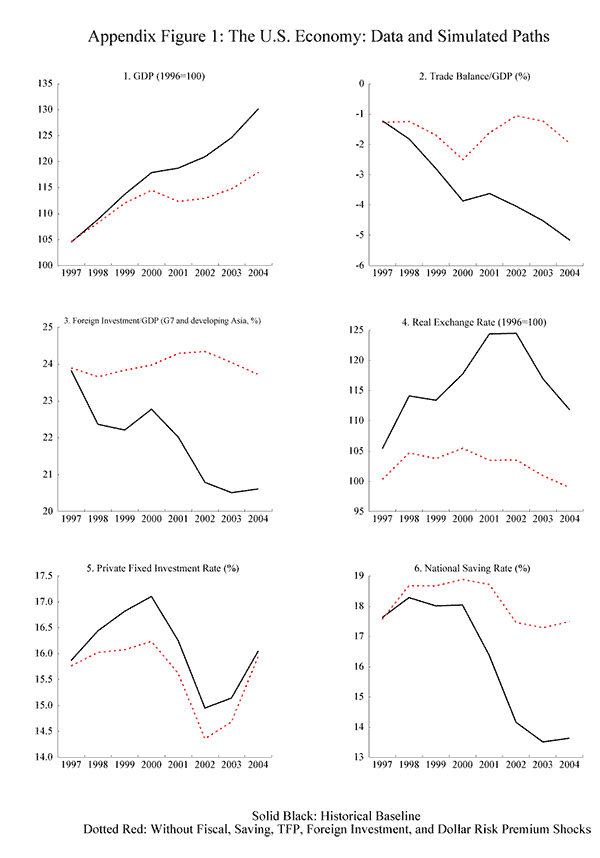
The solid lines in appendix figure 1 show the historical path of the level of U.S. GDP, the trade balance expressed as a fraction of GDP, a weighted average of investment shares in the non-U.S. G-7 and developing Asian countries (excluding China), the broad real dollar, the ratio of private investment to GDP, and the national saving rate. As mentioned above, we have determined the residuals in the model so that in the presence of our five shocks, the model exactly tracks the historical path. The dotted red line shows the paths of these variables in the absence of the five shocks we consider. In these simulations and in simulations to follow, we assume that monetary policy in the United States and major foreign countries is set according to a Taylor rule, with the exception of China, Hong Kong, and Malaysia. These countries are assumed to peg their currencies to the U.S. dollar.
Overall, the five shocks account for a substantial part of the deterioration in the trade balance. In the absence of the shocks, the trade deficit would have remained at about 2 percent of GDP instead of deteriorating to more than 5 percent in 2004.
The solid line in the middle right panel of appendix figure 1 shows that the broad real dollar rose on balance over the simulation period, peaking in 2001 about 25 percent above its 1996 level before declining somewhat thereafter. The national saving rate fell about 4 percentage points over the simulation period, and the foreign investment rate in the G-7 and developing Asia, on average, has dropped about 3 percentage points since 1996. By construction, these five shocks completely account for the deviation of the real exchange rate, the saving rate, and the foreign investment rate from their levels in 1996; as shown by the dotted red lines, these variables would have remained unchanged in the absence of the shocks.
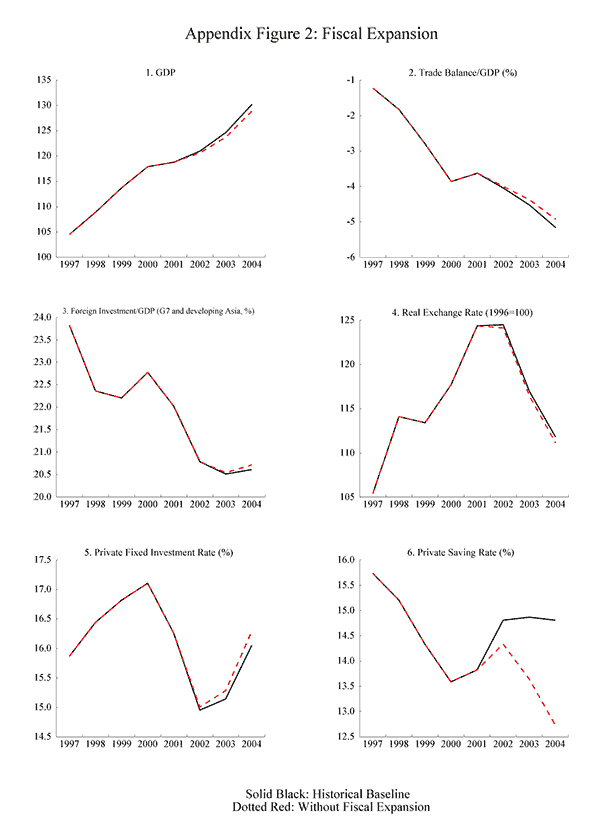
Appendix figure 2 highlights the partial effects of the government spending and tax rate shocks. The dashed line in each panel shows the effects of reversing these shocks starting in 2002, while the solid line, as in appendix figure 1, shows the historical path for each variable. We reverse the fiscal policy shocks by assuming that in the absence of the endogenous adjustment of factors that influence fiscal policy, government spending as a fraction of GDP would have been 1 percentage point lower by the end of 2004 and personal tax revenues as a fraction of GDP would have been 2 percentage points higher by the end of 2004. Both of these shocks begin in 2002:Q1 and are phased-in evenly so that it takes three years for their full effects to be realized.
The top right panel of appendix figure 2 shows that the fiscal expansion had only a modest effect on the trade deficit, while GDP was less than 1 percentage point higher in 2004 than if the fiscal shocks had not occurred. This rise in GDP is partially muted by tighter monetary policy as long-term real rates (not shown) increase relative to their counterfactual path in response to expansionary fiscal shocks; accordingly, "crowding out" of private domestic demand occurs. Private fixed investment as a share of GDP is somewhat lower, and private saving as a fraction of GDP is more than 2 percentage points higher than in the absence of the fiscal policy shocks. This crowding out of private domestic demand accounts for the modest effect of the fiscal policy shock on the trade balance.
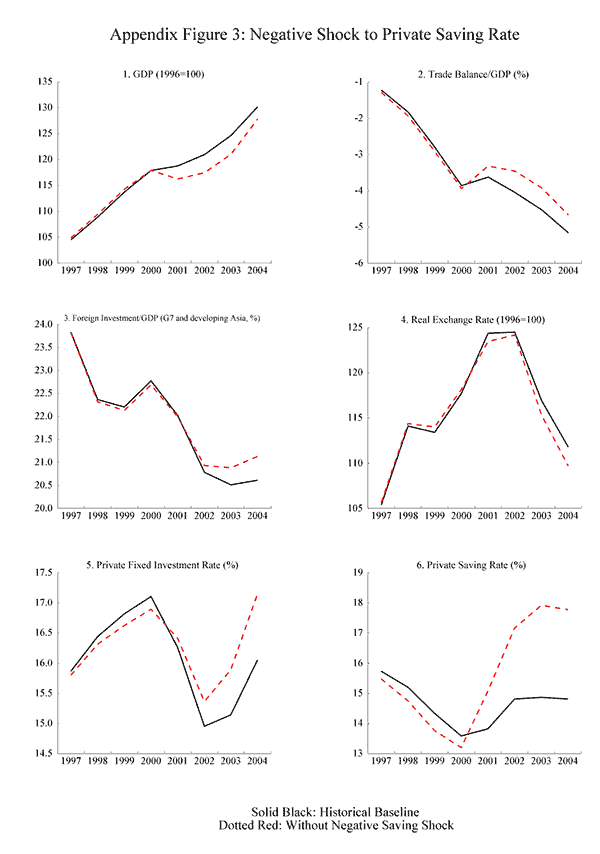
The dashed lines in appendix figure 3 show the effects of excluding the autonomous shock to the U.S. private saving rate.3 Our estimates suggest that these shocks reduced the private saving rate more than 2 percentage points beginning in 2002. As did the expansionary fiscal shocks, these shocks had only a modest effect on the trade balance because they also induce a rise in output and a tightening of monetary policy that reduces investment and the endogenous portion of consumption. In this case, the increase in the long-term real rate is larger than in the case of expansionary fiscal shocks and is associated with more crowding out of investment.
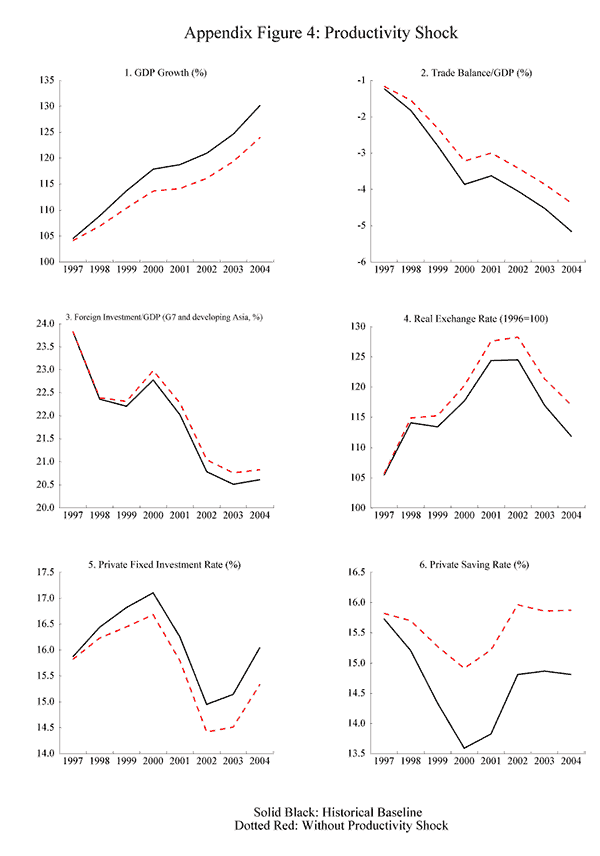
The dashed lines in appendix figure 4 show the effects from simulating the model in the absence of the productivity shocks. These shocks raised the growth rate of trend multifactor productivity 0.6 percentage point per year over the simulation period. Our simulation suggests that the productivity acceleration played an important role in the deterioration of the trade balance, as the trade deficit expressed as a fraction of GDP is about 1 percentage point larger in 2004 than in the counterfactual simulation that excludes the rise in productivity growth. Faster productivity growth boosts the rate of return on investment and increases household income; therefore, the investment share is almost 1 percentage point higher, and the private saving rate is more than 1 percentage point lower, in 2004 in response to the shocks.
As noted in the Vice Chairman's speech, the effect on the trade balance of the productivity acceleration would be even larger if the increase in productivity generated a rise in the broad real dollar. The real exchange rate depreciates in response to the higher productivity growth because the rise in aggregate demand is not large enough to put upward pressure on inflation (in fact, inflation declines as higher productivity lowers unit labor costs). The fall in inflation puts downward pressure on real interest rates relative to foreign real rates (which increase in response to the stimulative effects of stronger U.S. growth on foreign activity) and leads to a fall, rather than a rise, in the dollar.
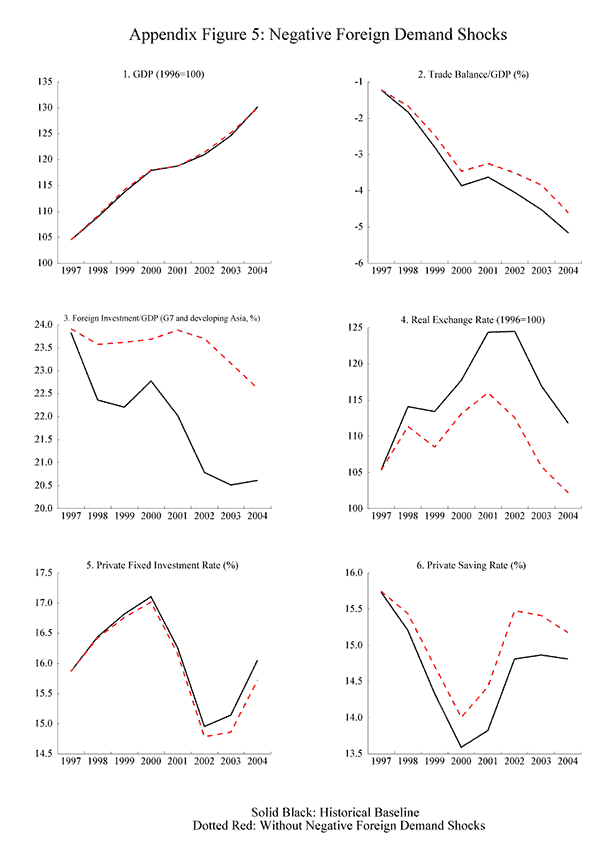
Appendix figure 5 shows the effects of the foreign demand shocks. We estimated these shocks to have depressed the investment rate in the non-U.S. G-7 and in developing Asia economies about 2 percentage points, on average, over the simulation period. These shocks reduce the level of foreign GDP, contributing to lower interest rates abroad and a real appreciation of the dollar. Thus, both weaker foreign activity and the dollar appreciation contribute to a widening of the trade deficit, which as a percentage of GDP is about 0.5 percentage point larger in 2004 than in the absence of the negative foreign investment shocks.
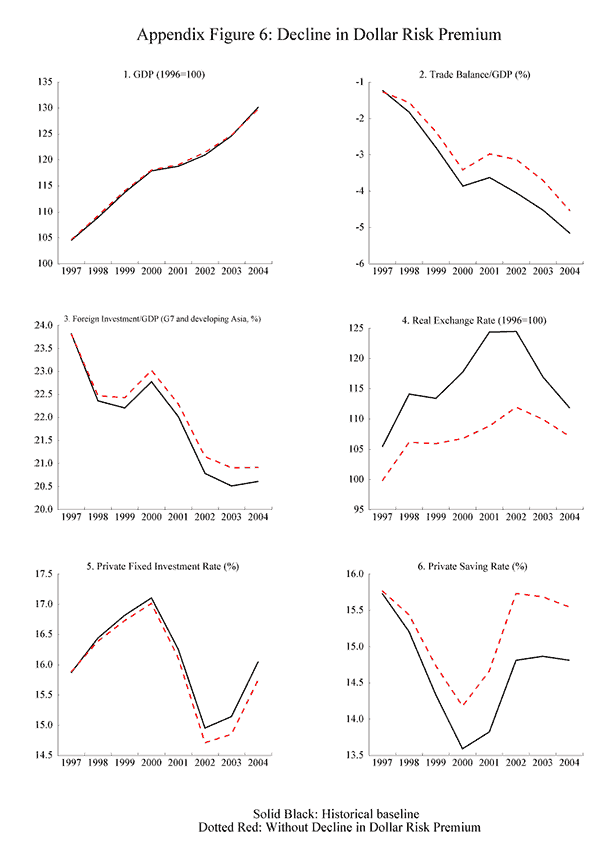
Our final simulation considers the effects of the risk-premium shocks on U.S. dollar-denominated assets. As shown by the middle right panel of appendix figure 6, our estimates suggest that these shocks accounted for a substantial part of the appreciation in the real dollar during the 1997-2004 period. This appreciation, by inducing substitution away from U.S.-produced goods into foreign products, contributes to a widening in the trade deficit, which we estimate to be around 0.5 percentage point larger as a percentage of GDP in 2004 because of the risk-premium shocks.
Footnotes
1. This appendix was prepared by Christopher Erceg, Luca Guerrieri, and Christopher Gust, of the Board's Division of International Finance. Return to text
2. At the end of the Vice Chairman's speech, he notes that some of the developments that led to the deterioration in the current account may have a common underlying cause. This could suggest that treating the shocks as independent of one another in our estimation procedure might be inappropriate. However, we surmise that if we allowed for the five shocks we considered to be correlated, it would make little difference to our results. Return to text
3. As discussed earlier, the shock to private saving has been estimated as that required, along with the other shocks in this exercise, to explain the overall decline in the national saving rate since 1996. As the decline in the national saving rate may be attributable to other factors not fully accounted for, we might be overstating its magnitude. Accordingly, the effect of the private saving shock on the trade balance could be even smaller than the modest effects we report. Return to text

