
Board of Governors of the Federal Reserve System
International Finance Discussion Papers
Number 1034, Novemeber 2011--- Screen Reader
Version*
Loose Commitment in Medium-Scale Macroeconomic Models: Theory and Applications**
NOTE: International Finance Discussion Papers are preliminary materials circulated to stimulate discussion and critical comment. References in publications to International Finance Discussion Papers (other than an acknowledgment that the writer has had access to unpublished material) should be cleared with the author or authors. Recent IFDPs are available on the Web at http://www.federalreserve.gov/pubs/ifdp/. This paper can be downloaded without charge from the Social Science Research Network electronic library at http://www.ssrn.com/.
Abstract:
This paper proposes a method and a toolkit for solving optimal policy with imperfect commitment. As opposed to the existing literature, our method can be employed in medium- and large-scale models typically used in monetary policy. We apply our method to the Smets and Wouters (2007) model, where we show that imperfect commitment has relevant implications for interest rate setting, the sources of business cycle fluctuations, and welfare.
JEL classification: C32, E58, E61.
Keywords: Commitment, Discretion, Monetary Policy
1 Introduction
In the modern macroeconomic literature, economic outcomes result from the interactions between policymakers and rational firms and households. A common feature of these models is that economic decisions (e.g. consumption, hours worked, prices) depend on expectations about future policies (e.g. taxes, interest rates, tariffs). As shown by Kydland and Prescott (1977) optimal policy plans in this class of models are subject to time-inconsistency.
The modern literature has taken different approaches to address this problem. One possibility is to assume that policymakers can fully commit - a single optimization is undertaken and the chosen policies are then implemented in all subsequent periods. This approach is known as full-commitment or simply commitment. An alternative, often referred to as discretion or no-commitment, assumes that policymakers can not commit and that policy plans always need to be time-consistent. Although many types of time-consistent equilibria can be studied, one of the most common approaches is to solve for Markov-perfect equilibria, where policy functions only depend on payoff relevant state variables.
Both the full-commitment and discretion approaches are to some extent unrealistic. Commitment does not match the observation that governments and other institutions have defaulted on past promises. Discretion rules out the possibility that governments achieve the benefits of making and keeping a promise, despite the ex-post incentive to renege. Roberds (1987) developed an approach - recently extended by Schaumburg and Tambalotti (2007) and Debortoli and Nunes (2010a)- which escapes the "commitment vs discretion" dichotomy. Policymakers are endowed with a commitment technology, but with some exogenous and common knowledge probability they may succumb to the temptation to revise their plans. This approach has been labeled quasi-commitment or loose commitment.
Several questions can be addressed with the loose commitment approach. What are the gains of achieving more credibility? How does the possibility of future re-optimizations affect current outcomes and promises? What are the consequences of revising policy plans? How do occasional re-optimizations affect the shock propagation, volatilities, and cross-correlations between relevant variables? To answer these questions and derive the associated positive and normative implications, one must depart from the frameworks of commitment and discretion and consider instead loose commitment.
Nevertheless, due to some technical difficulties, the loose commitment approach has so far been limited to relatively simple and stylized models. The goal of this paper is to overcome this limitation. We propose a simple and relatively general algorithm to solve for the optimal policy plan under loose commitment in medium- and large-scale models typically used for monetary policy analysis. We show how these types of problems reduce to solving a system of linear difference equations, and do not present any additional challenge with respect to the commitment or discretion cases.
Our framework allows us not only to address the questions posed in complex monetary policy models, but also to pose new questions and examine how additional economic features interact with imperfect commitment. For instance, central banks often and carefully devise communication strategies where future actions may be revealed to the public. In one of our applications we distinguish the shocks that require more commitment and may call for a more detailed planning and communication strategy.
Assuming plans' revisions to be stochastic events, rather than endogenous decisions, is clearly a simplification analogous in spirit to the Calvo pricing model. While more complex credibility settings can be easily imagined (e.g. an endogenous timing of re-optimizations), such complexity may become prohibitive in medium- and large-scale models. In those type of models, the tractable though simplified approach employed here is particularly valuable.
This paper is related to the literature on optimal monetary policy in linear quadratic frameworks. Solution algorithms for full-commitment, together with a discussion about the computational aspects, have been developed by Currie and Levine (1993) and Soderlind (1999), among others. Methods to solve for (Markov-perfect) time-consistent equilibria are described in Backus and Driffill (1985), Soderlind (1999), and Dennis (2007). The main contribution of our paper is to extend these methodologies to address problems under loose commitment. To illustrate the benefits of our approach, the methodology is then applied to analyze the effects of commitment in the medium-scale model of Smets and Wouters (2007), which has arguably become one of the benchmark models in the dynamic stochastic general equilibrium literature.1
The paper continues as follows. In section 2 we introduce the general formulation of the model. In section 3 we study the optimal policy problem and describe the solution algorithm. Section 4 discusses the role of commitment in the Smets and Wouters (2007) model and section 5 concludes. We provide as supplementary material a collection of codes and documentation that implement our algorithm in a variety of models.
2 General Form of the Models
Consider a general linear model, whose structural equations can be cast in the form
| (1) |
where ![]() indicates a vector of endogenous variables
and
indicates a vector of endogenous variables
and ![]() is a vector of serially uncorrelated
exogenous disturbances with zero mean and
is a vector of serially uncorrelated
exogenous disturbances with zero mean and
![]() . The vast
majority of the models used for monetary policy analysis can be
mapped into such formulation.
. The vast
majority of the models used for monetary policy analysis can be
mapped into such formulation.
The common approach in the monetary policy literature is to assume that central banks have a quadratic loss function
 |
(2) |
In some cases, a purely quadratic objective function is consistent with a second-order approximation of a general time-separable utility function around an efficient steady-state (see e.g. Woodford (2003a)).2 Moreover, quadratic loss functions have been shown to realistically describe central bank's behavior, even if they do not necessarily reflect the preferences of the underlying society.3 In fact, and following Rogoff (1985), appointing a central banker who is more averse towards inflation than the overall public may be desirable in the limited commitment settings considered here.
Throughout the analysis we therefore maintain the assumption that the central bank's loss function is purely quadratic and may or may not reflect social preferences. Besides obvious tractability considerations, this feature guarantees that our methodology is flexible and directly applicable to most of the models used for monetary policy analysis.4
3 Optimal Policy Under Loose Commitment
In a loose commitment setting it is assumed that policymakers have access to a commitment technology but may occasionally revise their plans. More formally, suppose that the occurrence of a re-optimization is driven by a two-state Markov stochastic process
![$\displaystyle \eta_t = \Big\{\begin{array}[c]{ll} 1 & \text{with Prob. } \gamma \\ 0 & \text{with Prob. } 1-\gamma\end{array}$](img7.gif) |
(3) |
At any given point in time if ![]() , previous
commitments are honored. This event occurs with probability
, previous
commitments are honored. This event occurs with probability
![]() . Instead, if
. Instead, if ![]() , previous promises are reneged and a new policy plan
is formulated. This formulation nests both the full-commitment and
discretion approaches as limiting cases where
, previous promises are reneged and a new policy plan
is formulated. This formulation nests both the full-commitment and
discretion approaches as limiting cases where ![]() and
and ![]() , respectively. More
importantly, this formulation also spans the continuum between
those two extremes.
, respectively. More
importantly, this formulation also spans the continuum between
those two extremes.
Considering stochastic re-optimizations is a necessary simplification to address large scale models. Such an assumption also seems justified if the timing of plans revisions can be uncorrelated with the state of the economy. One possible candidate for such events is a change in the dominating view within a central bank due to time-varying composition of its decision-making committee. Another candidate is outside pressures of varying intensity exerted by politicians and the financial industry.5 Alternatively, our approach can be interpreted as the reduced form of a model in which commitment to a policy is sustained by the threat of a punishment in case of re-optimization. If the punishment requires a priori coordination among private agents and in some random periods can not be implemented, then such a model may bear similarities with our approach.6
Following Schaumburg and Tambalotti (2007) and Debortoli and Nunes (2010a), the policymaker's problem can be written as
![$\displaystyle y_{-1}^{\prime}Py_{-1} + d =\underset{\{y_{t}\}_{t=0}^{\infty}}{\min}E_{-1}\sum_{t=0}^{\infty}\left( \beta\gamma\right) ^{t}\left[ y_{t}^{\prime }Wy_{t}+ \beta\left( 1-\gamma\right) (y_{t}^{\prime}Py_{t}+d)\right]$](img13.gif) |
(4) |
| s.t. |
The objective function is given by an infinite sum discounted at
the rate
![]() summarizing the history in which
re-optimizations never occur. Each term in the summation is
composed of two parts. The first part is the period loss function.
The second part indicates the value the policymaker obtains if a
reoptimization occurs in the next period.
summarizing the history in which
re-optimizations never occur. Each term in the summation is
composed of two parts. The first part is the period loss function.
The second part indicates the value the policymaker obtains if a
reoptimization occurs in the next period.
The policymaker faces a sequence of constraints, where in any
period ![]() expectations of future variables are an
average between two terms. The first term
expectations of future variables are an
average between two terms. The first term ![]() ,
with weight
,
with weight ![]() , relates to the allocations
prevailing when current plans are honored. The second term
, relates to the allocations
prevailing when current plans are honored. The second term
![]() , with weight
, with weight
![]() , refers to the choices made in
period
, refers to the choices made in
period ![]() if a re-optimization occurs (i.e. if
if a re-optimization occurs (i.e. if
![]() ). As in the Markov-perfect
literature, we assume that expectations about choices following a
re-optimization only depend on state-variables.
). As in the Markov-perfect
literature, we assume that expectations about choices following a
re-optimization only depend on state-variables.
| (5) |
The policymaker can not decide directly on the allocations
implemented if a re-optimization occurs and therefore the matrix
![]() is taken as given.
is taken as given.
For any ![]() , the policymaker's problem can
be solved using recursive methods. We follow the approach of Kydland and Prescott (1980) and Marcet and Marimon (2009), and write the Lagrangean associated
with the optimal policy problem
, the policymaker's problem can
be solved using recursive methods. We follow the approach of Kydland and Prescott (1980) and Marcet and Marimon (2009), and write the Lagrangean associated
with the optimal policy problem
![$\displaystyle \equiv E_{-1}\sum_{t=0}^{\infty}\left(\beta\gamma\right)^{t} \Bigg\{ y_{t}^{\prime}\left[ W+\left(1-\gamma\right)\beta P\right]y_{t}+ \lambda^{\prime}_{t-1}\beta^{-1} A_{1}y_{t} +$](img27.gif) |
(6) | |
![$\displaystyle \lambda_{t}^{\prime}\left[A_{-1}y_{t-1}+\left(A_{0}+\left(1-\gamma\right)A_{1}\tilde{H}\right)y_{t}+Bv_{t}\right] \Bigg\}$](img28.gif) |
||
This Lagrangean can be written recursively by expanding the
state of the economy to include the Lagrange multiplier vector
![]() . The solution to the problem is
then characterized by a time-invariant policy function
. The solution to the problem is
then characterized by a time-invariant policy function
![$\displaystyle \left[\begin{array}[c]{c}y_{t}\\ \lambda_{t}\end{array}\right] = \left[\begin{array}[c]{cc} H_{yy} & H_{y\lambda} \\ H_{\lambda y} & H_{\lambda\lambda}\end{array}\right] \left[\begin{array}[c]{c}y_{t-1}\\ \lambda_{t-1}\end{array}\right] + \left[\begin{array}[c]{c} G_{y} \\ G_{\lambda}\end{array}\right] v_{t},$](img32.gif) |
(7) |
where the matrices ![]() and
and ![]() depend
on the unknown matrix
depend
on the unknown matrix ![]() .
.
When a re-optimization occurs in a given period ![]() ,
the vector
,
the vector
![]() must be reset to zero. This
result, formally proved by Debortoli and Nunes (2010a), has
an intuitive interpretation. A re-optimization implies that all the
past promises regarding current and future variables are no longer
binding.
must be reset to zero. This
result, formally proved by Debortoli and Nunes (2010a), has
an intuitive interpretation. A re-optimization implies that all the
past promises regarding current and future variables are no longer
binding.
According to equation (7) and setting
![]() , it follows that
, it follows that
![]() . Moving this
equation forward one period and taking expectations, one obtains
. Moving this
equation forward one period and taking expectations, one obtains
![]() . For this
expression to be consistent with equation (5), it must be
that in a rational expectations equilibrium
. For this
expression to be consistent with equation (5), it must be
that in a rational expectations equilibrium
| (8) |
Given our formulation, the optimal policy under loose commitment
can be found as the solution of a fixed point problem in the matrix
![]() . In what follows we propose an algorithm to
solve for that fixed point.
. In what follows we propose an algorithm to
solve for that fixed point.
3.1 Solution Algorithm
We start by writing the first-order conditions of the Lagrangean (6):
| (9) | |||
| (10) |
The vector equation (9) corresponds to
the structural equation (1), where we have
used equations (5) and (8) to substitute
for the term
![]() . As a result, the unknown
matrix
. As a result, the unknown
matrix ![]() enters equation (9). That matrix
also enters equation (10), reflecting
that
enters equation (9). That matrix
also enters equation (10), reflecting
that ![]() can be used to affect the expectations of
can be used to affect the expectations of
![]() . The term
. The term
![]() in equation (10) constitutes the
derivative of the value function w.r.t.
in equation (10) constitutes the
derivative of the value function w.r.t. ![]() . This
derivative can be obtained using the envelope condition
. This
derivative can be obtained using the envelope condition
 |
(11) |
Finally, the term
![]() in equation (10) is an indicator
function
in equation (10) is an indicator
function
![$\displaystyle \mathcal{I}_{\gamma}=\left\{\begin{array}[c]{c}0\text{, if }\gamma=0\\ 1\text{, otherwise}\end{array}\right.$](img58.gif) |
and is used for convenience so that equation (10) is also valid
under discretion (![]() ), where the term
), where the term
![]() would
not appear.7
would
not appear.7
There are many methods to solve linear rational expectation systems like (9)-(10), and standard routines are widely available (e.g. Sims (2002), Klein (2000), Collard and Juillard (2001)). Our computational implementation is based on the method of undetermined coefficients.
For a given guess of the matrix ![]() , the law of
motion (7) can be used to compute the expectations terms
, the law of
motion (7) can be used to compute the expectations terms
| (12) | |||
| (13) | |||
| (14) |
where the last equation follows from resetting the Lagrange
multiplier ![]() to zero due to the
re-optimization at
to zero due to the
re-optimization at ![]() . Substituting these
formulas into (9-)-(10) one obtains
. Substituting these
formulas into (9-)-(10) one obtains
![$\displaystyle \Gamma_{0}\left[\begin{array}[c]{c}y_{t}\\ \lambda_{t}\end{array}\right] + \Gamma_{1}\left[\begin{array}[c]{c}y_{t-1}\\ \lambda_{t-1}\end{array}\right] +\Gamma_{v}v_{t}=0,$](img75.gif) |
(15) |
with
![$\displaystyle \left[\begin{array}[c]{cc}A_{0}+A_{1}H_{yy} & \gamma A_{1}H_{y\lambda}\ 2W+\beta A_{-1}^{\prime}H_{\lambda y} & A_{0}^{\prime}+\left( 1-\gamma \right) H_{yy}^{\prime}A_{1}^{\prime}+\beta\gamma A_{-1}^{\prime} H_{\lambda\lambda}\end{array}\right]$](img77.gif) |
||
![$\displaystyle \left[\begin{array}[c]{cc}A_{-1} & 0\\ 0 & \beta^{-1}\mathcal{I}_{\gamma}A_{1}^{\prime}\end{array}\right], \hspace{1cm} \Gamma_v \equiv \left[\begin{array}[c]{c} B\\ 0 \end{array}\right].$](img79.gif) |
The resulting law of motion is
![$\displaystyle \left[\begin{array}[c]{c}y_{t}\\ \lambda_{t}\end{array}\right] = - \Gamma_{0}^{-1}\Gamma_{1} \left[\begin{array}[c]{c}y_{t-1}\\ \lambda_{t-1}\end{array}\right] - \Gamma_{0}^{-1}\Gamma_{v}v_{t},$](img80.gif) |
(16) |
where we are assuming the matrix
![]() to be non-singular.
to be non-singular.
The final step consists in verifying that this law of motion
coincides with the initial guess, i.e.
![]() . If not, the
guess-and-verify procedure is repeated until convergence. In
summary, the algorithm proceeds as follows:
. If not, the
guess-and-verify procedure is repeated until convergence. In
summary, the algorithm proceeds as follows:
- Using a guess
 , form
 and
and
 .
. - Compute
 .
. - Check if
 ,
where
,
where  is a distance measure
and
is a distance measure
and  . If the guess and the solution have
converged, proceed to step 4. Otherwise, update the guess as
. If the guess and the solution have
converged, proceed to step 4. Otherwise, update the guess as
 and repeat steps 1-3 until
convergence.
and repeat steps 1-3 until
convergence. - Finally, form
 and compute
 .
.
Clearly, there are many alternative algorithms to the one proposed.
For example, for a given ![]() the system of equations
(9)-(10) could be solved
using a generalized Schur decomposition as in Blanchard and Kahn (1980) or solving a quadratic matrix equation
as in Uhlig (1995). For this reason, the
non-singularity of the matrix
the system of equations
(9)-(10) could be solved
using a generalized Schur decomposition as in Blanchard and Kahn (1980) or solving a quadratic matrix equation
as in Uhlig (1995). For this reason, the
non-singularity of the matrix
![]() is not essential. Also, the
solution of the fixed point problem on the matrix
is not essential. Also, the
solution of the fixed point problem on the matrix ![]() could be performed using a Newton-type method. Nevertheless, the
procedure described above proved to be computationally more
efficient.
could be performed using a Newton-type method. Nevertheless, the
procedure described above proved to be computationally more
efficient.
The main message of our analysis is that solving for an optimal policy problem under loose commitment only requires solving a fixed point problem, which in a linear-quadratic framework is as simple as solving a system of linear equations. In addition, a loose commitment approach nests the full-commitment and discretion cases. In this respect, Blake and Kirsanova (2010) show that some linear-quadratic models may display multiple equilibria under discretion.8 In those cases, and depending on the initial guess, our algorithm may then converge to different discretionary equilibria. However, our loose commitment approach, by allowing gradual intermediate steps from full-commitment to discretion, may be viewed as a selection device among those multiple equilibria.9
3.2 Simulations and Impulse Responses
Once the matrices ![]() and
and ![]() have
been obtained, it is straightforward to simulate the model for
different realizations of the shocks and compute second moments and
impulse response functions. For given initial conditions
have
been obtained, it is straightforward to simulate the model for
different realizations of the shocks and compute second moments and
impulse response functions. For given initial conditions
![]() ,
,
![]() , and histories of the shocks
, and histories of the shocks
![]() , the model
simulation follows the formula
, the model
simulation follows the formula
![$\displaystyle \left[\begin{array}[c]{c} y_{t}\\ \lambda_{t}\end{array}\right] = H\left[\begin{array}[c]{c} y_{t-1}\\ \eta_{t}\lambda_{t-1}\end{array}\right] +Gv_{t}.$](img101.gif) |
The peculiarity of the loose commitment setting is that a
history of the shock driving the re-optimizations (![]() ) should also be specificied. Whenever
) should also be specificied. Whenever
![]() , the Lagrange multiplier
, the Lagrange multiplier
![]() is reset to zero.
is reset to zero.
3.3 Welfare
For any initial condition
![]() the welfare measure, unconditional on the first realization of
the welfare measure, unconditional on the first realization of
![]() , is given by
, is given by
![$\displaystyle \left[ \begin{array}[c]{c}y_{t-1}\\ \lambda_{t-1}\end{array}\right]^{\prime} \widehat{P}\left[ \begin{array}[c]{c}y_{t-1}\\ \lambda_{t-1}\end{array}\right]+d.$](img107.gif) |
(17) |
The matrix
![]() can be obtained taking the
derivative of the recursive formulation of the Lagrangean (6), thus obtaining
can be obtained taking the
derivative of the recursive formulation of the Lagrangean (6), thus obtaining
![$\displaystyle \widehat{P}=\frac{1}{2}\left[\begin{array}[c]{cc}0 & A^{\prime}_{-1}\\ \beta^{-1}A_{1} & 0 \end{array}\right] H.$](img109.gif) |
(18) |
Notice that in the most pertinent case with initial conditions
![]() the only relevant term would
be the upper left block of
the only relevant term would
be the upper left block of
![]() , which equals
, which equals
![]() .
.
The constant ![]() is given by
is given by
![$\displaystyle =\frac{1}{1-\beta}tr\left[ \Sigma_{v}\left( G^{\prime}\widetilde{V}G+G^{\prime}\left[\begin{array}[c]{c}0\\ B\end{array}\right]\right)\right]$](img115.gif) |
(19) |
with
![$\displaystyle \widetilde{V}=\left(\left[\begin{array}[c]{cc} W & 0 \\ A_{0}+\left( 1-\gamma\right) A_{1}H_{yy} & 0 \end{array}\right]+ \beta\left( 1-\gamma\right) \left[\begin{array}[c]{cc}A_{-1}^{\prime}H_{\lambda y} & 0\\ 0 & 0 \end{array}\right] +\beta\gamma\widehat{P}\right).\footnote{The associated derivations, which follow the steps in \cite{LS04} (Ch. 5), are omitted for brevity and are available upon request.}$](img116.gif) |
Alternatively, one can compute welfare conditional on the first realization of the shock, which is defined as follows:
![$\displaystyle \left[\begin{array}[c]{c} y_{t-1}\\ \lambda_{t-1}\\ v_{t}\end{array}\right] ^{\prime} \widetilde{P} \left[\begin{array}[c]{c}y_{t-1}\\ \lambda_{t-1}\\ v_{t}\end{array}\right]$](img117.gif) |
(20) | |
![\begin{displaymath}+\beta\gamma E_{t}\left( \left[ \begin{array}[c]{c} y_{t}\\ \lambda_{t}\\ v_{t+1} \end{array}\right] ^{\prime}\widetilde{P}\left[\begin{array}[c]{c} y_{t}\\ \lambda_{t}\\ v_{t+1}\end{array}\right] +\widetilde{d}\right)\end{displaymath}](img119.gif) |
||
![\begin{displaymath}+\beta\left( 1-\gamma \right) E_{t}\left( \left[\begin{array}[c]{c}y_{t}\\ 0\\ v_{t+1}\end{array}\right] ^{\prime}\widetilde{P}\left[ \begin{array}[c]{c}y_{t}\\ 0\\ v_{t+1}\end{array}\right] +\widetilde{d}\right)\end{displaymath}](img120.gif) |
By definition of conditional welfare, it must be that
![$\displaystyle E_{t}\left( \left[\begin{array}[c]{c} y_{t}\\ \lambda_{t}\\ v_{t+1}\end{array}\right] ^{\prime}\widetilde{P}\left[ \begin{array}[c]{c} y_{t}\\ \lambda_{t}\\ v_{t+1} \end{array} \right] +\widetilde{d}\right) = \left( \left[\begin{array}[c]{c}y_{t}\\ \lambda_{t}\end{array}\right]^{\prime} \widehat{P} \left[\begin{array}[c]{c}y_{t}\\ \lambda_{t}\end{array}\right] +d\right),$](img121.gif) |
(21) |
and equation (20) can be rewritten as
![\begin{displaymath}\left[\begin{array}[c]{c}y_{t-1} \\ \lambda_{t-1}\\ v_{t} \end{array}\right] ^{\prime}\widetilde{P}\left[ \begin{array}[c]{c} y_{t-1}\\ \lambda_{t-1}\\ v_{t} \end{array}\right] +\widetilde{d} =\end{displaymath}](img122.gif) |
(22) |
![\begin{displaymath}\left( H\left[\begin{array}[c]{c} y_{t-1}\\ \lambda_{t-1} \end{array} \right] +Gv_{t}\right) ^{\prime}\widetilde{V}\left( H\left[ \begin{array}[c]{c}y_{t-1}\\ \lambda_{t-1}\end{array}\right] +Gv_{t}\right) +\end{displaymath}](img123.gif) |
|
![$\displaystyle \left(H\left[\begin{array}[c]{c}y_{t-1}\\ \lambda_{t-1}\end{array}\right] + Gv_{t}\right) ^{\prime}\left(\left[\begin{array}[c]{cc} 0 & \beta^{-1}A_{1}^{\prime}\\ A_{-1} & 0 \end{array} \right] \left[\begin{array}[c]{c} y_{t-1}\\ \lambda_{t-1} \end{array}\right] + \left[\begin{array}[c]{c}0\\ B\end{array}\right] v_{t}\right) +\beta d.$](img124.gif) |
We can thus obtain the conditional welfare, for any given initial condition, by just evaluating the right-hand side of this last expression.
In these derivations we have computed welfare using the
recursive formulation of the Lagrangean (6). As mentioned
earlier, that formulation is equivalent to the original problem
(4) only after
imposing the initial condition
![]() . If one wants to evaluate the
welfare according to the original formulation of equation (2), but for a
different value of
. If one wants to evaluate the
welfare according to the original formulation of equation (2), but for a
different value of
![]() , one needs to subtract
, one needs to subtract
![]() and
and
![]() to equations
(17) and
(22),
respectively.11
to equations
(17) and
(22),
respectively.11
4 Application: A Medium-Scale Closed Economy Model
In this section, we apply our methodology to the Smets and Wouters (2007) model. Needless to say, our purpose is neither to match business cycle properties nor to test the empirical plausibility of alternative commitment settings. We instead focus on examining the role of commitment in this benchmark medium-scale model.
The model includes nominal frictions in the form of sticky price and wage settings allowing for backward inflation indexation.12 It also features real rigidities - habit formation in consumption, investment adjustment costs, variable capital utilization, and fixed costs in production. The dynamics are driven by six orthogonal shocks: total factor productivity, two shocks affecting the intertemporal margin (risk premium and investment-specific technology shocks), two shocks affecting the intratemporal margin (wage and price-markup shocks), and an exogenous government spending shock. The model equations are omitted here for brevity and all parameters are calibrated to the posterior mode as reported in Smets and Wouters (2007).
Unlike Smets and Wouters (2007), we do not consider a specific interest rate rule nor the associated monetary policy shock. Instead, we assume that the central bank solves an optimal policy problem. By doing so, we exemplify how the degree of commitment and the re-optimization shocks affect the behavior of the central bank. We are not dismissing interest rate rules either from a normative or a positive perspective. In fact, it is widely known that optimal policy plans can be implemented in a variety of ways including targeting rules and instrument rules, of which interest rate rules are a subcase.
To the best of our knowledge, the utility-based welfare criterion for the Smets and Wouters (2007) model has not been derived, and doing so is beyond the scope of this paper. Instead, we explore the implications of two purely quadratic loss functions commonly used in the literature. The benchmark formulation is given by
| (23) |
where ![]() ,
, ![]() , and
, and ![]() denote respectively price inflation, output-gap, and the
nominal interest rate. The alternative specification takes the form
denote respectively price inflation, output-gap, and the
nominal interest rate. The alternative specification takes the form
| (24) |
Following Woodford (2003b), we set the parameters
![]() ,
, ![]() ,
,
![]() , and
, and
![]() . The plausibility of these
formulations and of the corresponding calibration is discussed in
the following sections, where we analyze the importance of
commitment from different perspectives.
. The plausibility of these
formulations and of the corresponding calibration is discussed in
the following sections, where we analyze the importance of
commitment from different perspectives.
4.1 What are the Gains From Commitment?
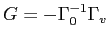
In Figure 1, we plot the conditional welfare gains obtained for different levels of credibility.13 The figure standardizes welfare by the total gains of changing credibility from discretion to full-commitment. This standardization has the advantage that any affine transformation of the central bank's objective function would leave Figure 1 unchanged.
As expected, higher credibility leads to higher welfare.14 More importantly, the figure suggests that if a central bank has low credibility to start with, a partial enhancement of its credibility will not deliver much of the welfare gains that credibility can potentially offer. On the other hand, a central bank with high credibility should be especially cautious. It will face severe welfare losses if its credibility is deemed to have been minimally affected. These results contrast with those obtained by Schaumburg and Tambalotti (2007) using a more stylized monetary policy model.15
Figure 1: Welfare
Notes: The figure plots the relative welfare gains of increasing credibility from full discretion to a degree of commitment![]() :
:
![]() . The
panel on the left corresponds to the benchmark objective function,
whereas the right panel corresponds to the alternative welfare
function with the interest rate level. The welfare measure
corresponds to conditional welfare and the results are robust to
unconditioning on the shocks.
. The
panel on the left corresponds to the benchmark objective function,
whereas the right panel corresponds to the alternative welfare
function with the interest rate level. The welfare measure
corresponds to conditional welfare and the results are robust to
unconditioning on the shocks.
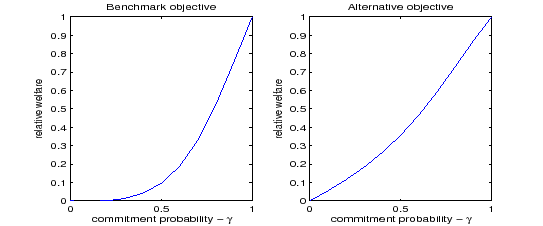
Credibility may also affect the relative contribution of inflation and output-gap volatilities to the overall welfare loss. A higher credibility level translates into better management of the policy trade-offs because forward guidance is more effective as a policy tool. Therefore one might conjecture that higher credibility would reduce the volatilities of all welfare relevant variables. Figure 2 exemplifies that such a conjecture does not always hold. The figure shows that for a given relative weight in the objective function, a loss in credibility leads to a rise in inflation volatility but a reduction in output-gap volatility. The reason is that stabilizing inflation is the most important welfare objective. A central bank with high credibility can achieve a higher welfare by promising to stabilize inflation even if doing so implies more output-gap volatility.
Figure 2: Credibility and Volatility
Notes: the figure plots the volatilities of inflation, output-gap, and interest rate for different credibility levels. The left and right panel change the weight on inflation and output-gap, respectively. The two panels plot several weights from half to double of the benchmark value. The solid and dashed lines consider the probability of commitment to be 0.5 and 1, respectively.
Figure 2 also
discriminates among the points in the policy frontiers associated
with doubling or halving ![]() or
or ![]() relative to the baseline calibration. Even considering
such extreme calibrations of the welfare function does not change
the results qualitatively. The finding that a loss in credibility
increases inflation volatility but reduces output-gap volatility
holds for those extreme calibrations as well.
relative to the baseline calibration. Even considering
such extreme calibrations of the welfare function does not change
the results qualitatively. The finding that a loss in credibility
increases inflation volatility but reduces output-gap volatility
holds for those extreme calibrations as well.
4.2 Loose Commitment and Simple Interest Rate Rules
The optimal policy under loose commitment can be implemented
through targeting rules or through an appropriately defined
interest rate rule.16 In DSGE monetary policy models it is
instead common to adopt simple reduced-form interest rate rules to
describe the central bank's behavior. Clearly, such behavior is
affected by the degree of commitment ![]() . An
open question is to see how changes in
. An
open question is to see how changes in ![]() are
captured by the parameters of a simple rule. To address this
question, we perform a Monte-Carlo exercise taking our model as the
pseudo-true data generating process but estimating the interest
rate rule
are
captured by the parameters of a simple rule. To address this
question, we perform a Monte-Carlo exercise taking our model as the
pseudo-true data generating process but estimating the interest
rate rule
| (25) |
where
![]() is assumed to be i.i.d. and
normally distributed.
is assumed to be i.i.d. and
normally distributed.
Table 1 presents the
regression results. The coefficient estimates are similar to those
found using actual data. In most cases, the coefficient on
output-gap is small (and in some cases not significant), the
coefficient on inflation is plausible, and there is a considerable
degree of interest rate smoothing.17 Most of the motive for
interest-rate smoothing comes from commitment. Commitment implies
that past policies matter for current allocations, thus introducing
history dependence.18 As a result, when commitment is
high, the estimated values of ![]() are high
even under the alternative loss function, where per se there
is no interest-rate smoothing motive. Overall, the coefficient
are high
even under the alternative loss function, where per se there
is no interest-rate smoothing motive. Overall, the coefficient
![]() is more plausible for relatively
loose commitment settings rather than with full-commitment.
is more plausible for relatively
loose commitment settings rather than with full-commitment.
Simple interest rate rules have been widely adopted to study the
central bank behavior across different periods of time. In that
respect, our exercise shows that a change in the interest rate
parameters
![]() should not be
necessarily interpreted as a change in the central bank's
preferences. Even if preferences remain unaltered, the reduced form
interest rate parameters may change because of a loss of
credibility.
should not be
necessarily interpreted as a change in the central bank's
preferences. Even if preferences remain unaltered, the reduced form
interest rate parameters may change because of a loss of
credibility.
Table 1: Interest Rate Regressions
| Benchmark Loss Function: 1 | Benchmark Loss Function: 0.9 | Benchmark Loss Function: 0.5 | Benchmark Loss Function: 0 | Alternative Loss Function: 1 | Alternative Loss Function: 0.9 | Alternative Loss Function: 0.5 | Alternative Loss Function: 0 | U.S. Data: (1970-2008) | |
|---|---|---|---|---|---|---|---|---|---|
| 0.241 (0.047) | 0.207 (0.103) | 1.204 (0.141) | 1.914 (0.048) | 0.175 (0.043) | 0.057 (0.138) | 0.725 (0.312) | 2.334 (0.072) | 0.128 (0.039) | |
| 0.002 (0.003) | -0.003 (0.007) | 0.059 (0.014) | 0.105 (0.005) | 0.002 (0.002) | -0.010 (0.009) | -0.030 (0.033) | 0.12 (0.008) | 0.042 (0.009) | |
| 0.971 (0.022) | 0.926 (0.033) | 0.875 (0.038) | 0.75 (0.015) | 0.972 (0.022) | 0.843 (0.06) | 0.503 (0.062) | 0.159 (0.027) | 0.926 (0.028) | |
| 0.923 | 0.865 | 0.843 | 0.977 | 0.921 | 0.759 | 0.416 | 0.930 | 0.947 |
Notes: The table displays the coefficients and standard deviations corresponding to estimating equation (25) in the original model. The Monte-Carlo exercise is comprised of 1000 estimations of 200 periods each (roughly corresponding to the size of actual samples). The average standard deviations across simulations are reported in parenthesis. The last row displays the R2 The panel on the left and the center correspond to the benchmark and alternative welfare functions, respectively. The sample regarding the U.S. data goes from 1970:Q1 until 2008:Q3, where the latest data is determined by the beginning of the zero lower bound period. The output-gap data corresponds to the CBO measure.
The simple rule (25) captures fairly well the interest rate behavior, as signaled by the high value of the R2. The R2 is plausible but lower at intermediate degrees of commitment. The reason is that re-optimizations imply a non-linear change in the policy setting that the linear regression is not capturing well. The re-optimization uncertainty vanishes with full-commitment or discretion, and therefore those two cases can be better described by a linear rule. Also, the R2 is lower for the alternative specification of the loss function. In that case, the absence of an interest rate smoothing motive in the objective function causes the interest rate to change more abruptly when re-optimizations occur. This result suggests that our benchmark loss function is more consistent with available estimates of the central bank behavior.
4.3 Business Cycle Properties Under Loose Commitment
We now analyze the effects of commitment on business cycle
properties. Impulse responses to different shocks are reported in
Figures 3-5. The probability
of commitment is set to ![]() , implying that
policy re-optimizations occur on average every 10 quarters. The
solid line considers the specific history where re-optimizations do
not occur over the reported horizon (
, implying that
policy re-optimizations occur on average every 10 quarters. The
solid line considers the specific history where re-optimizations do
not occur over the reported horizon (
![]() ).
).
On impact, the sign of the responses does not change with the commitment assumption. However, for each of the shocks considered, after about 6 quarters the response of the nominal interest rate does not lie between full-commitment (dashed line) and discretion (dash-dotted line). These differences arise because of the uncertainty about future re-optimizations, a feature unique to loose commitment settings.
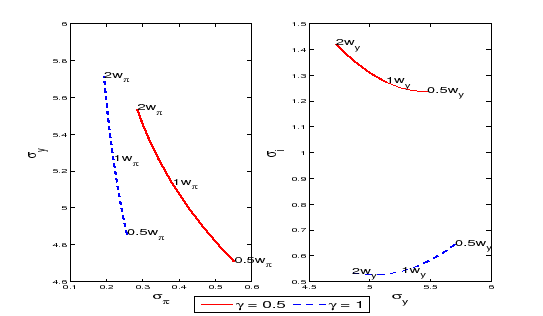
For example, the interest rate response to a positive wage markup shock, shown in Figure 3, peaks after about 10 quarters - as opposed to a negligible response at a similar horizon both under full-commitment and discretion. In turn, the output-gap response is more prolonged, while both price and wage inflation are close to the values prevailing under commitment. Intuitively, the promise of a deeper and longer recession dampens inflation expectations and helps achieve a higher welfare. When the central bank reoptimizes (line with crosses), it reneges upon past promises. It then reduces the interest rate, causing inflation to increase and the output-gap to become closer to target. The bottom right panel shows that the welfare gain of reoptimizing in a given quarter - a measure of the time-inconsistency at each moment in time - is maximum after roughly 9 quarters. The central bank is fulfilling the promise of a deep recession, which becomes especially costly at that time because inflation is already below target and the output-gap is at its lowest level.
Similar reasoning also applies to productivity and government spending shocks.19 In response to the latter shocks - as well as to other demand-type shocks - the output-gap and the two measures of inflation are well stabilized. This occurs regardless of the degree of commitment, and as long as the central bank sets its policy optimally. This suggests that commitment would not be very important if these shocks were the main sources of business cycle fluctuations.20 Also, the time-inconsistency problem, measured by the gains from re-optimizations (bottom right panel), is much smaller in response to technology and government spending shocks than in response to wage markup shocks.
Table 2 shows how commitment affects the second moments for some relevant variables. The correlation of output with the two measures of inflation is positive under full-commitment and becomes negative at intermediate degrees of commitment. The reason is that under full-commitment output and inflation are positively correlated not only conditionally on demand shocks, but also conditionally on technology and markup shocks. In response to the latter shocks, output and inflation move in opposite directions on impact, but after about 5 quarters they comove. Instead, with loose commitment, especially if a re-optimization has occurred, inflation and output move in opposite directions for a longer horizon. As a result, the correlation between inflation and output conditional on non-demand shocks, as well as the unconditional counterpart, changes sign with even a small departure from the full-commitment assumption.21
Figure 3: Impulse Responses to a Wage Markup Shock
Notes: The figure plots the
impulse responses to a one standard deviation shock, under
different commitment settings. The solid line refers to a
particular history where the probability of commitment ![]() and re-optimizations do not occur (
and re-optimizations do not occur (
![]() ). The line with crosses
refers to a particular history where the probability of commitment
). The line with crosses
refers to a particular history where the probability of commitment ![]() and a single re-optimization
occurs after 10 quarters (
and a single re-optimization
occurs after 10 quarters (
![]() ). For
any quarter, the gains from re-optimization are computed as the
welfare difference between keeping the announced plan vs
reoptimizing in that particular quarter.
). For
any quarter, the gains from re-optimization are computed as the
welfare difference between keeping the announced plan vs
reoptimizing in that particular quarter.
Figure 4: Impulse Responses to a Productivity Shock
Notes: The figure plots the
impulse responses to a one standard deviation shock, under
different commitment settings. The solid line refers to a
particular history where the probability of commitment ![]() and re-optimizations do not occur (
and re-optimizations do not occur (
![]() ). The line with crosses
refers to a particular history where the probability of commitment
). The line with crosses
refers to a particular history where the probability of commitment
![]() and a single re-optimization
occurs after 10 quarters (
and a single re-optimization
occurs after 10 quarters (
![]() ). For
any quarter, the gains from re-optimization are computed as the
welfare difference between keeping the announced plan vs
reoptimizing in that particular quarter.
). For
any quarter, the gains from re-optimization are computed as the
welfare difference between keeping the announced plan vs
reoptimizing in that particular quarter.
Figure 5: Impulse Responses to a Government Spending Shock
Notes: The figure plots the
impulse responses to a one standard deviation shock, under
different commitment settings. The solid line refers to a
particular history where the probability of commitment ![]() and re-optimizations do not occur (
and re-optimizations do not occur (
![]() ). The line with crosses
refers to a particular history where the probability of commitment
). The line with crosses
refers to a particular history where the probability of commitment
![]() and a single re-optimization
occurs after 10 quarters (
and a single re-optimization
occurs after 10 quarters (
![]() ). For
any quarter, the gains from re-optimization are computed as the
welfare difference between keeping the announced plan vs
reoptimizing in that particular quarter.
). For
any quarter, the gains from re-optimization are computed as the
welfare difference between keeping the announced plan vs
reoptimizing in that particular quarter.
Even though it is beyond the scope of this paper to estimate the
model and the degree of credibility, the loose commitment model
matches some key moments relatively well. Table 2 shows that in
the data the correlation between output and price inflation is
mildly negative, whereas the correlation between output and wage
inflation is mildly positive - a feature that the loose commitment
model with
![]() matches quite well. In addition,
the relative volatility of interest rates is also more plausible
with limited commitment settings.
matches quite well. In addition,
the relative volatility of interest rates is also more plausible
with limited commitment settings.
Finally, loose commitment changes the relative contribution of
alternative shocks to business cycle fluctuations, as summarized in
Figure 6. This pattern is
mostly evident for interest rate fluctuations. Under
full-commitment about 55% of the fluctuations can be attributed to
demand shocks. A small loss of credibility (
![]() ) is enough for this proportion to
drop dramatically to about 17%. The contribution of wage and price
markup shocks increases from 43% to 72%. The reason is that the
interest-rate response to a demand shock does not change much with
the degree of commitment. Instead, in response to markup shocks the
interest rate barely responds under commitment, while it increases
and remains high for a long period in limited commitment settings.
For almost all the other variables, when commitment is lower, price
markup shocks lose importance and wage markup shocks become more
relevant. Hence, the variance decompositions and the earlier plots
measuring time-inconsistency suggest that commitment is
particularly important to stabilize wage markup shocks.
) is enough for this proportion to
drop dramatically to about 17%. The contribution of wage and price
markup shocks increases from 43% to 72%. The reason is that the
interest-rate response to a demand shock does not change much with
the degree of commitment. Instead, in response to markup shocks the
interest rate barely responds under commitment, while it increases
and remains high for a long period in limited commitment settings.
For almost all the other variables, when commitment is lower, price
markup shocks lose importance and wage markup shocks become more
relevant. Hence, the variance decompositions and the earlier plots
measuring time-inconsistency suggest that commitment is
particularly important to stabilize wage markup shocks.
In summary, loose commitment has important effects on price and wage inflation dynamics, and nominal interest rates - the main variables for which the central bank is responsible. The impulse responses to different shocks, as well as the interest rate volatility, is not necessarily in between full-commitment and discretion. Finally, small departures from full-commitment change the sign of the correlation between output and inflation. In addition, the relative contribution of wage markup shocks to business cycle fluctuations increases dramatically, especially for interest rates and inflation.
Table 2: Effects of Loose Commitment on Second Moments
| Model: Full-Com. | Model: Loose Commitment, 0.9 | Model: Loose Commitment, 0.5 | Model: Discr. | U.S. Data (1970-2008) | |
|---|---|---|---|---|---|
| Standard Deviation (w.r.t. output): Output-Gap | 0.83 | 0.84 | 0.83 | 0.83 | 0.74 |
| Standard Deviation (w.r.t. output): Price Inflation | 0.04 | 0.04 | 0.06 | 0.07 | 0.21 |
| Standard Deviation (w.r.t. output): Wage Inflation | 0.08 | 0.08 | 0.08 | 0.09 | 0.26 |
| Standard Deviation (w.r.t. output): Interest Rate | 0.09 | 0.15 | 0.21 | 0.18 | 0.29 |
| Cross-Correlations With Output: Output-Gap | 0.87 | 0.88 | 0.86 | 0.86 | 0.90 |
| Cross-Correlations With Output: Price Inflation | 0.05 | -0.17 | -0.66 | -0.70 | -0.13 |
| Cross-Correlations With Output: Wage Inflation | 0.21 | 0.13 | -0.29 | -0.38 | 0.05 |
| Cross-Correlations With Output: Interest Rate | -0.34 | -0.49 | -0.56 | -0.56 | -0.32 |
Notes: The table displays several statistics for the output-gap, inflation, wage inflation, and the interest rate. The model statisitics are computed with 1000 simulations of 200 periods each. The sample regarding the U.S. data goes from 1970:Q1 until 2008:Q3, where the latest data is determined by the beginning of the zero lower bound period. The output-gap data corresponds to the CBO measure.
5 Conclusions
Imperfect commitment settings overcome the dichotomy between full-commitment and discretion. In practice, policymakers have some degree of commitment that is not perfect - in some cases they keep a previously formulated policy plan whereas in other cases they reformulate those plans. Recent proposals of imperfect commitment settings were restricted to relatively simple and stylized models.
The contribution of this paper is to propose a method and a toolkit that extends the applicability of loose commitment to medium- and large-scale linear quadratic models typically used in monetary policy. We exemplified the method in the Smets and Wouters (2007) model, where we posed a variety of questions that our method can address and would remain otherwise unanswered.
Figure 6: Variance Decomposition
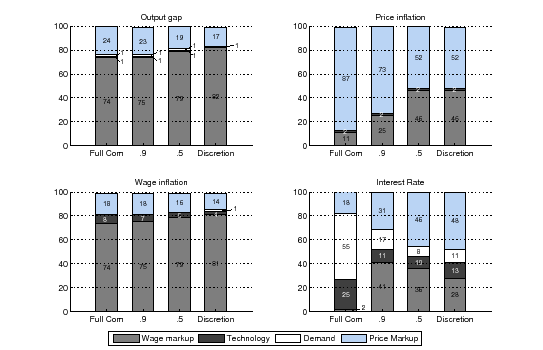
Notes: The figure displays the contribution of different shocks to the variance of our variables, under different commitment scenarios. For convenience, risk premium, investment specific, and government spending shocks have been grouped as "demand'' shocks. The model statisitics are computed with 1000 simulations of 200 periods each.
Our easy-to-use toolkit permits several modeling extensions. For instance, it would be interesting to incorporate financial frictions, commodity price shocks, unemployment dynamics, and determine the importance of commitment in those cases. Since the optimal policy under loose commitment is not the average of the polar cases of full-commitment and discretion, examining the policy response to such shocks would be interesting per se and shed light on recent economic developments. Also, considering alternative intermediate credibility settings is certainly desirable, but technical and computational complexity may become prohibitive to address the medium- and large-scale models considered here. On a different note, our methodology could be exploited to analyze the plausibility of alternative commitment settings through an appropriate estimation exercise. We plan to pursue these projects in the near future.
References
Backus, D., Driffill, J., 1985. Inflation and reputation. American Economic Review 75 (3), 530-38.
Berger, H., Woitek, U., 2005. Does conservatism matter? a time-series approach to central bank behaviour. Economic Journal 115 (505), 745-766.
Blake, A. P., Kirsanova, T., 2010. Discretionary policy and multiple equilibria in lq re models. manuscript, University of Exeter.
Blanchard, O. J., Kahn, C. M., 1980. The solution of linear difference models under rational expectations. Econometrica 48 (5), 1305-1311.
Chappell, H., Havrilesky, T., McGregor, R., 1993. Partisan monetary policies: Presidential influence through the power of appointment. The Quarterly Journal of Economics 108 (1), 185-218.
Chari, V. V., Kehoe, P. J., 1990. Sustainable plans. Journal of Political Economy 98 (4), 783-802.
Collard, F., Juillard, M., June 2001. A higher-order taylor expansion approach to simulation of stochastic forward-looking models with an application to a nonlinear phillips curve model. Computational Economics 17 (2-3), 125-39.
Currie, D., Levine, P., 1993. Rules, Reputation and Macroeconomic Policy Coordination. Cambridge Books. Cambridge University Press.
Debortoli, D., Nunes, R., 2006. On linear-quadratic approximations. Universitat Pompeu Fabra. Manuscript.
Debortoli, D., Nunes, R., May 2010a. Fiscal policy under loose commitment. Journal of Economic Theory 145 (3), 1005-1032.
Debortoli, D., Nunes, R., 2010b. The macroeconomic consequences of unstable objectives. Manuscript.
Dennis, R., 2004. Inferring policy objectives from economic outcomes. Oxford Bulletin of Economics and Statistics 66 (1), 735-764.
Dennis, R., February 2007. Optimal policy in rational expectations models: New solution algorithms. Macroeconomic Dynamics 11 (01), 31-55.
Dennis, R., Kirsanova, T., 2010. Expectations traps and coordination failures: selecting among multiple discretionary equilibria. Working Paper Series 2010-02, Federal Reserve Bank of San Francisco.
Erceg, C. J., Henderson, D. W., Levin, A. T., 2000. Optimal monetary policy with staggered wage and price contracts. Journal of Monetary Economics 46 (2), 281-313.
Evans, G. W., Honkapohja, S., 2003. Expectations and the stability problem for optimal monetary policies. Review of Economic Studies 70 (4), 807-824.
Gali, J., 2008. Monetary Policy, Inflation, and the Business Cycle: An Introduction to the New Keynesian Framework. Princeton University Press.
Giannoni, M., Woodford, M., 2010. Optimal target criteria for stabilization policy. NBER Working Paper 15757.
Ilbas, P., forthcoming. Revealing the Preferences of the US Federal Reserve. Journal of Applied Econometrics.
Kehoe, T. J., Levine, D. K., 1993. Debt-constrained asset markets. Review of Economic Studies 60 (4), 865-88.
Klein, P., 2000. Using the generalized schur form to solve a multivariate linear rational expectations model. Journal of Economic Dynamics and Control 24 (10), 1405-1423.
Kydland, F. E., Prescott, E. C., 1977. Rules rather than discretion: The inconsistency of optimal plans. Journal of Political Economy 85 (3), 473-91.
Kydland, F. E., Prescott, E. C., 1980. Dynamic optimal taxation, rational expectations and optimal control. Journal of Economic Dynamics and Control 2(1), 79-91.
Ljungqvist, L., Sargent, T. J., 2004. Recursive Macroeconomic Theory. MIT Press Books. The MIT Press.
Marcet, A., Marimon, R., 2009. Recursive contracts. Universitat Pompeu Fabra. Working Paper.
Roberds, W., 1987. Models of policy under stochastic replanning. International Economic Review 28 (3), 731-755.
Rogoff, K., 1985. The optimal degree if commitment to an intermediate monetary target. Quarterly Journal of Economics 100 (4), 1169-89.
Schaumburg, E., Tambalotti, A., 2007. An investigation of the gains from commitment in monetary policy. Journal of Monetary Economics 54 (2), 302-324.
Schmitt-Grohe, S., Uribe, M., 2005. Optimal fiscal and monetary policy in a medium-scale macroeconomic model. NBER Macroeconomics Annual(383-425).
Sims, C., October 2002. Solving linear rational expectations models. Computational Economics 20 (1-2), 1-20.
Sleet, C., 2001. On credible monetary policy and private government information. Journal of Economic Theory 99 (1-2), 338-376.
Smets, F., Wouters, R., 2007. Shocks and frictions in us business cycles: A bayesian dsge approach. American Economic Review 97 (3), 586-606.
Soderlind, P., 1999. Solution and estimation of re macromodels with optimal policy. European Economic Review 93, 813-823.
Uhlig, H., 1995. A toolkit for analyzing nonlinear dynamic stochastic models easily. Discussion Paper / Institute for Empirical Macroeconomics 101, Federal Reserve Bank of Minneapolis.
Woodford, M., 2003a. Interest and Prices: Foundations of a Theory of Monetary Policy. Princeton University Press.
Woodford, M., 2003b. Optimal interest-rate smoothing. Review of Economic Studies 70 (4), 861-886.
Yun, T., 1996. Nominal price rigidity, money supply endogeneity and business cycles. Journal of Monetary Economics 37 (2), 345-370.
Footnotes
** We are grateful to seminar participants at the European Central Bank, Goethe University, Bundesbank, NASM Econometric Society St. Louis 2011, Conference on Computing in Economics and Finance in Paris 2008 and San Francisco 2011. Any remaining errors are our own. The views expressed in the paper are those of the authors and do not necessarily reflect those of the Board of Governors, the Federal Reserve System, or the Norges Bank. Email: [email protected], [email protected], [email protected] Return to text
1. We have also tested our methodology with bigger models used for monetary policy analysis, such as the Norwegian Economy Model (NEMO) of the Norges Bank. Return to text
2. In the presence of steady-state distortions, a purely quadratic objective can be obtained using a simple linear combination of the structural equations approximated to a second-order. However, as shown by Debortoli and Nunes (2006), this requires imposing the so-called "timeless perspective'' assumption, which contrasts with the loose commitment settings considered in this paper. For an alternative approach, see Schmitt-Grohe and Uribe (2005). Return to text
3. See for example the empirical analysis of Dennis (2004) and Ilbas (forthcoming). Return to text
4. In the companion code, models with more
lags, leads, constants, and serially correlated shocks are
automatically transformed to be consistent with the formulation in
equations (1)
and (2).
Stochastic targets and preference shocks can also be incorporated
by suitably expanding the vector ![]() . Return to text
. Return to text
5. In the case of the United States, the reserve bank presidents serve one-year terms as voting members of the FOMC on a rotating basis, except for the president of the New York Fed. Furthermore, substantial turnover among the reserve bank presidents and the members of the Board of Governors arises due to retirement and outside options. With the (up to) seven members of the Board of Governors being nominated by the U.S. President and confirmed by the U.S. Senate, the composition of views in the FOMC may be affected by the views of the political party in power at the time of the appointment. Chappel et al. (1993) and Berger adn Woitek (2005) find evidence of such effects in the U.S. and Germany, respectively. Return to text
6. Such a framework would build on the seminal contributions of Chari and Kehoe (1990), and Kehoe and Levine (1993). A related approach using a model of imperfect information is described in Sleet (2001). Most of these frameworks model the private sector as a representative household therefore avoiding the coordination problem. Return to text
7. The indicator function is only needed
because when deriving equation (10) we have divided
all terms by
![]() , which can be done only if
, which can be done only if
![]() . Return
to text
. Return
to text
8. The authors also propose a way to detect and compute the multiple equilibria, which we view as a complement to our analysis. Return to text
9. Dennis and Kirsanova (2010) propose alternative selection devices based on the concepts of robustness and learnability. Return to text
10. The associated derivations, which follow the steps in Ljungqvist and Sargent (2004) (Ch. 5), are omitted for brevity and area available upon request. Return to text
11. Our sample codes incorporate these correction terms. Return to text
12. Sticky nominal wages and prices follow the formulations of Erceg et al. (2000) and Yun (1996). Return to text
13. Whereas we consider conditional welfare gains, the figure is similar if we do not condition on the realization of the shocks. Return to text
14. This result is formally proven in Debortoli and Nunes (2010a). Return to text
15. The result is instead consistent with those of Debortoli and Nunes (2010a). Also, as discussed there, the shape of the relative welfare gains change with the commitment metric. Here, we are considering and comparing results in the literature along the probability of commitment metric. Return to text
16. Evans and Honkapohja (2003) discuss how interest rate rules can implement the optimal policy plan, while targeting rules are discussed by Giannoni and Woodford (2010) in a general framework and by Debortoli and Nunes (2010b) in a loose commitment setting. Return to text
17. For comparability with some studies
the coefficient on inflation and output-gap should be adjusted as
![]() and
and
![]() ,
respectively. Return to text
,
respectively. Return to text
18. For example, an optimal policy plan under full-commitment displays history dependence even when all the disturbances are i.i.d. and in the absence of natural state variables. See e.g. Galí (2008, ch. 5). Return to text
19. The responses to other shocks also present the same features and are omitted for brevity, but are available upon request. Return to text
20. However, this result is not obvious in the current model. The presence of both price and wage rigidities implies a trade-off between inflation and output stabilization, and thus a scope for commitment, even in response to demand and technology shocks. Return to text
21. The conditional cross-correlations are omitted for brevity and are available upon request. Return to text
This version is optimized for use by screen readers. Descriptions for all mathematical expressions are provided in LaTex format. A printable pdf version is available. Return to text