
Should Risky Firms Offer Risk-Free DB Pensions?
Keywords: Pensions, bankruptcy, risk, portfolio choice
Abstract:
1 Introduction
In this paper we ask whether corporations can increase shareholder value by fully insulating their pension promises from the risks of market fluctuations and bankruptcy. Although traditional pensions have declined in importance relative to 401(k)-style accounts, they remain a substantial force in the U.S. economy, with around 42 million participants1 and assets totaling $2 trillion.2 Insulating these plans from market risks would represent a sharp departure from current practice, as about two-thirds of the aggregate assets held by the largest 100 plans at the end of 2007 were invested in equities and other risky investments.3 With the value of pension assets having declined an estimated 28 percent in 2008,4 most plans are expected to report substantial underfunding in their forthcoming annual reports.5 In addition to wiping out a substantial portion of pension assets, the economic downturn has also pushed many firms closer to bankruptcy, making it more likely that firms will fail with insufficient assets to pay out promised pension benefits. Much of this risk is borne by the Pension Benefit Guarantee Corporation (PBGC), the federal insurer of private defined-benefit plans. The PBGC collects premiums from firms and assumes the assets and liabilities of underfunded plans at bankrupt firms. The insurance reduces employees' exposure to lost benefits but does not eliminate it because PBGC pension payments are capped.6 Moreover, because PBGC premiums are underpriced7 and the PBGC is itself invested in risky assets, much of the risk borne by the PBGC may ultimately be the responsibility of taxpayers.8 Indeed, in January 2009, the Government Accountability Office (GAO) designated the PBGC as "high-risk," citing the ongoing threat of losses from terminated underfunded plans, the risk of large investment losses from the PBGC's new investment policy, and the long-term decline in premium revenue due to the shift toward defined-contribution plans.9 The current crisis is not the first episode to highlight the riskiness of the private pension system. In 2001, a so-called "perfect storm" of falling stock prices and low interest rates helped to convert an $18 billion surplus among the 100 largest pension plans into a $163 billion deficit,10 while the PBGC experienced a substantial balance-sheet reversal from a $7.7 billion surplus to a $3.6 billion deficit.11 Since financial distress in pension funds can have a significant impact on firms, employees, the PBGC, and the national economy, a natural question is whether firms and workers benefit from bearing so much risk in the pension promise. We start from the observation that firms could remove most of the risk from their pension promises by contributing a sufficient amount of resources to the pension trust and by investing the trust in a risk-free portfolio that delivers cash flows that closely match those of future pension liabilities (Bodie, 1990). Such a strategy would effectively defease the liabilities associated with promised benefits.12 But while firms could eliminate most pension risk if they chose to, we are unaware of any firms in the U.S. that currently make their pension promises close to risk-free.13 In a simple model of the U.S. pension system, we find that the practice of offering risky pensions could well be financially inefficient; if employees are informed about the risk properties of the pension, they will demand extra compensation for taking on pension risk, and this extra compensation will lead to a net increase in the firm’s total costs as long as pension insurance is fairly priced. In our model, firms seek to minimize total compensation costs, workers operate in a competitive labor market, and a government insurance agency guarantees some fraction of benefits. The starting point for our analysis is Bulow’s (1982) observation that if compensation is subject to constant renegotiation, benefits and salary should equal the value of the employee’s marginal product in each period.14 As Bodie has argued (1988,1990), an important implication of this market clearing condition is that workers must be compensated for any additional risk in the firm’s pension plan, and that this transfer can be sufficiently large as to make risky pensions an inefficient form of compensation. The primary contribution of our paper is to formally develop these insights in a simple model of optimal pension financing. Bader (2004) provides an especially clear description of the central argument. Asking one to think of the pension promise as an "employer bond" subject to default risk, he notes that "[u]nlike the investors who determine market prices, the employee cannot diversify the company-specific risk to which he is already overexposed, so he would not pay the full market price. Nor would it be rational for him to give up enough salary to cover the full market value of the risky pension." Even if the pension itself represents the only source of nondiversifiable risk, employees would still discount the future cash flows implicit in the "bond" at a higher rate than would investors purchasing the bond on the open market. Using an equilibrium model of pension financing, we examine the proposition that firms cannot increase shareholder value by issuing employees what is essentially a risky, nontransferable bond.15 For most specifications of the model, regardless of our assumptions about risk aversion, the firm’s beta, and initial values of the firm’s financial health, we find that the firm's optimal pension decision is a corner solution: the firm contributes the present value of pension benefits, and it allocates the trust fund entirely to the risk-free asset. Further, we find that the net value to the firm of a risky pension promise generally grows more negative as the pension becomes riskier.16 The one specification where we find that a risky pension may be optimal is the case in which the government insurance agency charges less than market value for its pension guarantee. In this case, the firm and the employee can effectively split the surplus gained at the expense of the government pension insurance, and by extension, at the expense of U.S. taxpayers. Even in this case, however, the model's equilibrium equity shares are much smaller than those observed in the real world. We should note that we arrive at the risk-free pension strategy without making any extreme assumptions about risk aversion or the return process on equities. Indeed, we obtain the result assuming a much lower degree of risk aversion than is implied by the market pricing procedure we use to compute the value of the risky pension to the firm. While we select conventional values of risk aversion for the representative employee’s utility function, we compute the market price of pension risk using a risk-neutral (or equivalent martingale) probability measure. With complete markets, the risk-neutral probabilities can be replicated by the state-contingent discounted marginal utilities of a representative agent, so that risk aversion and the equity premium are closely linked. In our model, however, markets are incomplete, and we therefore select risk aversion parameters independently of the asset return process. Because of the well-known equity premium puzzle, the more plausible values of risk aversion assumed in our model turn out to be much lower than those required to match the historical risk premium on equities.17 If we were to "close the loop" by specifying a higher degree of risk aversion in order to endogenously produce the equity return process, the risk-free pension strategy would go through with even more force.
2 Previous Literature
As mentioned above, Bodie (1988,1990) and Bulow (1982) first laid out many of the central arguments we develop in our model. More generally, our paper descends from a long line of pension research. Munnell (1982) provides a history of corporate pension plans in the U.S. Early authors noted that bankruptcy gives firms a put option on the difference between promised benefits and the pension assets (Black, 1980; Sharpe, 1976; Treynor, 1977). Since the value of the put rises with the volatility of the underlying asset, shareholders benefit if the pension fund is invested in risky assets (Treynor, 1977). Sharpe (1976), however, pointed out that employees will negotiate the value of wages and benefits to keep them above a certain level.18 But missing from these earlier studies is a recognition that employees are typically unable to hedge the risks associated with default. Employees are generally either restricted from short-selling company stock, or they lack the financial sophistication to do so. This puts them in a similar position as risk-averse executives who receive part of their compensation in the form of company stock. Hall and Murphy (2002) and Cai and Vijh (2005) argue that such executives should place a lower value on stock options than traditional valuation methods (e.g., Black-Scholes) would predict. Although the pension risks facing employees are quite different from the stock-option risks facing executives, we obtain a similar result. A few recent studies have examined other factors affecting pension funding and investment decisions. Rauh (forthcoming) finds that, since solvent firms must make up any pension shortfall, some firms with poorly funded pension plans invest their pensions in safer assets. In this case, the "risk management incentive" outweighs the put option of shifting risks to the employee. In the other direction, Lucas and Zeldes (2006) find that as long as wage growth and equity returns are sufficiently correlated, firms can benefit from investing the fund in equities as a hedge against future pension obligations (which are linked to wages through the benefits formula). Finally, a number of authors, including Bader (2003), Bodie (1988,1990), Gold (2003), Ralfe, Speed, and Palin (2004), and Wilcox (2006), have recently argued that pension funds should hold only riskless assets for various reasons, including immunization against interest rate movements, reduced balance-sheet risk, improved pension security for employees, improved tax efficiency, and reduced administrative costs. However, none of these papers develops an explicit model of pension funding and investment in the context of an equilibrium model of employee compensation, which is the primary focus of our paper.
3 Institutional Background and Empirical Findings
Firms that compensate employees with pension promises are generally required to maintain a separate pension trust fund for the benefit of the eventual recipients. Minimum contributions are required under the Employee Retirement Income Security Act (ERISA) and the tax code, which sets out the conditions that must be met for the trust fund and pension contributions to receive favorable tax treatment. Investment of the trust fund is not heavily regulated under ERISA, though investments must be made for the benefit of the employees and must be “prudent.â€19 Plans that become underfunded must generally make up funding shortfalls over time.20 Bankruptcy, however, generally relieves the firm of its obligation to make up funding shortfalls. In bankruptcy, a firm with an underfunded pension usually terminates the plan and turns over both its assets and liabilities to the PBGC, which invests the assets and assumes the responsibility of paying out promised benefits (up to the cap). In exchange for this insurance coverage, the PBGC charges solvent firms a premium of $34 per participant (in 2009), plus 0.9 percent of any unfunded benefits.21 As noted above, many pension plans are underfunded and most invest heavily in risky assets. Table 1 shows the funding status of the largest 100 corporate pension plans from 2001 to 2007. Line 1 shows that the aggregate funding status, defined as total plan assets divided by total projected liabilities,22 deteriorated substantially from full funding in 2001 to about 83 percent funding the following year, corresponding to the earlier pension funding crisis mentioned above. Funding levels improved a bit in 2003, remaining at about 90 percent until they once again reached full funding in 2006 and 2007. As noted earlier, given the sharp drop in pension asset values in 2008, we expect the 2008 funding levels to be at least as low as those in 2002-2003. Lines 2 through 4 show that the aggregate pattern masks significant heterogeneity. Even in the “fully funded†year of 2001 about half of the plans were underfunded, and 13 percent were significantly (more than 20 percent) underfunded. In the “crisis†year that followed, about three-quarters of plans were underfunded and 44 percent were significantly underfunded. By 2007, when the aggregate funding ratio reached 106 percent, 42 of the largest 100 plans remained underfunded, and 4 remained significantly underfunded. Again, we expect the 2008 figures to resemble those from 2002-2003. The funding gyrations shown in Table 1 are caused by exposure to volatility in stock returns and interest rates, but also by changes in contributions. As shown in line 5, the market downturn forced many firms to make large contributions to help close the gap--aggregate contributions tripled from $11 billion in 2001 to $34 billion the following year and reached $57 billion in 2003. By 2007, contributions had declined to $27 billion (still more than double the 2001 level).23 Table 2 reports the share of pension assets held in equity and other risky investments in recent years.24 As shown in line 1, about 69 percent of the aggregate portfolio was invested in risky assets in 2007. Lines 2 through 4 show that about 10 percent of plans hold more than 80 percent of assets in equities and other risky investments, while only a small fraction--four percent in 2007--hold less than 50 percent in risky assets. Most firms continue to hold about 70-80 percent of assets in risky investments. The summary statistics reported in Tables 1 and 2 highlight the fact that private pension plans are exposed to significant risks associated with underfunding and investment losses.
4 The model
Our model describes the behavior of a representative firm, an employee, and (in some variants) a government insurer of defined-benefit pension plans. We take as given that the firm is offering a DB plan, and ask how it should be funded, conditional on being offered. In particular, we are
interested in how employees and firms value risk in the pension promise, and under what conditions firms would choose to offer risky, rather than risk-free, pension benefits. In the model, the firm seeks to maximize shareholder value by minimizing total compensation costs, which include both wages
and the cost of providing a defined-benefit-type pension. The employee must decide how much of first-period compensation to save and how to allocate that saving between a risk-free asset and the equity market. The firm must provide a compensation package that is capable of generating a reservation
level of expected utility assuming that the employee solves the relevant saving and investment problems optimally. Finally, in the extended model, a government agency insures part or all of the promised pension benefit. The model is essentially a two-period affair. In return for the compensation
package that provides the reservation level of utility, the employee supplies one unit of labor in the first period and a fraction of a unit of labor in the second period.25 As compensation for that labor, the firm pays its employee wages ![]() in the first period,
in the first period, ![]() in the second period, and it promises to pay a pension benefit,
in the second period, and it promises to pay a pension benefit, ![]() , in the second period. As of
, in the second period. As of ![]() , the pension promise may be risky: The firm's ability to pay the full benefit depends on the amount it contributes to the pension trust fund in the first period, the returns it earns on the trust fund assets (which depend on the allocation
of the assets between the risk-free asset and the market portfolio of equities), and whether the firm declares bankruptcy in the second period. We begin by considering the firm's and the employee's problems, and introduce the government insurer later.
, the pension promise may be risky: The firm's ability to pay the full benefit depends on the amount it contributes to the pension trust fund in the first period, the returns it earns on the trust fund assets (which depend on the allocation
of the assets between the risk-free asset and the market portfolio of equities), and whether the firm declares bankruptcy in the second period. We begin by considering the firm's and the employee's problems, and introduce the government insurer later.
4.1.1 The pension trust fund
In the first period, the firm pays a wage, ![]() , contributes
, contributes ![]() to its pension
trust fund, and chooses an allocation of the pension fund between a risk-free asset and a risky asset that can be thought of as the market portfolio of equities.26 The risk-free asset pays a gross return of
to its pension
trust fund, and chooses an allocation of the pension fund between a risk-free asset and a risky asset that can be thought of as the market portfolio of equities.26 The risk-free asset pays a gross return of ![]() , while the risky asset generates a stochastic return of
, while the risky asset generates a stochastic return of ![]() . Letting
. Letting ![]() denote the share of the trust fund invested in equities, the value of the trust fund in the second period is given by
denote the share of the trust fund invested in equities, the value of the trust fund in the second period is given by
![]() . If
. If
![]() exceeds the promised level of benefits, the surplus reverts to the firm regardless of whether the firm declares bankruptcy in the second period. The structure of this payoff is
equivalent to a conventional European call option on the excess in the trust fund over the promised benefit. We denote the value of this call
exceeds the promised level of benefits, the surplus reverts to the firm regardless of whether the firm declares bankruptcy in the second period. The structure of this payoff is
equivalent to a conventional European call option on the excess in the trust fund over the promised benefit. We denote the value of this call
![]() . If, on the other hand,
. If, on the other hand,
![]() falls short of the promised level of benefits, the firm must contribute enough in the second period to eliminate the shortfall, unless the firm enters bankruptcy. Thus, in
addition to being long a conventional European call option on the value of the trust-fund assets, the firm is short a European put; crucially, however, the put is exercised on the firm only when the firm survives in the second period. We denote the value of this non-standard put option as
falls short of the promised level of benefits, the firm must contribute enough in the second period to eliminate the shortfall, unless the firm enters bankruptcy. Thus, in
addition to being long a conventional European call option on the value of the trust-fund assets, the firm is short a European put; crucially, however, the put is exercised on the firm only when the firm survives in the second period. We denote the value of this non-standard put option as
![]() , where
, where ![]() is an indicator variable for whether the
firm survives.
is an indicator variable for whether the
firm survives.
4.1.2 Bankruptcy
The value of the firm’s non-pension assets evolves according to a stochastic rate of return ![]() , which may, in general, be correlated with the return on the market
portfolio,
, which may, in general, be correlated with the return on the market
portfolio, ![]() . To allow for such correlation, we follow Rubinstein (1994) and assume that the log returns on the market portfolio and the company stock
follow a joint binomial distribution. The appendix provides details of how we use this method to value the put and call options using a risk-neutral approach. The firm declares bankruptcy when the value of the firm's non-pension assets,
. To allow for such correlation, we follow Rubinstein (1994) and assume that the log returns on the market portfolio and the company stock
follow a joint binomial distribution. The appendix provides details of how we use this method to value the put and call options using a risk-neutral approach. The firm declares bankruptcy when the value of the firm's non-pension assets,
![]() , falls below its liability to creditors in the second period,
, falls below its liability to creditors in the second period, ![]() .
Letting
.
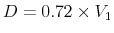
Letting ![]() be an indicator variable for the survival of the firm, the bankruptcy threshold is given as follows:
be an indicator variable for the survival of the firm, the bankruptcy threshold is given as follows:
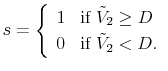 |
(1) |
As in previous models of pension funds (see, for example, Pennacchi and Lewis (1994)), we do not allow bankruptcy itself to depend on the pension surplus or shortfall. The reason is that the pension shortfall depends on contributions, and contribution decisions have only a small impact on the probability of bankruptcy. To see why, note that from the perspective of the combined economic balance sheet, financial distress occurs when total (i.e., pension plus non-pension) assets fall below total liabilities. That is, the firm is distressed when
4.1.3 Total compensation costs
In total, the firm's compensation costs are given by:
where
4.2 The employee's problem
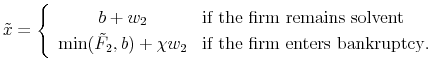
The employee receives a wage, ![]() , in the first period. If the firm avoids bankruptcy, the employee receives a wage in the second period,
, in the first period. If the firm avoids bankruptcy, the employee receives a wage in the second period, ![]() , and promised pension benefits,
, and promised pension benefits, ![]() . As noted above, one can think of the second period as spanning the tail end of the working
life through retirement. If the firm enters bankruptcy in the second period, the employee has a claim on the lesser of promised benefits and the value of assets held in the trust fund. In addition, the employee is assumed to have some firm-specific human capital at stake. If the firm goes bankrupt,
the worker receives a wage in period 2 of
. As noted above, one can think of the second period as spanning the tail end of the working
life through retirement. If the firm enters bankruptcy in the second period, the employee has a claim on the lesser of promised benefits and the value of assets held in the trust fund. In addition, the employee is assumed to have some firm-specific human capital at stake. If the firm goes bankrupt,
the worker receives a wage in period 2 of ![]() , where
, where
![]() .29 The existence of a
second-period wage is not required to derive our main results; we include it, however, to allow for the possibility that the worker is exposed to some non-pension risk in the event of bankruptcy. From the employee's perspective, second-period compensation can be treated as a random variable,
.29 The existence of a
second-period wage is not required to derive our main results; we include it, however, to allow for the possibility that the worker is exposed to some non-pension risk in the event of bankruptcy. From the employee's perspective, second-period compensation can be treated as a random variable,
![]() , with the following payoffs:
, with the following payoffs:
The employee chooses consumption and the portfolio share in the risky asset in order to maximize the following two-period lifetime utility function:
| (4) |
where
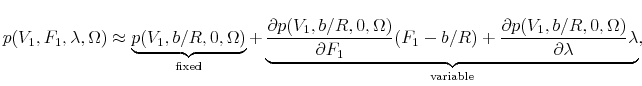
5.1.1 Net value to the firm of a risky pension promise
To solve for the optimal pension strategy, we first compute the certainty-equivalent first-period payment, ![]() , that would make the worker indifferent between a risky pension promise and a
safe pension promise. (We call a pension strategy "risky" if
, that would make the worker indifferent between a risky pension promise and a
safe pension promise. (We call a pension strategy "risky" if ![]() and/or
and/or
![]() , and we call a pension strategy "risk-free" if
, and we call a pension strategy "risk-free" if ![]() and
and
![]() .) Since
.) Since ![]() measures the utility cost to the employee of a risky pension
promise relative to a safe one, we can compare
measures the utility cost to the employee of a risky pension
promise relative to a safe one, we can compare ![]() to the cost savings the firm achieves by offering a risky pension, holding wages constant. The cost savings to the firm,
to the cost savings the firm achieves by offering a risky pension, holding wages constant. The cost savings to the firm, ![]() , consists of two pieces: the reduction in first-period pension contributions and the increase in the value of the pension options. That is:
, consists of two pieces: the reduction in first-period pension contributions and the increase in the value of the pension options. That is:
| (5) |
By construction, a risk-free pension strategy will generate zero cost savings, so that
5.1.2 Effect of the firm's beta
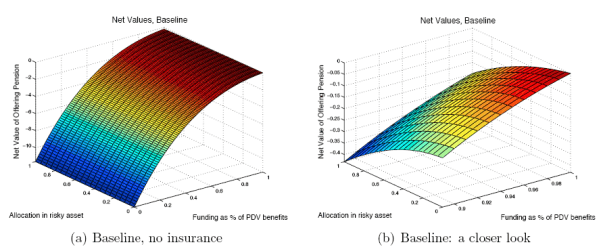
How does the degree of correlation between the firm and the market affect the net value associated with a firm's pension strategy? Intuitively, higher degrees of correlation make it more likely that a worker will experience a reduction in pension benefits since poor pension asset returns will tend to coincide with poor performance at the firm level. Employees should therefore demand additional compensation when the correlation is positive. The results in Table 5 suggest that this is indeed the case. As the allocation to the risky asset increases above zero, the net values in the positive correlation case grow more negative, relative to the zero-correlation case. A negative correlation between the market portfolio and the firm's value would seem to provide some scope for the firm to gain from a risky pension strategy. Intuitively, a negative correlation means that employees are likely to receive their promised pension benefits even if the firm goes bankrupt because pension asset returns are likely to be high. Since the worker is already exposed to own-firm risk in the form of firm-specific human capital, a negative correlation reduces the cost to the worker of a pension allocated to the risky asset. The results in Table 5, however, indicate that the even a negative-beta firm cannot benefit from a risky pension promise when the pension is fully funded. At lower levels of funding, in contrast, the firm can increase the net values somewhat, holding contributions constant, by investing some of the pension in equities. The reason is an underfunded pension grants the worker a portion of the upside equity risk in the event of bankruptcy. Since equities are likely to have a high return in states of bankruptcy and since some human capital is at stake, the worker would like to have a bigger equity position in bankruptcy states. The equity investment in the pension allows the worker to achieve such a position. Nonetheless, this effect is not strong enough to make a risky pension optimal--all the net values in the table remain negative.
5.2 Effect of pension insurance
Results from the baseline model without pension insurance reported above indicate that it is always optimal for the firm to offer a risk-free pension promise. We now expand the model to include federal pension insurance, a key feature of the pension landscape in the U.S. To see how pension
insurance affects the sponsor's decisions in our model, we introduce a government agency that guarantees pension benefits up to an amount, ![]() , with a strict equality indicating full
coverage. In return for providing this insurance, the agency charges the firm a premium, denoted
, with a strict equality indicating full
coverage. In return for providing this insurance, the agency charges the firm a premium, denoted ![]() , that may or may not be economically fair.34 The introduction of pension insurance alters the underlying problem in two ways. First, the compensation cost is now given by:
, that may or may not be economically fair.34 The introduction of pension insurance alters the underlying problem in two ways. First, the compensation cost is now given by:
where
![\displaystyle \tilde{x}=\left\{ \begin{array}{cl} b+w_2&\text{if the firm survives}\ \min(b,\max[\tilde F_2,g])+\chi w_2&\text{if the firm enters bankruptcy}, \end{array}\right.](img58.gif) |
(7) |
where the bankruptcy payoff,
5.2.1 Case 1: Complete insurance and an economically fair premium
We begin with the case of complete coverage, ![]() , and an economically fair premium. The first thing to notice is that complete coverage effectively removes the employee from the firm's
decision. No matter how the firm funds its pension, the employee will always receive promised benefits. As a result, the employee will no longer impose discipline on the firm by demanding appropriate compensation for risk. However, an economically fair premium will impose its own discipline. A
reasonable definition of an economically fair insurance premium is the market value of the obligation to cover any shortfall in the state of bankruptcy,
, and an economically fair premium. The first thing to notice is that complete coverage effectively removes the employee from the firm's
decision. No matter how the firm funds its pension, the employee will always receive promised benefits. As a result, the employee will no longer impose discipline on the firm by demanding appropriate compensation for risk. However, an economically fair premium will impose its own discipline. A
reasonable definition of an economically fair insurance premium is the market value of the obligation to cover any shortfall in the state of bankruptcy,
![]() . Again using the option value as an an approximation of the shortfall obligation, the fair market insurance premium is given by:
. Again using the option value as an an approximation of the shortfall obligation, the fair market insurance premium is given by:
Setting the premium equal to the conditional put has the desirable property that the marginal change in premiums will always equal the marginal increase in the value of the put and call options. Thus, any change in pension strategy will cause insurance premiums to adjust in tandem with the change in the market value of the pension risk. In particular, any increase in the riskiness of the pension promise will result in a higher premium.35 We can formalize this result by first recognizing that the sum of an economically fair premium and the value of the firm's obligation to cover shortfalls if it survives is simply an unconditional put on the market portfolio with a strike price of
where the last line follows from the fact that an unconditional put equals the sum of the conditional puts in bankruptcy and solvency. Substituting equation (9) into the firm's cost function, we have:
We find that the put associated with the shortfall is no longer conditional and now depends only on a single underlying asset--the market portfolio. Notice, however, that by put-call parity,
Substituting this expression back into (10), it is clear that regardless of the firm's contribution and allocation decisions, total costs will always be the same:
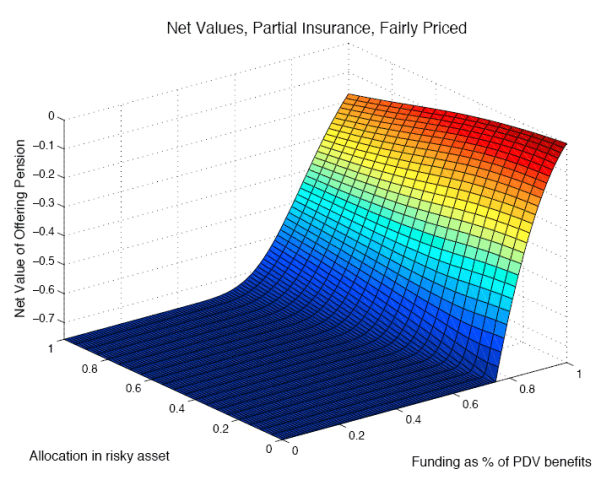
5.2.2 Case 2: Incomplete insurance and an economically fair premium
We now consider the case of imperfect insurance, where the guarantee is less than promised benefits: ![]() . If the insurance is economically fair,
. If the insurance is economically fair,
![]() , and the firm receives some benefit from offering risky insurance as long as employees do not demand additional compensation.36 In bankruptcy, the firm still owns a call on any pension surplus, but it effectively pays for only part of the put covering any shortfall. Nevertheless, because the employee understands
the implications of the firm's pension strategy, she will end up demanding additional compensation that more than offsets the benefit to the firm. Figure 7 shows the result for the case of a zero-beta firm with a pension guarantee equal to 75 percent of promised benefits. The
front edge of the figure, which corresponds to different levels of contributions holding the equity investment at zero, shows that the net values are essentially flat for funding levels below the maximum guaranteed level of benefits. As the funding level rises above the benefit guarantee, the front
edge of the net value surface rises sharply as the worker concedes a higher fraction of wages in exchange for a less risky pension. The back edge of Figure 7 shows a similar increase in net values near the point of the guarantee, but the transition is less abrupt due the
smoothing effect of uncertain asset returns. When the pension is invested entirely in the safe asset, the worker knows for certain that she will receive guaranteed benefits if the firm goes bankrupt. By contrast, when some of the pension is invested in the market portfolio, a favorable equity
return can push the fund above the guaranteed amount, a possibility that increases the value of the risky pension to the worker. Again, however, it is worth emphasizing that the net value surface reaches a clear maximum at the point of full funding and zero equity risk. (Although we only present
the figure for the zero-beta firm, we obtain similar figures for our other parameterizations of correlation, risk aversion, and bankruptcy risk.) Thus, if pension insurance is incomplete and the premium is at least the economically fair value, the firm's optimal decision will be to fully fund its
pension and invest the trust fund solely in the risk-free asset.
, and the firm receives some benefit from offering risky insurance as long as employees do not demand additional compensation.36 In bankruptcy, the firm still owns a call on any pension surplus, but it effectively pays for only part of the put covering any shortfall. Nevertheless, because the employee understands
the implications of the firm's pension strategy, she will end up demanding additional compensation that more than offsets the benefit to the firm. Figure 7 shows the result for the case of a zero-beta firm with a pension guarantee equal to 75 percent of promised benefits. The
front edge of the figure, which corresponds to different levels of contributions holding the equity investment at zero, shows that the net values are essentially flat for funding levels below the maximum guaranteed level of benefits. As the funding level rises above the benefit guarantee, the front
edge of the net value surface rises sharply as the worker concedes a higher fraction of wages in exchange for a less risky pension. The back edge of Figure 7 shows a similar increase in net values near the point of the guarantee, but the transition is less abrupt due the
smoothing effect of uncertain asset returns. When the pension is invested entirely in the safe asset, the worker knows for certain that she will receive guaranteed benefits if the firm goes bankrupt. By contrast, when some of the pension is invested in the market portfolio, a favorable equity
return can push the fund above the guaranteed amount, a possibility that increases the value of the risky pension to the worker. Again, however, it is worth emphasizing that the net value surface reaches a clear maximum at the point of full funding and zero equity risk. (Although we only present
the figure for the zero-beta firm, we obtain similar figures for our other parameterizations of correlation, risk aversion, and bankruptcy risk.) Thus, if pension insurance is incomplete and the premium is at least the economically fair value, the firm's optimal decision will be to fully fund its
pension and invest the trust fund solely in the risk-free asset.
5.2.3 Case 3: Complete insurance and a mispriced premium
Mispricing of insurance can occur along any or all dimensions of risk: bankruptcy, pension funding, or pension allocation. One way to characterize mispricing along different dimensions of risk is to consider a linearized version of the premium function in equation (8):
 |
where
where
Using the definition of the economically fair premium,
Applying put-call parity, we arrive at the following expression for the firm's costs:
Since
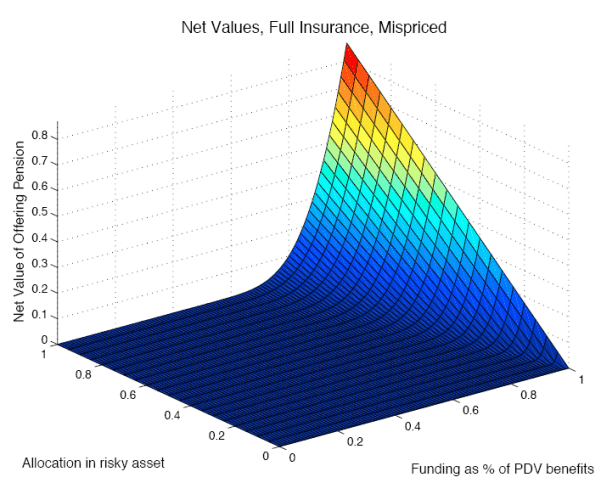
5.2.4 Case 4: Incomplete insurance and an underpriced premium
In reality, pension insurance is both incomplete and mispriced. If insurance is incomplete and the firm deviates from the risk-free strategy, the employee will be exposed to some degree of pension risk and will therefore demand additional compensation from the firm. In this case, the firm will
trade off any benefits from mispricing against the discipline imposed by the employee in the form of increased wage demands. We again consider two specific forms of mispricing: one where the insurer fails to price allocation risk and another that represents a simplified version of the PBGC's linear
variable rate premium on underfunding. Figure 7 shows the net value surface for the first type of mispricing with a guarantee equal to 75 percent of promised benefits (
![]() ). The first thing to note about the surface is that the front edge, which corresponds to an investment allocation entirely in the safe asset, looks exactly like the front edge
in Figure 7, which shows the net values in the presence of incomplete, but fairly priced, insurance. Thus, if the firm were constrained to invest only in the safe asset, the optimal strategy would again be to fully fund the pension by contributing the present value of promised
benefits. In this case, if the firm reduced contributions below full funding, the pension insurer would charge an economically fair amount for the risks associated with underfunding, and the worker would demand additional compensation in exchange for risking a portion of promised benefits. The
combined cost of insurance and the wage demand in this case would exceed any benefit associated with underfunding. If the firm is not constrained to invest only in the risk-free asset, however, an alternative strategy presents itself. Examining the back spine of Figure 7, we can
see that the net values reach a maximum at the point where contributions are equal to the discounted present value of insured benefits (75 percent of promised benefits) and the pension is allocated entirely to the risky asset. Here, the firm can maximize value by exploiting the insurance agency's
mispricing of allocation risk. While it seems intuitive that the firm can exploit this type of mispricing by investing the fund in the risky asset, why does the net value surface reach a maximum along the ridge where contributions equal the present value of guaranteed benefits? This point is
special because both the worker and the firm are entirely protected against the consequences of downside market risk. If the market drops even a fraction, benefits remain unchanged. If, on the other hand, the market rises, the worker will receive more than the guaranteed level of benefits. The
worker still demands additional compensation for being forced to take on the risk of losing pension benefits in the event of bankruptcy, but this compensation actually falls with increased allocation risk as contributions approach the guaranteed amount. On the other side of the ridge, where
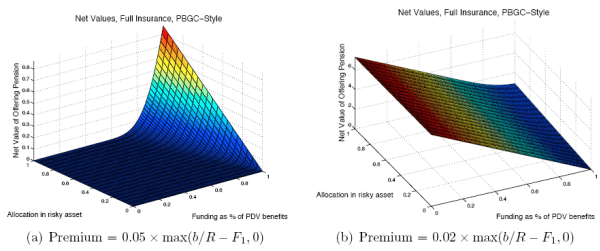
contributions fall below the guarantee, the net values decrease rapidly. In this region, the firm has to pay both the worker, in the form of compensating wage demands, and the insurance agency for the risks of underfunding. Mispricing that resembles the PBGC's variable premium can generate extreme
solutions to the firm's optimal pension policy. The net value surface in the left panel of Figure 7 corresponds to the case of a relatively high linear premium equal to 5 percent of unfunded guaranteed benefits. The right panel of the figure shows the surface for a lower premium
equal to 2 percent of underfunding. The net value surfaces in both panels display a marked "V" shape, with values rising on either side of the guaranteed level of funding. The surface rises for contributions above the guarantee because the worker offers wage concessions in exchange for a less
risky pension. Below the guarantee, the employee becomes increasingly indifferent to the funding level and allocation of the pension. Here, the net values respond primarily to the change in the value of the firm's pension options (the call less the conditional put) relative to the linear premium on
underfunding. When the premium is high, as in the left panel of the figure, the firm prefers to fully fund its pension and invest the fund entirely in the risky asset. (Again, with a linear premium, there is no marginal cost of allocation risk.) However, when the premium is sufficiently low, as in
the right panel of the figure, the firm can best take advantage of the mispricing by completely underfunding its pension, or at least funding it at the lowest amount allowable by law. Since the real world features both incomplete insurance and underpriced premiums, our findings in this case help
explain why so many firms offer risky pension plans rather than risk-free promises.
). The first thing to note about the surface is that the front edge, which corresponds to an investment allocation entirely in the safe asset, looks exactly like the front edge
in Figure 7, which shows the net values in the presence of incomplete, but fairly priced, insurance. Thus, if the firm were constrained to invest only in the safe asset, the optimal strategy would again be to fully fund the pension by contributing the present value of promised
benefits. In this case, if the firm reduced contributions below full funding, the pension insurer would charge an economically fair amount for the risks associated with underfunding, and the worker would demand additional compensation in exchange for risking a portion of promised benefits. The
combined cost of insurance and the wage demand in this case would exceed any benefit associated with underfunding. If the firm is not constrained to invest only in the risk-free asset, however, an alternative strategy presents itself. Examining the back spine of Figure 7, we can
see that the net values reach a maximum at the point where contributions are equal to the discounted present value of insured benefits (75 percent of promised benefits) and the pension is allocated entirely to the risky asset. Here, the firm can maximize value by exploiting the insurance agency's
mispricing of allocation risk. While it seems intuitive that the firm can exploit this type of mispricing by investing the fund in the risky asset, why does the net value surface reach a maximum along the ridge where contributions equal the present value of guaranteed benefits? This point is
special because both the worker and the firm are entirely protected against the consequences of downside market risk. If the market drops even a fraction, benefits remain unchanged. If, on the other hand, the market rises, the worker will receive more than the guaranteed level of benefits. The
worker still demands additional compensation for being forced to take on the risk of losing pension benefits in the event of bankruptcy, but this compensation actually falls with increased allocation risk as contributions approach the guaranteed amount. On the other side of the ridge, where
contributions fall below the guarantee, the net values decrease rapidly. In this region, the firm has to pay both the worker, in the form of compensating wage demands, and the insurance agency for the risks of underfunding. Mispricing that resembles the PBGC's variable premium can generate extreme
solutions to the firm's optimal pension policy. The net value surface in the left panel of Figure 7 corresponds to the case of a relatively high linear premium equal to 5 percent of unfunded guaranteed benefits. The right panel of the figure shows the surface for a lower premium
equal to 2 percent of underfunding. The net value surfaces in both panels display a marked "V" shape, with values rising on either side of the guaranteed level of funding. The surface rises for contributions above the guarantee because the worker offers wage concessions in exchange for a less
risky pension. Below the guarantee, the employee becomes increasingly indifferent to the funding level and allocation of the pension. Here, the net values respond primarily to the change in the value of the firm's pension options (the call less the conditional put) relative to the linear premium on
underfunding. When the premium is high, as in the left panel of the figure, the firm prefers to fully fund its pension and invest the fund entirely in the risky asset. (Again, with a linear premium, there is no marginal cost of allocation risk.) However, when the premium is sufficiently low, as in
the right panel of the figure, the firm can best take advantage of the mispricing by completely underfunding its pension, or at least funding it at the lowest amount allowable by law. Since the real world features both incomplete insurance and underpriced premiums, our findings in this case help
explain why so many firms offer risky pension plans rather than risk-free promises.
6 Discussion and Interpretation of Results
Unless pension insurance is underpriced, we find that firms will increase shareholder value by offering its employees a risk-free pension promise, because the cost to the firm of compensating the employee for risk exceeds the benefit to the firm from lower expected contributions. Further, we find this result without making unrealistic assumptions about the representative employee's degree of risk aversion or the equity return process. As noted above, an endogenously determined equity return process would imply a much higher coefficient of relative risk aversion than we assume in the model--a standard implication of the equity premium puzzle. Thus the risk-free pension strategy is not an artifact of our parameterization of risk aversion or the return process on stocks. Nevertheless, our stylized model does abstract from several factors that may affect pension decisions in the real world, such as labor market frictions, regulations, and imperfect information. We briefly discuss how these issues might affect our benchmark finding that a risk-free pension is optimal from the firm's perspective.
6.1 Taxes
In general, the tax treatment of pensions provides additional incentive for firms to invest the trust fund in the risk-free asset. Trust-fund income is tax-exempt, while other corporate income is not, and stock returns are generally taxed at the lower capital gains rate while fixed-income returns are taxed at the higher regular rate. As demonstrated in Tepper (1981) and Black (1980), it is therefore optimal from a tax-minimizing perspective to invest the trust fund in the higher-taxed asset (i.e., fixed-income) and concentrate the lower-taxed asset (i.e., stocks) outside the trust fund. Thus, including taxes in the model only strengthens our finding that firms should optimally invest the trust fund in the risk-free asset.
6.2 Labor market frictions
The assumption of a competitive labor market is central to our model. Firms take required total compensation as given and allocate wages and pension benefits accordingly. But, in a world with labor market frictions related to search costs and firm-specific human capital, workers might accept less-than-competitive compensation and still remain at the firm.40 In such a case, would a risk-free pension still be an optimal strategy? It would, because the central factors of the model would not change--the risk-averse employee's inability to hedge bankruptcy risk still makes the pension promise an inefficient way to transfer risk. In this case, a firm with market power in the labor market is better off minimizing its costs by reducing wages than by introducing risk into the pension. A related extension is to consider the "implicit contract" model of Ippolito (1985b,a), in which firms optimally pay younger workers less than their marginal product, and older workers more than their marginal product, as a way to encourage workers to stay with the firm. In this case, the firm takes on the risk that rapid wage growth will lead to rapid growth in the pension promise, which is often tied to wages.41 Note that in this extended model, the pension promise becomes stochastic to the firm as well as the employee. Lucas and Zeldes (2006) have argued that if firms face this kind of risk it can be optimal to invest a portion of the pension trust fund in equities, to the extent that stochastic equity returns are correlated with stochastic wage growth. We make two observations on this point. First, while a competitive firm takes the utility of compensation as given, it is free to arrange a pension contract that reduces risk to itself by weakening the dependence of the pension promise on a stochastic variable such as wages. That is, the firm is not forced to accept risk for itself in its pension promise; it could eliminate this risk simply by promising a fixed, rather than wage-derived, pension benefit. Second, and more importantly, in our framework the firm would still not find it optimal to invest the trust fund in the risky asset, because again the central factors--a risk-averse employee facing undiversifiable bankruptcy risk--have not changed. That is, even if the firm and employee faced an uncertain pension promise whose realization were correlated with the risky asset, it would not be optimal from the employee's perspective to compound the pension-promise uncertainty by adding on pension-funding uncertainty. The employee will always prefer any given pension promise to be funded risklessly. As a result, the firm will be better off funding the expected pension benefit risklessly and hedging its wage-derived pension-promise risk by investing in the correlated risky assets outside the trust fund, topping up the trust fund, in the high-wage-growth state of the world, in the later period. This "secondary" (and non-tax-exempt) trust fund would help protect the firm from wage risk, while the primary (tax-exempt) trust fund protects the employee from funding risk.
6.3 Financing considerations and regulations
Our model implicitly assumes that firms are indifferent between internal and external sources of finance, and that pension contributions have no effect on a firm's ability to raise resources for capital investment. If, however, firms face financial constraints, pension contributions may crowd out a portion of internal funds available for new capital projects. Rauh (2006) exploits variation in minimum funding requirements to show that mandatory pension contributions have a strong and negative effect on capital expenditures and that the effect is strongest among younger firms with the greatest need for cash flows. Since underfunding and investing the trust fund in the risky asset can reduce expected contributions, a wedge between the costs of internal and external finance could explain why many firms pursue riskier pension strategies than our model predicts. But again, in our framework, this result would not hold. While pension costs can be reduced by underfunding and investing the trust fund in risky assets, total costs would increase, due to the additional required compensation for risk. Thus, rather than freeing up resources for investment, adding risk to the pension promise would reduce investment resources.
7 Conclusion
We find that the combination of competitive labor markets and risk averse employees who cannot hedge bankruptcy risk makes a risky pension promise an inefficient form of compensation from the standpoint of shareholders. In our model, the optimal pension strategy, in the absence of mispriced pension insurance, is to contribute the present value of benefits to the pension trust fund and to invest those resources entirely in the risk-free asset. In the presence of underpriced pension insurance, however, this result breaks down, because firms and employees can effectively benefit from dividing a surplus gained at the taxpayers' expense. Since PBGC insurance is often characterized as underpriced (Congressional Budget Office, 2005; Brown, 2008), this provides an explanation for some of the large difference between our benchmark results and real-world behavior. Additional explanations are also available, including informational and institutional barriers that slow or prevent the benchmark economic forces from resulting in the theoretical equilibrium. Nevertheless, the simple framework of our model highlights the economic tradeoffs facing regulators, employers, pension trust fiduciaries, and employees. For instance, to the extent that current funding practices are motivated by underpriced pension insurance, opaque accounting standards, or imperfect information on the part of the employees, regulators may choose to address these imperfections by fairly pricing pension insurance, closing funding loopholes, and improving accounting transparency. The Deficit Reduction Act of 2005, the Pension Protection Act of 2006, and FASB's ongoing project to revisit pension accounting standards all represent movement in this direction, but, as highlighted by the dramatic decline in funding status precipitated by the current financial crisis, it remains to be seen whether these changes will be sufficient to prevent promised benefits from being exposed to considerable risk.
Bibliography
"The Structure of Wages and Investment in General Training," The Journal of Political Economy, 107(3), 539-572. "The Case agaist Stock in Corporate Pension Funds," Pension Section News (Society of Actuaries), pp. 17-19. "Pension Deficits: An Unnecessary Evil," Financial Analysts Journal, 60(3), 22-32. "Investment in Human Capital: A Theoretical Analysis," The Journal of Political Economy, 70(5), 9-49. "The Tax Consequences of Long-Run Pension Policy," Financial Analysts Journal, 36, 21-29. Flow of Funds Accounts of the United States. "Pension Fund Investment Policy," NBER Working Paper No. 2752. "The ABO, the PBO, and Pension Investment Policy," Financial Analysts Journal, 41, 10-16. "Guaranteed Trouble: The Economic Effects of the Pension Benefit Guaranty Corporation," Journal of Economic Perspectives, 22(1), 177-198. "What Are Corporate Pension Liabilities?," Quarterly Journal of Economics, 97, 435-452. "Funding Plummets for GM's U.S. Plans," Pensions and Investments, February 18. "Executive Stock and Option Valuation in a Two State-Variable Framework," Journal of Derivatives, 12, 9-27. The Risk Exposure of the Pension Benefit Guarantee Corporation. Washington. "Footnotes Aren't Enough: The Impact of Pension Accounting on Stock Values," Journal of Pension Economics and Finance, 7(3), 257-276. "Did Pension Plan Accounting Contribute to a Stock Market Bubble?," Brookings Papers on Economic Activity, 1, 323-359. Private Pension Plan Bulletin: Abstract of 2006 Form 5500 Annual Reports. U.S. Dept. of Labor. Statement of Financial Accounting Standards No. 158: Employers' Accounting for Defined Benefit Pension and other Postretirement Plans. "Pension Plan Funding and Stock Market Efficiency," Journal of Finance, 61(2), 921-956. "Creating Value in Pension Plans (Or, Gentlemen Prefer Bonds)," Journal of Applied Corporate Finance, 15(4), 51-57. High-Risk Series: An Update. "Stock Options for Undiversified Executives," Journal of Accounting and Economics, 33(1), 3-42. "Millard Says PBGC Needs Premiums Based on Risk," Pensions and Investments, January 26. "PBGC Fights Ruling on Termination Fee," Pensions and Investments, January 30. "Optimal Funding and Asset Allocation Rules for Defined Benefit Pension Plans," in Financial Aspects of the U.S. Pension System, pp. 92-106. University of Chicago Press. "Firm-Specific Human Capital as a Shared Investment," The American Economic Review, 71(3), 475-482. "The Economic Function of Underfunded Pension Liabilities," Journal of Law and Economics, 28(3), 611-51. "The Labor Contract and True Economic Pension Liabilities," American Economic Review, 75(5), 1031-43. Option Pricing. Richard D. Irwin, Inc. "Why Do Firms Offer Risky Defined-Benefit Pension Plans?," National Tax Journal, 60(3), 507-520. "Valuing and Hedging Defined Benefit Pension Obligations--The Role of Stocks Revisited," Working Paper, Northwestern University. "The Equity Premium: ABCs," in Handbook of the Equity Risk Premium, ed. by R. Mehra, and "The Structure of Wages and Investment in General Training," The Journal of Political Economy, 107(3), 539-572. "The Case agaist Stock in Corporate Pension Funds," Pension Section News (Society of Actuaries), pp. 17-19. "Pension Deficits: An Unnecessary Evil," Financial Analysts Journal, 60(3), 22-32. "Investment in Human Capital: A Theoretical Analysis," The Journal of Political Economy, 70(5), 9-49. "The Tax Consequences of Long-Run Pension Policy," Financial Analysts Journal, 36, 21-29. Flow of Funds Accounts of the United States. "Pension Fund Investment Policy," NBER Working Paper No. 2752. "The ABO, the PBO, and Pension Investment Policy," Financial Analysts Journal, 41, 10-16. "Guaranteed Trouble: The Economic Effects of the Pension Benefit Guaranty Corporation," Journal of Economic Perspectives, 22(1), 177-198. "What Are Corporate Pension Liabilities?," Quarterly Journal of Economics, 97, 435-452. "Funding Plummets for GM's U.S. Plans," Pensions and Investments, February 18. "Executive Stock and Option Valuation in a Two State-Variable Framework," Journal of Derivatives, 12, 9-27. The Risk Exposure of the Pension Benefit Guarantee Corporation. Washington. "Footnotes Aren't Enough: The Impact of Pension Accounting on Stock Values," Journal of Pension Economics and Finance, 7(3), 257-276. "Did Pension Plan Accounting Contribute to a Stock Market Bubble?," Brookings Papers on Economic Activity, 1, 323-359. Private Pension Plan Bulletin: Abstract of 2006 Form 5500 Annual Reports. U.S. Dept. of Labor. Statement of Financial Accounting Standards No. 158: Employers' Accounting for Defined Benefit Pension and other Postretirement Plans. "Pension Plan Funding and Stock Market Efficiency," Journal of Finance, 61(2), 921-956. "Creating Value in Pension Plans (Or, Gentlemen Prefer Bonds)," Journal of Applied Corporate Finance, 15(4), 51-57. High-Risk Series: An Update. "Stock Options for Undiversified Executives," Journal of Accounting and Economics, 33(1), 3-42. "Millard Says PBGC Needs Premiums Based on Risk," Pensions and Investments, January 26. "PBGC Fights Ruling on Termination Fee," Pensions and Investments, January 30. "Optimal Funding and Asset Allocation Rules for Defined Benefit Pension Plans," in Financial Aspects of the U.S. Pension System, pp. 92-106. University of Chicago Press. "Firm-Specific Human Capital as a Shared Investment," The American Economic Review, 71(3), 475-482. "The Economic Function of Underfunded Pension Liabilities," Journal of Law and Economics, 28(3), 611-51. "The Labor Contract and True Economic Pension Liabilities," American Economic Review, 75(5), 1031-43. Option Pricing. Richard D. Irwin, Inc. "Why Do Firms Offer Risky Defined-Benefit Pension Plans?," National Tax Journal, 60(3), 507-520. "Valuing and Hedging Defined Benefit Pension Obligations--The Role of Stocks Revisited," Working Paper, Northwestern University. "The Equity Premium: ABCs," in Handbook of the Equity Risk Premium, ed. by R. Mehra, E. C. Prescott. Elsevier. Milliman 2006 Pension Study. Milliman 2007 Pension Funding Study. Milliman 2008 Pension Funding Study. "The Role of Company Stock in Defined Contribution Plans," in The Pension Challenge: Risk Transfers and Retirement Income Security, ed. by O. S. Mitchell, and K. Smetters. Oxford University Press. The Economics of Private Pensions. The Brookings Institution. "The Value of Pension Benefit Guaranty Corporation Insurance," Journal of Money, Credit, and Banking, 26(3), 735-753. 2002 Annual Report. Annual Management Report: Fiscal Year 2008. "Pensions and Capital Structure: Why Hold Equities in the Pension Fund?," North American Actuarial Journal, 8, 103-113. "Pensions and Capital Structure: Why Hold Equities in the Pension Fund?," North American Actuarial Journal, 8, 103-113. "Investment and Financing Constraints: Evidence from the Funding of Corporate Pension Plans," Journal of Finance, 61(1), 33-71. "Return to OZ," Risk, 4, 63-66. "Corporate Funding Policy," Journal of Financial Economics, 3, 183-193. "Taxation and Corporate Pension Policy," Journal of Finance, 36(1), 1-13. "The Principles of Corporate Pension Finance," Journal of Finance, 32(2), 627-638. "Reforming the Defined-Benefit Pension System," Brookings Papers on Economic Activity, 1, 235-304.Tables and Figures
| 2001 | 2002 | 2003 | 2004 | 2005 | 2006 | 2007 | |
|---|---|---|---|---|---|---|---|
| 1. Agg. Funding Ratio (%) | 102.2 | 82.6 | 88.8 | 89.9 | 91.1 | 98.8 | 105.6 |
| 2.Distribution of Funding Ratios (# of Plans): <100% | 51 | 74 | 79 | 75 | 81 | 59 | 42 |
| 3.Distribution of Funding Ratios (# of Plans): <90% | 30 | 61 | 61 | 48 | 51 | 31 | 15 |
| 4.Distribution of Funding Ratios (# of Plans): <80% | 13 | 44 | 26 | 22 | 21 | 11 | 4 |
| 5. Contribs (billion $) | 10.6 | 34.3 | 56.9 | 41.9 | 44.9 | 35.6 | 27.0 |
- Ratio of the market value of assets to the projected benefit obligation. Source: Authors' calculations from Milliman Consultants and Actuaries (2006,2007) and Milliman Consultants and Actuaries (2008).
| 2005 | 2006 | 2007 | |
|---|---|---|---|
| 1. Aggregate (%) | 65 | 71 | 69 |
| 2.Distribution of Risky Asset Allocations (# of Plans): >80% | 10 | 10 | 10 |
| 3.Distribution of Risky Asset Allocations (# of Plans): 70-80% | 44 | 51 | 41 |
| 4.Distribution of Risky Asset Allocations (# of Plans): 50-70% | 35 | 35 | 44 |
| 5.Distribution of Risky Asset Allocations (# of Plans): <50% | 11 | 4 | 5 |
- Source: Authors' calculations from Milliman Consultants and Actuaries (2006,2007) and Milliman Consultants and Actuaries (2008).
- *Risky Assets defined as equities plus "other investments.".
| CRRA |
CRRA |
CRRA |
CRRA |
CRRA |
CRRA |
|
|---|---|---|---|---|---|---|
| Allocation |
99 | 100 | 90 | 99 | 100 | |
| 0.00 | -19.01 | -1.29 | 0.00 | -33.18 | -2.21 | 0.00 |
| 0.01 | -19.04 | -1.31 | -0.08 | -33.22 | -2.24 | -0.14 |
| 0.50 | -25.35 | -8.08 | -6.87 | -43.93 | -13.86 | -11.80 |
| 1.00 | -40.43 | -21.36 | -19.79 | -71.24 | -37.36 | -34.60 |
| CRRA |
CRRA |
CRRA |
CRRA |
CRRA |
CRRA |
|
|---|---|---|---|---|---|---|
| Allocation |
99 | 100 | 90 | 99 | 100 | |
| 0.00 | -20.99 | -1.37 | 0.00 | -36.33 | -2.37 | 0.00 |
| 0.01 | -21.39 | -1.57 | -0.19 | -37.02 | -2.72 | -0.34 |
| 0.50 | -49.09 | -20.72 | -18.35 | -85.16 | -35.99 | -31.93 |
| 1.00 | -95.68 | -60.35 | -57.08 | -167.51 | -105.46 | -99.76 |
| CRRA |
CRRA |
CRRA |
CRRA |
CRRA |
CRRA |
|
|---|---|---|---|---|---|---|
| Allocation |
99 | 100 | 90 | 99 | 100 | |
| 0.00 | -13.09 | -0.89 | 0.00 | -23.28 | -1.55 | 0.00 |
| 0.01 | -12.85 | -0.77 | -0.01 | -22.81 | -1.31 | -0.02 |
| 0.50 | -6.54 | -1.01 | -0.77 | -11.11 | -1.68 | -1.28 |
| 1.00 | -6.64 | -2.22 | -1.95 | -11.41 | -3.77 | -3.30 |
- *This table reports net values for different combinations of relative risk aversion,
 , and correlations between the market portfolio and the firm's assets,
  . The net value is defined as the value of the firm's benefit from offering a pension less the compensation premium to the worker.
  % is the percent of the first-period contribution relative to "full funding":
 . The other parameters are as follows:
 2,500;
 ;
;
 ;
;
 ;
;  ;
;
 1,000;
  ; and
; and  . The parameters imply a 5% probability of bankruptcy at the point of full funding.
Appendix: Valuation of Options with Correlated Returns
This appendix provides a brief description of Rubinstein's (1994) method for approximating a correlated return process as a bivariate binomial distribution and explains how we adapt it to account for the possibility of bankruptcy. Letting h denote the length of each time interval we consider and ![]() denote the total number of time periods, there are
denote the total number of time periods, there are ![]() unique values of the firm return and the market return, where
unique values of the firm return and the market return, where ![]() . Since we are pricing
European, and not American, options, we only need to keep track of the terminal values of the options at the end of the
. Since we are pricing
European, and not American, options, we only need to keep track of the terminal values of the options at the end of the ![]() periods. We construct the
periods. We construct the ![]() values of our return variables by first considering the terminal realizations of a pair of standard binomial random variables,
values of our return variables by first considering the terminal realizations of a pair of standard binomial random variables, ![]() and
and ![]() . To allow for correlation, we can define
. To allow for correlation, we can define ![]() and
and
![]() , which are themselves binomial random variables. For
, which are themselves binomial random variables. For ![]() and
and ![]() moves, each pair of standardized realizations,
moves, each pair of standardized realizations,
![]() , is given by:
, is given by:
| (1) | |||
| (2) |
with associated probabilities given by the binomial pdf.44 We adopt the Jarrow-Rudd Jarrow and Rudd (1983) binomial approximation of the returns, where an "up" movement equals
| (3) |
for the risk-neutral return on the market portfolio, and
| (4) |
for the risk-neutral return on the firm's assets. (Note that since the market return values depend only on the realization of
| (5) |
Similarly, the risk-neutral payoff of the conditional put option on the pension surplus is given by
![\displaystyle q^p(F,b\mid s=1)=\frac{1}{R}\sum_{j=0}^{n}(1-bp(j))\max(b-[R+(R_m(j)-R)\lambda]F_1,0),](img143.gif) |
(6) |
where the payoffs are each multiplied by the probabilities of survival,
 , obtained under the risk-neutral distribution.