
Capital Taxation with Entrepreneurial Risk
Keywords: Capital-income taxation, uninsurable idiosyncratic investment risk, general equilibrium, heterogeneous agents
Abstract:
This paper studies the effects of capital taxation in a dynamic heterogeneous-agent economy with uninsurable entrepreneurial risk. Although it allows for rich general-equilibrium effects and a stationary distribution of wealth, the model is highly tractable. This permits a clear analysis, not only of the steady state, but also of the entire transitional dynamics following any change in tax policies. Unlike either the complete-markets paradigm or Bewley-type models where idiosyncratic risk impacts only labor income, here it is shown that capital taxation may actually stimulate capital accumulation. This possibility emerges because of the general-equilibrium effects of the insurance aspect of capital taxation. In particular, for the preferred calibrated version of the model, when the tax on capital is 25 percent, output per work-hour is 2.2 percent higher than it would have been had the tax rate been zero. Turning to the welfare effects of a reform in capital taxation, it is examined how these effects depend on whether one focuses on the steady state or also takes into account transitional dynamics, as well as how they vary in the cross-section of the population (rich versus poor, entrepreneurs versus non-entrepreneurs).
1 Introduction
This paper studies the macroeconomic and welfare effects of capital-income taxation in an environment where agents face uninsurable idiosyncratic investment risk. Such risk is empirically important for entrepreneurs and wealthy agents, who, even though they represent a small fraction of the population, hold most of an economy's wealth. In this context, capital taxation raises an interesting tradeoff between the distortion of investment versus the provision of insurance against idiosyncratic capital-income risk. On the one hand, capital taxation comes at a cost, since it distorts agents' saving decisions. On the other hand, it has benefits, since it provides agents with partial insurance against idiosyncratic investment risk. This suggests that a positive tax on capital income could be welfare-improving, even if it reduced capital accumulation.
Most surprisingly though, it is shown that a positive tax on capital income may actually stimulate capital accumulation. Indeed, the steady-state levels of the capital stock, output and employment may all be maximized at a positive value of the capital-income tax. This possibility emerges because of the general-equilibrium effects of the insurance aspect of capital taxation. This result stands in stark contrast to the effect of capital taxation both under complete-markets models, and under incomplete-markets models with uninsurable labor-income risk alone. In these models, capital-income taxation, irrespectively of whether it is welfare-improving or not, necessarily discourages capital accumulation.
Model. This paper represents a first attempt to study the effects of capital-income taxation in a general-equilibrium incomplete-markets economy, where agents are exposed to uninsurable idiosyncratic investment risk. The framework builds on Angeletos (2007), who develops a variant of the neoclassical growth model that allows for idiosyncratic investment risk, and studies the effects of such risk on macroeconomic aggregates. Agents own privately held businesses that operate under constant returns to scale. Agents are not exposed to labor-income risk, and they can freely borrow and lend in a riskless bond, but they cannot diversify the idiosyncratic risk in their private business investments. Abstracting from labor-income risk, borrowing constraints, and other market frictions, isolates the impact of the idiosyncratic investment risk and preserves the tractability of the general-equilibrium dynamics. The present model extends Angeletos's model in the following ways. First, a government is introduced, imposing proportional taxes on capital and labor income, along with a non-contingent lump-sum tax or transfer. Second, agents have finite lives, which ensures the existence of a stationary wealth distribution. Third, there is stochastic, though exogenous, transition in and out of entrepreneurship, which helps capture the observed heterogeneity between entrepreneurs and non-entrepreneurs without the complexity of endogenizing occupational choice. Fourth, labor supply is endogenous. Clearly the first element is essential for the novel contribution of the paper. The other three improve the quantitative performance of the model and demonstrate the robustness of the main result.
Preview of results. The main result of the paper is that an increase in capital-income taxation may actually stimulate capital accumulation. The intuition behind this result comes from recognizing that the overall effect of the capital-income tax on capital accumulation can be decomposed in two parts. The first part captures the response of capital to the tax in a setting with endogenous saving but exogenously fixed interest rate. This is isomorphic to examining the effects of the capital tax in a "small open economy". In this context, it is shown that an increase in the capital-income tax unambiguously decreases the steady-state capital stock. The second part, which is the core result of this paper, captures the importance of the general-equilibrium adjustment of the interest rate for wealth and capital accumulation. Here, an increase in the tax reduces the effective variance of the risk agents are exposed to. This reduces the demand for precautionary saving, and therefore increases the interest rate, which in turn increases steady-state wealth. With decreasing absolute risk aversion, wealthier agents are willing to undertake more risk, and hence they will increase their investment in capital. In other words, the general-equilibrium effect of the interest rate adjustment is a force that tends to increase investment and the steady-state capital stock.
For plausible parameterizations of the closed economy, the general equilibrium effect dominates for low levels of the capital-income tax, so that steady-state capital at first increases with the tax. In particular, for the preferred calibrated version of the model, the steady-state capital stock
is maximized when the tax on capital is ![]() . So, for example, when the tax on capital is
. So, for example, when the tax on capital is ![]() , output per work-hour is
, output per work-hour is ![]() higher than what it would have been had the tax rate been zero. The result that the steady-state capital stock is inversely U-shaped with
respect to the capital-income tax is robust for a wide range of empirically plausible parameter values. Furthermore, the tax that maximizes steady-state capital is increasing in risk aversion and/or the volatility of idiosyncratic risk. This finding reinforces the insurance interpretation of the
tax system.
higher than what it would have been had the tax rate been zero. The result that the steady-state capital stock is inversely U-shaped with
respect to the capital-income tax is robust for a wide range of empirically plausible parameter values. Furthermore, the tax that maximizes steady-state capital is increasing in risk aversion and/or the volatility of idiosyncratic risk. This finding reinforces the insurance interpretation of the
tax system.
Subsequently, the paper examines the aggregate and welfare effects of eliminating the capital-income tax. This is because an extensive discussion has been conducted within the context of the complete-markets neoclassical growth model about the welfare benefits of setting the capital-income tax to zero. In light of the main result here, revisiting this discussion is worthwhile. In particular, the aggregate and welfare effects are presented from two different perspectives. On the one hand, one might be interested in examining the welfare of the current generation immediately after the policy reform, taking into account the entire transitional dynamics of the economy towards the new steady state with the zero tax. On the other hand, one might be interested in examining the welfare of the generations that will be alive in the distant future, i.e. at the new steady state with the zero tax.
First, consider the macroeconomic effects of eliminating the capital-income tax. When markets are complete, investment increases in the short run, and it is also higher at the new long-run steady state with the zero tax, compared to the old steady state with the positive tax. By contrast, in the present model of incomplete markets, investment falls in the short run, as well as in the long run.
Second, consider the welfare effects of eliminating the capital-income tax. These vary across the different types of agents, the different levels of wealth, and the current versus the future generations. In the current generation, poor agents, whether entrepreneurs or non-entrepreneurs, prefer the zero tax. This is because most of their wealth comes from wage income, and, with capital fixed, the present value of wages increases due to a fall in the interest rate. Rich agents, on the other hand, prefer a positive tax, since they benefit more from insurance provision.
In the long run, all types of agents, and at all levels of wealth, prefer a positive tax on capital income. However, the cost of switching to a zero-tax regime is much higher for poorer than for wealthier agents of all types. This is because, in the long run, the elimination of the tax decreases the steady-state capital stock, thereby decreasing the present value of wages. Therefore poorer agents will suffer the most, since human wealth constitutes a big part of their total wealth.
Literature review. This paper focuses on entrepreneurial risk, because such risk is in fact empirically relevant, even in a financially developed country like the United States. For example, Moskowitz and Vissing-Jørgensen (2002) find that ![]() of all private equity is owned by agents for whom such investment constitutes at least half of their total net worth. Furthermore,
of all private equity is owned by agents for whom such investment constitutes at least half of their total net worth. Furthermore, ![]() of private equity is held by owners who are actively involved in the management of their own firm.1 Given this
evidence about the US, one expects that entrepreneurial risk must be even more prevalent in less developed economies, where a large part of production takes place in small unincorporated businesses and where risk-sharing arrangements are much more limited.
of private equity is held by owners who are actively involved in the management of their own firm.1 Given this
evidence about the US, one expects that entrepreneurial risk must be even more prevalent in less developed economies, where a large part of production takes place in small unincorporated businesses and where risk-sharing arrangements are much more limited.
Furthermore, idiosyncratic investment risk need not be interpreted as affecting solely the owners of privately held businesses. In recent work, Panousi and Papanikolaou (2008) find a significant and robust negative relationship between idiosyncratic risk and the investment of publicly traded firms in the US. In addition, they show that this relationship is stronger in firms where the insider mangers hold a larger fraction of the firm's shares, and they provide evidence for a possible explanation that has to do with managerial risk aversion. Combined with the work of Moskowitz and Vissing-Jørgensen (2002), this demonstrates that a large fraction of total investment in the US, whether by publicly traded or privately held businesses, is sensitive to idiosyncratic risk, and therefore strengthens the empirical applicability of the present model setup.
This paper relates to the strand of the macroeconomic literature discussing optimal taxation and the effects of taxation. However, most of this literature has focused on labor income risk. Chamley (1986) and Judd (1985) first established the result of zero optimal capital taxation in the long run when markets are complete. Atkeson, Chari and Kehoe (1999) generalized this result to most of the short run for an interesting class of preferences, and to the case of finitely lived agents. Aiyagari (1995) extended the complete-markets framework to include uninsurable labor income risk and borrowing constraints. In this context, when only a limited set of policy instruments are available, it becomes optimal to tax capital in the long run: a positive capital tax increases welfare, but it unambiguously lowers the level of the capital stock.2
A related but different normative exercise is conducted by Davila et al. (2007). They examine constrained efficiency, in the spirit of Geanakoplos-Polemarchakis, within a version of Aiyagari's model. This exercise does not allow for risk-sharing through taxes or any other instruments, and instead considers an efficiency concept where the planner directly dictates to the agents how much to invest and to trade. Angeletos and Werning (2006) examine a similar constrained efficiency problem in a two-period version of a model with idiosyncratic investment risk. Albanesi (2006) considers optimal taxation in a two-period model of entrepreneurial activity, in a constrained efficiency setting, and following the Mirrlees optimal policy tradition. The benefit of her approach is that the source of incomplete risk-sharing is endogenously specified as the result of a private information (moral hazard) problem, and that there are no ad hoc restrictions placed on the tax instruments. However, her model does not allow for dynamics, for long-run considerations, or for general-equilibrium effects like those studied in the present paper. In general, the extensive theoretical work on taxation originating from the Mirrlees and the new dynamic public finance tradition focuses on labor-income risk, as does the literature that examines the optimal progressivity of the tax code.3
The growing literature on the effects of borrowing constraints on entrepreneurial choices has examined policy questions, and especially the implications of replacing a progressive with a proportional income-tax schedule, in an Aiyagari-type environment, i.e. with decreasing returns to scale at the individual level, borrowing constraints, and undiversifiable labor income risk. Some examples in this area include Li (2002), Domeij and Heathcote (2003), Meh (2005), Cagetti and DeNardi (2007), and Kitao (2007). Benabou (2002) develops a tractable dynamic general-equilibrium model of human capital accumulation with endogenous effort and missing credit and insurance markets. Within this framework he examines the long-run tradeoffs of progressive taxation and education finance. Finally, Erosa and Koreshkova (2007) examine the long-run effects of switching from progressive to proportional income taxation in a quantitative dynastic model of human capital.
This paper also relates to the branch of the public finance literature that considers the effects of capital taxation on portfolio allocation and risk-taking. Domar and Musgrave (1944) first proposed the idea that proportional income taxation may increase risk-taking, by having the government bear part of the risk facing the agents.4 This idea was formalized by Stiglitz (1969), within a two-period single-agent model, where asset returns and the level of saving are exogenously given, but where the agent optimally chooses the allocation of his fixed amount of saving between a risky and a riskless asset. Ahsan (1974) extended Stiglitz by endogenizing the intertemporal consumption-saving decision in a two-period model. He showed that the partial-equilibrium effect of capital-income taxation on risk-taking is in general ambiguous. By contrast, in the "small open economy" version of the present model, which differs from Ahsan's in that the horizon is infinite and the return to capital is endogenous, it is shown that the steady-state capital stock is decreasing in the capital-income tax. This finding highlights that the results here are driven by, novel to the literature, general-equilibrium effects.
As already mentioned, the present model builds on Angeletos (2007), who abstracted from policy questions and considered instead the effect of investment risk on macroeconomic aggregates. The contribution of the present paper is to study the effects of capital-income taxation on aggregates and welfare. Angeletos and Panousi (2009), in a framework like the one in Angeletos (2007), examine the effects of government spending on macroeconomic aggregates, but for the case where government spending is financed exclusively through lump-sum taxation.
The rest of the paper is organized as follows. Section 2 presents the model. Section 3 describes individual behavior and the aggregate equilibrium dynamics. Section 4 characterizes the steady state in terms of aggregates and distributions. Section ![]() presents and discusses the main theoretical result. Section 6 presents the calibration
methodology and the parameter choices, along with the implications of the preferred calibrated model for aggregates and distributions. Section 7 quantifies the steady-state effects of capital
taxation, as well as the short-run and long-run effects of eliminating the capital-income tax. Section 8 examines the robustness of the results to the availability of a safe asset in positive
net supply. Section 9 concludes. All proofs are delegated to the appendix.
presents and discusses the main theoretical result. Section 6 presents the calibration
methodology and the parameter choices, along with the implications of the preferred calibrated model for aggregates and distributions. Section 7 quantifies the steady-state effects of capital
taxation, as well as the short-run and long-run effects of eliminating the capital-income tax. Section 8 examines the robustness of the results to the availability of a safe asset in positive
net supply. Section 9 concludes. All proofs are delegated to the appendix.
2 The Model
Time is continuous and indexed by
![]() . There is a continuum of agents distributed uniformly over
. There is a continuum of agents distributed uniformly over ![]() .
At each point in time an agent can be either an entrepreneur, denoted by
.
At each point in time an agent can be either an entrepreneur, denoted by ![]() , or a laborer, denoted by
, or a laborer, denoted by ![]() . The probabilities of switching between these two types are exogenous. In particular, the probability that an agent will switch from being an entrepreneur to being a laborer is
. The probabilities of switching between these two types are exogenous. In particular, the probability that an agent will switch from being an entrepreneur to being a laborer is
![]() , and the probability that he will switch from being a laborer to being an entrepreneur is
, and the probability that he will switch from being a laborer to being an entrepreneur is
![]() . The measure of entrepreneurs in the economy at time
. The measure of entrepreneurs in the economy at time ![]() is denoted by
is denoted by
![]() .
.
In what follows, and for expositional simplicity, labor is taken to be exogenous. All of the proofs, which are delegated to the appendix, and all of the calibrations, will consider the general case of endogenous labor, where preferences are homothetic between consumption and leisure, i.e. they are of the King-Plosser-Rebelo (1988) specification.
2.1 Preferences
All agents are endowed with one unit of time. Preferences are Epstein-Zin over consumption, ![]() , and they are defined as the limit, for
, and they are defined as the limit, for
![]() , of 5:
, of 5:
| (1) |
where
2.2 Entrepreneurs
When an agent is an entrepreneur, he owns and runs a firm operating a constant-returns-to-scale neoclassical production function ![]() , where
, where ![]() is capital input and
is capital input and ![]() is labor input. An entrepreneur can only invest in his own firm's capital, although he supplies and
employs labor in the competitive labor market. Capital investment in his firm is subject to uninsurable risk. The idiosyncratic shocks are i.i.d., hence there is no aggregate uncertainty. An entrepreneur can also save in a riskless bond.
is labor input. An entrepreneur can only invest in his own firm's capital, although he supplies and
employs labor in the competitive labor market. Capital investment in his firm is subject to uninsurable risk. The idiosyncratic shocks are i.i.d., hence there is no aggregate uncertainty. An entrepreneur can also save in a riskless bond.
The financial wealth of an entrepreneur ![]() , denoted by
, denoted by ![]() , is the sum of
his holdings in private capital,
, is the sum of
his holdings in private capital, ![]() , and the riskless bond,
, and the riskless bond, ![]() :
:
The evolution of
where
Firm profits are given by:
where
2.3 Laborers
When an agent is a laborer, he cannot invest in capital, and he can only hold the riskless bond. He also supplies labor in the competitive labor market. Financial wealth for a laborer ![]() is
therefore:
is
therefore:
and its evolution is given by:
2.4 Government
At each point in time the government taxes capital and bond income at the rate
![]() , and labor income at the rate
, and labor income at the rate
![]() . Part of the tax proceeds is used by the government for own consumption at the deterministic rate
. Part of the tax proceeds is used by the government for own consumption at the deterministic rate ![]() . Government spending does not affect the utility from private consumption or the production technology. The remaining tax proceeds are then distributed back to the households in the form of non-contingent lump-sum transfers,
. Government spending does not affect the utility from private consumption or the production technology. The remaining tax proceeds are then distributed back to the households in the form of non-contingent lump-sum transfers, ![]() . The government budget constraint is therefore:
. The government budget constraint is therefore:
where
2.5 Finite lives and annuities
All households face a constant probability of death, with Poisson arrival rate ![]() at every instant in time.7 There is no intergenerational altruism linking a household to its descendants, and utility is zero after death. The discount rate in preferences can then be reinterpreted as
at every instant in time.7 There is no intergenerational altruism linking a household to its descendants, and utility is zero after death. The discount rate in preferences can then be reinterpreted as
![]() , where
, where
![]() is the psychological or subjective discount rate and
is the psychological or subjective discount rate and ![]() is the
probability of death8.
is the
probability of death8.
In order to isolate the effects of capital-income risk, it is assumed that there exist annuity firms permitting all agents to get insurance against mortality risk, by freely borrowing the entire net present value of their future labor income. As a result, all agents have (safe) human wealth,
denoted by ![]() , and defined as the present discounted value of their net-of-taxes labor endowment plus government transfers:9
, and defined as the present discounted value of their net-of-taxes labor endowment plus government transfers:9
Then, the total effective wealth, ![]() , for an agent is defined as the sum of his financial and human wealth, i.e.
, for an agent is defined as the sum of his financial and human wealth, i.e.
![]() . Hence, effective wealth for an entrepreneur is given by:
. Hence, effective wealth for an entrepreneur is given by:
and effective wealth for a laborer is given by:10
3 Equilibrium
This section characterizes individual behavior and the general equilibrium in the economy. The analysis will be in closed-form, since, as will be shown, the wealth distribution is not a relevant state variable for the characterization of aggregate equilibrium dynamics.
3.1 Individual Behavior
Entrepreneurs choose employment after their capital stock has been installed and their idiosyncratic shock has been observed. Hence, since their production function, ![]() , exhibits constant
returns to scale, optimal firm employment and optimal profits are linear in own capital:
, exhibits constant
returns to scale, optimal firm employment and optimal profits are linear in own capital:
| (11) |
where
The evolution of effective wealth for an entrepreneur is described by:
The first term captures the expected rate of growth of effective wealth, and it shows that wealth grows when the total return to saving for an entrepreneur exceeds consumption expenditures. The second term captures the impact of idiosyncratic risk. The evolution of effective wealth for a laborer is described by:
Let the fraction of effective wealth an agent saves in the risky asset be:

Let an agent's marginal propensity to consume out of effective wealth be:
 |
(15) |
Let
Because of the linearity in assets of the budget constraints
![]() and
and
![]() , and the homotheticity of the preferences, the optimal individual policy rules will be linear in total effective wealth, for given prices and
government policies. Hence, for given prices and policies, an agent's consumption-saving problem reduces to a tractable homothetic problem as in Samuelson's and Merton's classic portfolio analysis. Optimal individual behavior is then characterized by the following proposition.
, and the homotheticity of the preferences, the optimal individual policy rules will be linear in total effective wealth, for given prices and
government policies. Hence, for given prices and policies, an agent's consumption-saving problem reduces to a tractable homothetic problem as in Samuelson's and Merton's classic portfolio analysis. Optimal individual behavior is then characterized by the following proposition.

If an agent
The marginal propensities to consume satisfy the following system of ordinary differential equations:
![\displaystyle \frac{\dot{m_{t}}^{E}}{m^{E}_t}=m^{E}_t-\theta \beta +(\theta -1)\,\hat{\rho_t}+\frac{\theta -1}{1-\gamma } p_{EL} [ (\frac{m^{L}}{m^{E}})^{\frac{1-\gamma}{1-\theta}}-1 ]](img102.gif)
![\displaystyle \frac{\dot{m_{t}}^{L}}{m^{L}_t}=m^{L}_t-\theta \beta +(\theta -1)(1-\tau^K_t)\,R_t+\frac{\theta -1}{1-\gamma} p_{LE} [ (\frac{m^{E}}{m^{L}})^{\frac{1-\gamma}{1-\theta}}-1 ]\,.](img103.gif)
From
![]() and
and
![]() it is clear that optimal consumption is a linear function of total effective wealth, where the marginal propensity to consume depends only on
the type of the agent, and not on the level of wealth. In other words, all entrepreneurs share a common marginal propensity to consume,
it is clear that optimal consumption is a linear function of total effective wealth, where the marginal propensity to consume depends only on
the type of the agent, and not on the level of wealth. In other words, all entrepreneurs share a common marginal propensity to consume, ![]() , and all laborers share a common marginal
propensity to consume,
, and all laborers share a common marginal
propensity to consume, ![]() . The fraction
. The fraction ![]() of wealth invested in the risky
asset by an agent who happens to be an entrepreneur is increasing in the risk premium, decreasing in risk aversion, and decreasing in the effective variance of risk,
of wealth invested in the risky
asset by an agent who happens to be an entrepreneur is increasing in the risk premium, decreasing in risk aversion, and decreasing in the effective variance of risk,
![]() . Because of homotheticity and linearity,
. Because of homotheticity and linearity, ![]() is the same
across all entrepreneurs, and independent of the level of wealth. The policy for optimal bond holdings follows from
is the same
across all entrepreneurs, and independent of the level of wealth. The policy for optimal bond holdings follows from
![]() or
or
![]() , and
, and
![]() . The system of
. The system of
![]() and
and
![]() is a system of two Euler equations. It shows that the marginal propensities to consume, conditional on being an entrepreneur or a laborer, depend
on two factors. First, on the process of the corresponding net-of-tax anticipated (risk-adjusted) returns to saving, in accordance with whether the elasticity of intertemporal substitution,
is a system of two Euler equations. It shows that the marginal propensities to consume, conditional on being an entrepreneur or a laborer, depend
on two factors. First, on the process of the corresponding net-of-tax anticipated (risk-adjusted) returns to saving, in accordance with whether the elasticity of intertemporal substitution, ![]() , is higher or lower than 1. Second, on the probability that the agent might switch between being an entrepreneur and being a laborer.
, is higher or lower than 1. Second, on the probability that the agent might switch between being an entrepreneur and being a laborer.
3.2 General equilibrium
The initial position of the economy is given by the distribution of
![]() across households. An equilibrium is a deterministic sequence of prices
across households. An equilibrium is a deterministic sequence of prices
![]() , a deterministic sequence of policies
, a deterministic sequence of policies
![]() , a deterministic macroeconomic path
, a deterministic macroeconomic path
![]() , and a collection of individual contingent plans
, and a collection of individual contingent plans
![]() for
for
![]() , such that the following conditions hold: (i) given the sequences of prices and policies, the plans are optimal for the households; (ii) the labor market clears,
, such that the following conditions hold: (i) given the sequences of prices and policies, the plans are optimal for the households; (ii) the labor market clears,
![]() , in all
, in all ![]() ; (iii) the bond market clears,
; (iii) the bond market clears,
![]() , in all
, in all ![]() ; (iv) the government budget constraint
; (iv) the government budget constraint
![]() is satisfied in all
is satisfied in all ![]() ; and (v) the
aggregates are consistent with individual behavior,
; and (v) the
aggregates are consistent with individual behavior,
![]() ,
,
![]() ,
,
![]() ,
,
![]() ,
,
![]() ,
,
![]() , and
, and
![]() , in all
, in all ![]() .
.
Because individual consumption and investment are linear in individual wealth, aggregates at any point in time do not depend on the extend of wealth inequality at that time. Therefore here, in contrast to other incomplete-markets models, it is not the case that the entire wealth distribution is a relevant state variable for aggregate dynamics. In fact, for the determination of aggregate dynamics, it suffices to keep track of the mean of aggregate wealth, and of the allocation of total wealth between the two groups of agents. To that end, let the fraction of total effective wealth held by entrepreneurs in the economy be:

The aggregate equilibrium dynamics can then be described by the following recursive system.
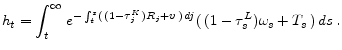
Equation
![]() shows that the evolution of total effective wealth is a weighted average of two terms. The first term is positive when the mean net-of-tax return
to saving for entrepreneurs exceeds their marginal propensity to consume, and is weighted by the fraction of total wealth the entrepreneurs hold in the economy. The second term is positive when the net-of-tax return to saving for laborers exceeds their marginal propensity to consume, and is
weighted by the fraction of total wealth the laborers hold in the economy. Equation
shows that the evolution of total effective wealth is a weighted average of two terms. The first term is positive when the mean net-of-tax return
to saving for entrepreneurs exceeds their marginal propensity to consume, and is weighted by the fraction of total wealth the entrepreneurs hold in the economy. The second term is positive when the net-of-tax return to saving for laborers exceeds their marginal propensity to consume, and is
weighted by the fraction of total wealth the laborers hold in the economy. Equation
![]() shows the endogenous evolution of the relative distribution of wealth between the two groups of agents. The evolution of
shows the endogenous evolution of the relative distribution of wealth between the two groups of agents. The evolution of ![]() depends on three factors. First, on the differential excess return the entrepreneurs face on their saving, which is given by
depends on three factors. First, on the differential excess return the entrepreneurs face on their saving, which is given by
![]() , where
, where ![]() is the fraction of wealth invested in the risky asset,
and
is the fraction of wealth invested in the risky asset,
and ![]() is the risk premium. Second, on the difference in the level of saving between entrepreneurs and laborers, as captured by the difference in the marginal propensities to consume,
is the risk premium. Second, on the difference in the level of saving between entrepreneurs and laborers, as captured by the difference in the marginal propensities to consume,
![]() . Third, on the adjustment made for the transition probabilities. Note here that the evolution of consumption can be recovered by aggregating across individual optimal policies,
so that
. Third, on the adjustment made for the transition probabilities. Note here that the evolution of consumption can be recovered by aggregating across individual optimal policies,
so that
![]() and
and
![]() , and using
, and using
![]() ,
,
![]() ,
,
![]() , and
, and
![]() . Equation
. Equation
![]() shows the evolution of total human wealth, using the government budget constraint
shows the evolution of total human wealth, using the government budget constraint
![]() , where
, where ![]() is the marginal product of capital in the aggregate production function
is the marginal product of capital in the aggregate production function ![]() , and where
, and where
![]() from market clearing. Since
from market clearing. Since
![]() , the resource constraint of the economy is also satisfied. Equation
, the resource constraint of the economy is also satisfied. Equation
![]() is the bond market clearing condition. It comes from aggregating across individual capital and bond choices as given in
is the bond market clearing condition. It comes from aggregating across individual capital and bond choices as given in
![]() and
and
![]() , adding up, using
, adding up, using
![]() , and using
, and using
![]() . From
. From
![]() it follows that, for given prices and human wealth, a decrease in
it follows that, for given prices and human wealth, a decrease in ![]() decreases
decreases ![]() . A fall in
. A fall in ![]() indicates
that the entrepreneurs on average now borrow more from the laborers, hence their wealth will on average be lower. With decreasing absolute risk aversion, this will negatively affect their willingness to take risk, and therefore investment and the capital stock will fall for given prices.
indicates
that the entrepreneurs on average now borrow more from the laborers, hence their wealth will on average be lower. With decreasing absolute risk aversion, this will negatively affect their willingness to take risk, and therefore investment and the capital stock will fall for given prices.
3.3 Steady state: characterization of aggregates
A steady state is a competitive equilibrium as defined in section
![]() , where prices, policies, and aggregates are time-invariant. For expositional purposes, and to illustrate that the results about the effects of
capital-income taxation on the aggregates are not due to the presence of two types of agents or to the probability of death, section
, where prices, policies, and aggregates are time-invariant. For expositional purposes, and to illustrate that the results about the effects of
capital-income taxation on the aggregates are not due to the presence of two types of agents or to the probability of death, section
![]() (as well as section
(as well as section
![]() later on) will consider the case with
later on) will consider the case with ![]() and
and ![]() 11. However,
section
11. However,
section
![]() will characterize the invariant distributions for the general case.
will characterize the invariant distributions for the general case.
The steady state is the fixed point of the dynamic system in Proposition
![]() . Let government spending,
. Let government spending, ![]() , be
parameterized as a fraction
, be
parameterized as a fraction ![]() of tax revenue. The following proposition characterizes the steady state.
of tax revenue. The following proposition characterizes the steady state.
where
From
![]() or
or
![]() and
and
![]() in steady state, and using the fact that
in steady state, and using the fact that
![]() , we get equation
, we get equation
![]() . This condition gives the combinations of
. This condition gives the combinations of ![]() and
and ![]() that are consistent with wealth and consumption stationarity. Using
that are consistent with wealth and consumption stationarity. Using
![]() and
and
![]() in steady state yields equation
in steady state yields equation
![]() . This condition gives the combinations of
. This condition gives the combinations of ![]() and
and ![]() that are consistent with stationarity of human wealth and bond market clearing.
that are consistent with stationarity of human wealth and bond market clearing.
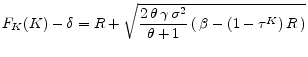
At this point it is useful to briefly compare the steady state to its complete-markets counterpart. From
![]() note that the difference from complete markets, in which case it would be
note that the difference from complete markets, in which case it would be
![]() , is the presence of the square-root term, which captures the risk premium, i.e. here
, is the presence of the square-root term, which captures the risk premium, i.e. here
![]() . In other words, agents here require a (private) risk premium in order to invest in capital. In
addition, combining
. In other words, agents here require a (private) risk premium in order to invest in capital. In
addition, combining
![]() or
or
![]() with
with
![]() , and using the fact that
, and using the fact that ![]() , we
get
, we
get
![]() , from which, in steady state, we conclude that:
, from which, in steady state, we conclude that:
| (27) |
In other words, the risk-adjusted return to saving must be just low enough to offset the precautionary saving motive,12 which is present here because agents face risk in their consumption stream. Since
3.4 Steady state: characterization of invariant distributions
At each point in time, agents die and are replaced by newborn agents, and the assumption is that the newborn agents are endowed with the wealth of the exiting agents.14 This force generates mean reversion and guarantees the existence of an invariant wealth distribution. Let
![]() denote the distance between individual and aggregate effective wealth. Let
denote the distance between individual and aggregate effective wealth. Let ![]() and
and ![]() be the conditional invariant distributions for laborers and entrepreneurs respectively. The following proposition characterizes the
invariant distributions.
be the conditional invariant distributions for laborers and entrepreneurs respectively. The following proposition characterizes the
invariant distributions.
The point to note here is that the tractability of the model allows for a very detailed characterization of the invariant distributions. This is particularly useful for the case of entrepreneurs, since it is reasonable to expect that the distribution of wealth over entrepreneurs will be, to a large extent, determined by the realization of entrepreneurial returns.15
4 Steady-State Effects of Capital Taxation
This section presents the core of the contribution of this paper, which is the study of the steady-state effects of capital-income taxation. Again, for illustration purposes, the assumption is that ![]() and
and ![]() . The main result here is that an increase in the capital-income tax may actually increase investment and the steady-state capital stock. This possibility
arises because of the general-equilibrium effects of the insurance aspect of capital taxation, which operate mainly through the endogenous adjustment of the interest rate. In order to illustrate this, the analysis will proceed by making the distinction between the case where the interest rate is
fixed, and the case where the interest rate is allowed to adjust endogenously.
. The main result here is that an increase in the capital-income tax may actually increase investment and the steady-state capital stock. This possibility
arises because of the general-equilibrium effects of the insurance aspect of capital taxation, which operate mainly through the endogenous adjustment of the interest rate. In order to illustrate this, the analysis will proceed by making the distinction between the case where the interest rate is
fixed, and the case where the interest rate is allowed to adjust endogenously.
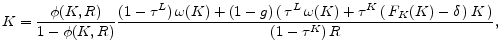
Note then that equation
![]() expresses capital,
expresses capital, ![]() , as a function
of the tax,
, as a function
of the tax, ![]() , and the interest rate,
, and the interest rate, ![]() . If the interest rate were
fixed,16 then the steady-state capital stock would be
. If the interest rate were
fixed,16 then the steady-state capital stock would be
![]() , as given by
, as given by
![]() , and where both
, and where both ![]() and
and
![]() are exogenous. Next, by plugging
are exogenous. Next, by plugging
![]() from
from
![]() into
into
![]() , we can solve for the closed-economy steady-state interest rate, as a function of the capital-income tax. Let
, we can solve for the closed-economy steady-state interest rate, as a function of the capital-income tax. Let
![]() denote the closed-economy solution for the interest rate. It follows then, that the closed-economy steady-state capital stock will be given by
denote the closed-economy solution for the interest rate. It follows then, that the closed-economy steady-state capital stock will be given by
![]() .
.
Hence, the impact of the capital-income tax on the closed economy steady-state capital stock can be decomposed in two parts. The first part describes how steady-state capital changes with the tax when the interest rate is kept constant or exogenously fixed. The second part describes the general-equilibrium adjustment of the interest rate in the closed economy, and the subsequent effects of this adjustment on capital accumulation. Thus, the total effect of the capital-income tax on the closed-economy steady-state capital stock can be decomposed as follows:
where the first term is the effect when the interest rate is fixed, and the second term is the effect when the interest rate is allowed to adjust, i.e. it is the closed-economy or general-equilibrium effect.
Let's first turn to the fixed-interest rate effect. The following corollary characterizes the effect of capital-income taxation on capital accumulation when the interest rate is held constant.
Corollary #.:
This result follows immediately from
![]() , for a given
, for a given ![]() . Hence, when the
interest rate is kept constant, capital falls with the tax, despite a direct insurance aspect of the tax that is still present, namely that the tax reduces the variance of net returns,
. Hence, when the
interest rate is kept constant, capital falls with the tax, despite a direct insurance aspect of the tax that is still present, namely that the tax reduces the variance of net returns,
![]() . Clearly then, for a given interest rate, this channel is not strong enough to outweigh the distortionary effect of capital taxation on investment. This result stands in
contrast to the findings of Ahsan (1974). Ahsan considers the simultaneous determination of the size and the composition of the optimal portfolio, in a two-period model with exogenous returns. He shows that the effect of an increase in capital-income taxation on risk-taking and capital is in
general ambiguous.17 The result here indicates that, once Ahsan's setting is extended to incorporate endogenous capital return and infinite horizon, the
ambiguity disappears and capital taxation always leads to a fall in the steady-state capital stock. It is then clear that, in addition to the direct insurance role of the tax, the endogenous adjustment of the interest rate is also required for the effect of capital taxation on capital to become
ambiguous once again.
. Clearly then, for a given interest rate, this channel is not strong enough to outweigh the distortionary effect of capital taxation on investment. This result stands in
contrast to the findings of Ahsan (1974). Ahsan considers the simultaneous determination of the size and the composition of the optimal portfolio, in a two-period model with exogenous returns. He shows that the effect of an increase in capital-income taxation on risk-taking and capital is in
general ambiguous.17 The result here indicates that, once Ahsan's setting is extended to incorporate endogenous capital return and infinite horizon, the
ambiguity disappears and capital taxation always leads to a fall in the steady-state capital stock. It is then clear that, in addition to the direct insurance role of the tax, the endogenous adjustment of the interest rate is also required for the effect of capital taxation on capital to become
ambiguous once again.
Let's now turn to the general-equilibrium effect, which captures the fact that in the closed economy the interest rate endogenously adjusts to clear the bond market, according to equation
![]() . This effect further consists of two parts.
. This effect further consists of two parts.
First, an increase in the capital-income tax reduces the effective volatility of risk for entrepreneurs,
![]() , and this is the direct insurance effect mentioned above. As a result, the interest rate, which is below the discount rate in steady state, increases, essentially because
of a reduction in the demand for precautionary saving, i.e.
, and this is the direct insurance effect mentioned above. As a result, the interest rate, which is below the discount rate in steady state, increases, essentially because
of a reduction in the demand for precautionary saving, i.e.
![]() .18 In fact,
the increase in the interest rate is so high, that the net interest rate,
.18 In fact,
the increase in the interest rate is so high, that the net interest rate,
![]() , ends up increasing, despite the increase in the capital-income tax.
, ends up increasing, despite the increase in the capital-income tax.
Second, this increase in the (net) interest rate will generate two opposing effects on saving and wealth accumulation, as can be seen from
![]() . On the one hand, an increase in the interest rate increases the opportunity cost of capital, and thus it tends to lower the steady-state capital
stock. On the other hand, an increase in the interest rate tends to increase the return to saving, and hence the steady-state wealth of entrepreneurs. With decreasing absolute risk aversion, this increases entrepreneurs' willingness to take risk, and hence it is a force that tends to increase the
steady-state capital stock. This second effect is due to the fact that here investment is sensitive to wealth, a mechanism which is absent when markets are complete. In other words, agents require a (private) risk premium in order to invest in capital, but this premium is lower at higher levels of
wealth.19 Therefore, the overall effect of an increase in
. On the one hand, an increase in the interest rate increases the opportunity cost of capital, and thus it tends to lower the steady-state capital
stock. On the other hand, an increase in the interest rate tends to increase the return to saving, and hence the steady-state wealth of entrepreneurs. With decreasing absolute risk aversion, this increases entrepreneurs' willingness to take risk, and hence it is a force that tends to increase the
steady-state capital stock. This second effect is due to the fact that here investment is sensitive to wealth, a mechanism which is absent when markets are complete. In other words, agents require a (private) risk premium in order to invest in capital, but this premium is lower at higher levels of
wealth.19 Therefore, the overall effect of an increase in ![]() on
on ![]() is ambiguous, as is summarized in the following corollary.
is ambiguous, as is summarized in the following corollary.
Corollary #.:
The proof for this corollary also follows from equation
![]() , and is left for the appendix. The intuition behind this result is a bit convoluted, so it is worth examining step-by-step. Combining equations
, and is left for the appendix. The intuition behind this result is a bit convoluted, so it is worth examining step-by-step. Combining equations
![]() or
or
![]() and
and
![]() in steady state, we get:
in steady state, we get:
where
Note first that an increase in ![]() necessarily reduces
necessarily reduces
![]() This is because an increase in
This is because an increase in ![]() reduces
reduces
![]() , and, for given
, and, for given ![]() this reduces
this reduces ![]() and
and
![]() equally, thus also reducing
equally, thus also reducing
![]() Of course, the optimal
Of course, the optimal ![]() must also fall, but
this only reinforces the negative effect on
must also fall, but
this only reinforces the negative effect on ![]() (since the portfolio is shifted towards the low-return bond), while it does not affect
(since the portfolio is shifted towards the low-return bond), while it does not affect
![]() (because of the envelope theorem and the fact that
(because of the envelope theorem and the fact that ![]() maximizes
maximizes
![]() .
.
Note next that an increase in ![]() has an ambiguous effect on
has an ambiguous effect on
![]() This is because, for given
This is because, for given ![]() both
both ![]() and
and
![]() increase with
increase with ![]() , but now the decrease in
, but now the decrease in ![]() works in the opposite direction, contributing to lower
works in the opposite direction, contributing to lower ![]() Intuitively, though, this
effect should be small if
Intuitively, though, this
effect should be small if ![]() was small to begin with. Moreover, the impact of
was small to begin with. Moreover, the impact of
![]() is likely to dominate if
is likely to dominate if ![]() is high enough. Therefore,
is high enough. Therefore,
![]() is expected to increase with
is expected to increase with ![]() if and only if either
if and only if either
![]() is low or
is low or ![]() is high.
is high.
Combining these two observations leads to the conclusion that steady-state ![]() increases with
increases with ![]() if and only if
if and only if
![]() . As shown in section
. As shown in section
![]() , this condition is more likely to be satisfied when
, this condition is more likely to be satisfied when ![]() is sufficiently high, since the steady-state risk premium is a decreasing function of
is sufficiently high, since the steady-state risk premium is a decreasing function of ![]() . Intuitively, when
. Intuitively, when ![]() is close to
is close to ![]() a marginal increase in
a marginal increase in ![]() has such a strong positive effect on steady-state wealth, that the consequent reduction in the risk premium more than offsets the increase in the opportunity cost of investment, ensuring that
has such a strong positive effect on steady-state wealth, that the consequent reduction in the risk premium more than offsets the increase in the opportunity cost of investment, ensuring that ![]() increases with
increases with ![]() .
.
The following proposition now summarizes the discussion above and the main result of this section.
In order to assess the empirical relevance of the relationship
![]() , one can use a simple back-of-the-envelope calculation that does not require any reference to the degree of market incompleteness,
, one can use a simple back-of-the-envelope calculation that does not require any reference to the degree of market incompleteness, ![]() . In particular, take labor income to be
. In particular, take labor income to be ![]() of GDP, and take the safe rate to be
of GDP, and take the safe rate to be ![]() . Then, steady-state
. Then, steady-state ![]() is about 33 times GDP, or 11 times K, if the steady-state capital-output ratio is taken to be 3. Hence,
is about 33 times GDP, or 11 times K, if the steady-state capital-output ratio is taken to be 3. Hence,
![]() , which, as section
, which, as section
![]() will discuss, is lower than most of the empirical estimates of
will discuss, is lower than most of the empirical estimates of ![]() that use micro data for the United States. Hence, in all likelihood, the condition
that use micro data for the United States. Hence, in all likelihood, the condition
![]() is satisfied in the data. At the same time, a high positive value for
is satisfied in the data. At the same time, a high positive value for
![]() is intuitive, considering the (insurance) effect of the tax on the demand for precautionary saving.
is intuitive, considering the (insurance) effect of the tax on the demand for precautionary saving.
It is therefore possible that, although
![]() , it could still be that
, it could still be that
![]() over some region, since
over some region, since
![]() is very likely positive. This means that the general-equilibrium effect of insurance on the adjustment of the
interest rate, and the subsequent effect of this adjustment on wealth accumulation, is crucial for overthrowing the negative effect of the capital-income tax on capital when the interest rate is fixed. The next sections will demonstrate how, for empirically plausible parameter values, this
general-equilibrium effect will produce the counter-intuitive result that increases in the capital-income tax will at first increase steady-state capital, even with the fixed interest-rate effect working in the opposite direction.
is very likely positive. This means that the general-equilibrium effect of insurance on the adjustment of the
interest rate, and the subsequent effect of this adjustment on wealth accumulation, is crucial for overthrowing the negative effect of the capital-income tax on capital when the interest rate is fixed. The next sections will demonstrate how, for empirically plausible parameter values, this
general-equilibrium effect will produce the counter-intuitive result that increases in the capital-income tax will at first increase steady-state capital, even with the fixed interest-rate effect working in the opposite direction.
5 Calibration and Steady-State Implications
For the quantitative part of the paper, the benchmark model analyzed so far is extended to include endogenous labor. Preferences are assumed homothetic between consumption, ![]() and leisure,
and leisure,
![]() , according to the King-Plosser-Rebelo (1988) specification, and they are defined as the limit, for
, according to the King-Plosser-Rebelo (1988) specification, and they are defined as the limit, for
![]() , of:
, of:
| (30) |
The appendix presents all proofs for the general case of endogenous labor. Note also that the calibration will treat the case with two types of agents, i.e. there will be both entrepreneurs and laborers in the model. This section will present the benchmark calibration, and will examine its implication for the steady-state aggregates and wealth distributions. The next section will then focus on the effects of capital-income taxation for aggregates and welfare.
5.1 Simulations
The dynamic system described in Proposition
![]() , and generalized to the case of endogenous labor, is highly tractable compared to other incomplete-markets models, where the entire wealth
distribution is a relevant state variable for aggregate equilibrium dynamics. The steady state of the system is found by setting the dynamics of all equations in Proposition
, and generalized to the case of endogenous labor, is highly tractable compared to other incomplete-markets models, where the entire wealth
distribution is a relevant state variable for aggregate equilibrium dynamics. The steady state of the system is found by setting the dynamics of all equations in Proposition
![]() to zero. The algorithm first solves for the steady-state aggregates, which are deterministic and characterized by Proposition
to zero. The algorithm first solves for the steady-state aggregates, which are deterministic and characterized by Proposition
![]() . Subsequently, for any historically given
. Subsequently, for any historically given
![]() , where
, where ![]() is the initial measure of entrepreneurs in
the economy, and
is the initial measure of entrepreneurs in
the economy, and ![]() is the historically given financial wealth of the entrepreneur group, and using as boundary conditions the steady state values of
is the historically given financial wealth of the entrepreneur group, and using as boundary conditions the steady state values of
![]() , it integrates backward until the path of
, it integrates backward until the path of
![]() is close enough to its steady-state value.
is close enough to its steady-state value.
The method of finite differences is used on the general version of the system in Proposition
![]() . The first and second derivatives of the invariant distributions are replaced by their discrete time approximations. The only conditions imposed
are that the probability density functions integrate to one, and that they do not explode to the right. The emerging functions
. The first and second derivatives of the invariant distributions are replaced by their discrete time approximations. The only conditions imposed
are that the probability density functions integrate to one, and that they do not explode to the right. The emerging functions ![]() and
and ![]() are well-behaved and stable.
are well-behaved and stable.
Subsequently, Monte-Carlo simulations are performed. The processes of dying, of type-switching, and of the idiosyncratic capital-income shocks, are simulated using random number generators for series of 200,000 households and 100,000 years. The wealth distributions generated converge to those produced by the finite-differences method, and their variances are stable as time increases. Finally, using these distributions, welfare calculations are performed.
5.2 Parameter choice
The economy is parameterized by
![]() . Table 1 presents the parameter choices for the preferred benchmark model calibration.
. Table 1 presents the parameter choices for the preferred benchmark model calibration.
|
The parameter values chosen refer to annual data from the United States. The discount rate is
![]() . The preference parameter is
. The preference parameter is ![]() , which is standard in the
macro literature21. The income share of capital is
, which is standard in the
macro literature21. The income share of capital is
![]() . The depreciation rate is
. The depreciation rate is
![]() . The probability of death is chosen to be
. The probability of death is chosen to be ![]() , a compromise
between having an empirically relevant probability of death and allowing for some altruism across generations. The probability of exiting entrepreneurship is
, a compromise
between having an empirically relevant probability of death and allowing for some altruism across generations. The probability of exiting entrepreneurship is
![]() . The probability of entering entrepreneurship is
. The probability of entering entrepreneurship is
![]() . These two values were estimated from the PSID and SCF data, and subsequently used for calibrations, by Quadrini (2000). In Quadrini's model, as well as here, they imply a
fraction of entrepreneurs in the total population of
. These two values were estimated from the PSID and SCF data, and subsequently used for calibrations, by Quadrini (2000). In Quadrini's model, as well as here, they imply a
fraction of entrepreneurs in the total population of ![]() ,22 which is in line with the data, as Quadrini and Cagetti and DeNardi (2006) document.
,22 which is in line with the data, as Quadrini and Cagetti and DeNardi (2006) document.
The elasticity of intertemporal substitution is chosen to be ![]() . The empirical estimates of the EIS vary a lot. Using aggregate British data and correcting for aggregation bias,
Attanasio and Weber (1993) estimate
. The empirical estimates of the EIS vary a lot. Using aggregate British data and correcting for aggregation bias,
Attanasio and Weber (1993) estimate ![]() to be about 0.7. Although the exact
estimates from micro data vary across studies and specifications, in most cases they are around 1, especially for agents at the top layers of wealth and asset holdings. For example, using
data from the Consumer Expenditure Survey (CEX) and an Epstein-Zin specification, as in the present paper, Vissing-Jørgensen and Attanasio (2003) report baseline estimates between 1
and 1.4 for stockholders.
to be about 0.7. Although the exact
estimates from micro data vary across studies and specifications, in most cases they are around 1, especially for agents at the top layers of wealth and asset holdings. For example, using
data from the Consumer Expenditure Survey (CEX) and an Epstein-Zin specification, as in the present paper, Vissing-Jørgensen and Attanasio (2003) report baseline estimates between 1
and 1.4 for stockholders.
The proportional tax on capital income is
![]() . The Congressional Budget Office Background Paper (December 2006) reports that the average marginal rate at which corporate profits are taxed is
. The Congressional Budget Office Background Paper (December 2006) reports that the average marginal rate at which corporate profits are taxed is ![]() , whereas the average marginal rate at which non-corporate business income is taxed is around
, whereas the average marginal rate at which non-corporate business income is taxed is around ![]() .
The CRS Report for Congress (October 2003) details the capital income tax revisions and effective tax rates due to provisions granted through bonus depreciations of
.
The CRS Report for Congress (October 2003) details the capital income tax revisions and effective tax rates due to provisions granted through bonus depreciations of ![]() or
or ![]() . If these provisions are taken into account, the average marginal capital income tax is between
. If these provisions are taken into account, the average marginal capital income tax is between ![]() for non-corporate businesses and between
for non-corporate businesses and between ![]() for corporate businesses. The value of
for corporate businesses. The value of
![]() is chosen to be in the middle of these estimates.23 The proportional tax on labor income is
is chosen to be in the middle of these estimates.23 The proportional tax on labor income is
![]() . The Congressional Budget Office Background Paper (December 2006) reports that the median effective marginal tax rate on labor income is
. The Congressional Budget Office Background Paper (December 2006) reports that the median effective marginal tax rate on labor income is ![]() , inclusive of federal, state and payroll taxes.24 Incorporating the
distortionary effect of social security taxes would further increase this number, hence the choice made here. The level of government spending,
, inclusive of federal, state and payroll taxes.24 Incorporating the
distortionary effect of social security taxes would further increase this number, hence the choice made here. The level of government spending, ![]() , is chosen so that the steady-state
government-spending-to-GDP ratio is
, is chosen so that the steady-state
government-spending-to-GDP ratio is ![]() .
.
The coefficient of relative risk aversion is chosen to be ![]() . The empirical estimation of
. The empirical estimation of ![]() is a complicated task, because, as Vissing-Jørgensen and Attanasio (2003) detail, it requires making additional assumptions about the covariance of consumption growth with stock returns, the share of stocks in the financial wealth portfolio, the properties of the
expected returns to human capital, and the share of human capital in overall wealth. Using the Consumer Expenditure Survey (CEX), Vissing-Jørgensen and Attanasio find estimates of risk aversion for stockholders in the range of 5-10, but with a broader sample and under different assumptions these estimates go up to 20-30. They also compare their results to Campbell
(1996), who estimates
is a complicated task, because, as Vissing-Jørgensen and Attanasio (2003) detail, it requires making additional assumptions about the covariance of consumption growth with stock returns, the share of stocks in the financial wealth portfolio, the properties of the
expected returns to human capital, and the share of human capital in overall wealth. Using the Consumer Expenditure Survey (CEX), Vissing-Jørgensen and Attanasio find estimates of risk aversion for stockholders in the range of 5-10, but with a broader sample and under different assumptions these estimates go up to 20-30. They also compare their results to Campbell
(1996), who estimates ![]() in the range of 17-25, using data on monthly and
annual returns, and assuming that the entire financial portfolio is held in stocks. Alan and Browning (2008), use the PSID data to structurally estimate the joint distribution of discount factors and relative risk aversion coefficients. They find that the lower educated households are less risk
averse than the more educated households, and that the medians of the two relative risk aversion distributions are 6.2 and 8.4 respectively. Guiso and Paiella (2005), using data from the 1995 Bank of Italy Survey on Household Income and Wealth, estimate direct measures of risk aversion based on the maximum price a consumer is willing to pay to buy a risky asset. They find
that the median relative risk aversion is 6, if consumers have a one-year horizon, and it is 16, if they have a lifetime horizon. Dohmen et el. (2005) present evidence on the distribution of risk attitudes in the population, using survey questions and a representative sample of
in the range of 17-25, using data on monthly and
annual returns, and assuming that the entire financial portfolio is held in stocks. Alan and Browning (2008), use the PSID data to structurally estimate the joint distribution of discount factors and relative risk aversion coefficients. They find that the lower educated households are less risk
averse than the more educated households, and that the medians of the two relative risk aversion distributions are 6.2 and 8.4 respectively. Guiso and Paiella (2005), using data from the 1995 Bank of Italy Survey on Household Income and Wealth, estimate direct measures of risk aversion based on the maximum price a consumer is willing to pay to buy a risky asset. They find
that the median relative risk aversion is 6, if consumers have a one-year horizon, and it is 16, if they have a lifetime horizon. Dohmen et el. (2005) present evidence on the distribution of risk attitudes in the population, using survey questions and a representative sample of ![]() individuals living in Germany. The behavioral relevance of their survey is tested by conducting a complementary field experiment, based on a representative sample, and the conclusion is that the survey measure is a good predictor of actual risk-taking behavior. They find that
the bulk of the mass in the
individuals living in Germany. The behavioral relevance of their survey is tested by conducting a complementary field experiment, based on a representative sample, and the conclusion is that the survey measure is a good predictor of actual risk-taking behavior. They find that
the bulk of the mass in the ![]() -distribution is located between 1-10. There
is, however, a non-negligible mass of estimates in the range of higher values, up to 20. Barsky et al. (1997) measure risk aversion based on survey responses by participants in the Health
and Retirement Study to hypothetical situations. They find that most individuals fall in the category that has mean relative risk aversion of 15.8. Cohen and Einav (2005) use a data set of
100,000 individuals' deductible choices in auto insurance contracts, to estimate the distribution of risk preferences. They find that the 82nd percentile in the distribution of the coefficient of relative risk aversion is about 13-15.25
-distribution is located between 1-10. There
is, however, a non-negligible mass of estimates in the range of higher values, up to 20. Barsky et al. (1997) measure risk aversion based on survey responses by participants in the Health
and Retirement Study to hypothetical situations. They find that most individuals fall in the category that has mean relative risk aversion of 15.8. Cohen and Einav (2005) use a data set of
100,000 individuals' deductible choices in auto insurance contracts, to estimate the distribution of risk preferences. They find that the 82nd percentile in the distribution of the coefficient of relative risk aversion is about 13-15.25
The volatility coefficient is chosen to be
![]() . The empirical estimation of the standard deviation of idiosyncratic entrepreneurial returns is a very difficult task, and has not as yet received much attention in the
literature. So far, the most thorough attempt to measure idiosyncratic risk is by Moskowitz and Vissing-Jørgensen (2002). They document poor diversification and extreme concentration of entrepreneurial investment, significant heterogeneity in individual investment choices, and high risk at
the individual level due to high bankruptcy rates. However, because of the problems arising when imputing labor income, and because of the lack of sufficient time dimension in the Survey of Consumer Finances (SCF) data, they cannot provide an accurate estimate of the volatility of entrepreneurial
returns for unincorporated businesses. In the end, they conjecture that the volatility of returns for private firms cannot be lower than the corresponding volatility of publicly traded firms, which the find to be about 0.5 per annum.26 Davis et al. (2006) use the Longitudinal Business Database (LBD), which contains annual observations on
employment and payroll for all establishments and firms in the private sector, to estimate the volatility of employment growth rates. They find that, in 2001, the ratio of private to public
volatility was in the range 1.43-1.75. Given that the average annual standard deviation for public firms over 1990-1997 was 0.11,27 and that there is, at least in the context of the present model, a close relationship between volatility of profits and volatility of labor demand, the choice of
. The empirical estimation of the standard deviation of idiosyncratic entrepreneurial returns is a very difficult task, and has not as yet received much attention in the
literature. So far, the most thorough attempt to measure idiosyncratic risk is by Moskowitz and Vissing-Jørgensen (2002). They document poor diversification and extreme concentration of entrepreneurial investment, significant heterogeneity in individual investment choices, and high risk at
the individual level due to high bankruptcy rates. However, because of the problems arising when imputing labor income, and because of the lack of sufficient time dimension in the Survey of Consumer Finances (SCF) data, they cannot provide an accurate estimate of the volatility of entrepreneurial
returns for unincorporated businesses. In the end, they conjecture that the volatility of returns for private firms cannot be lower than the corresponding volatility of publicly traded firms, which the find to be about 0.5 per annum.26 Davis et al. (2006) use the Longitudinal Business Database (LBD), which contains annual observations on
employment and payroll for all establishments and firms in the private sector, to estimate the volatility of employment growth rates. They find that, in 2001, the ratio of private to public
volatility was in the range 1.43-1.75. Given that the average annual standard deviation for public firms over 1990-1997 was 0.11,27 and that there is, at least in the context of the present model, a close relationship between volatility of profits and volatility of labor demand, the choice of
![]() could also be justified from this perspective. Finally, this choice generates an annual variance for steady-state consumption growth in the range indicated by the micro data,
once consumer heterogeneity is taken into account.28
could also be justified from this perspective. Finally, this choice generates an annual variance for steady-state consumption growth in the range indicated by the micro data,
once consumer heterogeneity is taken into account.28
Parameters ![]() and
and ![]() are especially important for the calibrated model,
for two reasons. First, they directly influence
are especially important for the calibrated model,
for two reasons. First, they directly influence ![]() , the fraction of wealth held by entrepreneurs in the economy. And then, for example, as mentioned in section
, the fraction of wealth held by entrepreneurs in the economy. And then, for example, as mentioned in section
![]() , when
, when ![]() falls, i.e. when
the entrepreneurs borrow more from the laborers, then, for given prices,
falls, i.e. when
the entrepreneurs borrow more from the laborers, then, for given prices, ![]() falls as well.29 Given this importance of
falls as well.29 Given this importance of ![]() , the calibrated model's implications about
, the calibrated model's implications about ![]() are a good criterion of model performance. As will be shown in section
are a good criterion of model performance. As will be shown in section
![]() , the choices
, the choices ![]() and
and
![]() , which seem empirically relevant given the discussion above, produce, without an attempt to match it, a value for
, which seem empirically relevant given the discussion above, produce, without an attempt to match it, a value for ![]() that is reasonably close to the values documented in the data. Second, parameters
that is reasonably close to the values documented in the data. Second, parameters ![]() and
and ![]() relate to the interpretation of the capital-income tax as providing insurance. For this reason, comparative statics will also be performed, in section
relate to the interpretation of the capital-income tax as providing insurance. For this reason, comparative statics will also be performed, in section
![]() , to show how the tax that maximizes the steady-state capital stock varies with risk aversion and the volatility of risk. The main result,
that steady-state capital is inversely U-shaped with respect to the capital-income tax, is preserved qualitatively for
, to show how the tax that maximizes the steady-state capital stock varies with risk aversion and the volatility of risk. The main result,
that steady-state capital is inversely U-shaped with respect to the capital-income tax, is preserved qualitatively for
![]() and for
and for
![]() .
.
5.3 Implications for steady-state aggregates and distributions
This section undertakes the examination of the quantitative performance of the model in terms of aggregates and wealth distributions, for three reasons. First, to show how wealth inequality is influenced by the random-walk component introduced in wealth by the idiosyncratic investment risk.
Second, to demonstrate how wealth inequality depends on the excess returns to entrepreneurship, which is an important question in its own right, but also in view of the impact of agent heterogeneity on capital accumulation. Third, to provide some additional confidence in the main quantitative
results presented in the next section (section
![]() ) about the effects of capital-income taxation on capital accumulation, by showing that the model performs well in matching aspects of the
US aggregate and welfare data.
) about the effects of capital-income taxation on capital accumulation, by showing that the model performs well in matching aspects of the
US aggregate and welfare data.
Table 2 presents the implications of the model for steady-state aggregates, and compares them to the data from the US economy. The model's capital-output ratio is ![]() . Investment is
. Investment is ![]() of GDP. The safe rate is
of GDP. The safe rate is ![]() . The steady-state fraction of entrepreneurs,
. The steady-state fraction of entrepreneurs, ![]() , is
, is ![]() , and it matches the data by choice of the transition probabilities, as explained in section
, and it matches the data by choice of the transition probabilities, as explained in section
![]() . Entrepreneurs hold
. Entrepreneurs hold ![]() of
total wealth in the economy, where the equivalent of
of
total wealth in the economy, where the equivalent of ![]() in the data is the ratio
in the data is the ratio ![]() 30. The share of total wealth held by entrepreneurs in the data ranges between
30. The share of total wealth held by entrepreneurs in the data ranges between ![]() . The model-generated value for
. The model-generated value for ![]() is an indication that the model performs reasonably well, especially given the low
value of
is an indication that the model performs reasonably well, especially given the low
value of ![]() used in the calibration, and also since the rest of the aggregates could have been matched by a standard neoclassical growth model. The fraction of entrepreneurs in the top
used in the calibration, and also since the rest of the aggregates could have been matched by a standard neoclassical growth model. The fraction of entrepreneurs in the top
![]() of the population is
of the population is ![]() in the model, whereas in the data this number
ranges between
in the model, whereas in the data this number
ranges between ![]() .31
.31
Next, Table 3 examines the wealth distribution generated by the model. The first two rows present the percentiles for wealth computed by Quadrini (2000), using the PSID and SCF samples for
1994 and 1992, respectively. The last row is the conditional wealth distribution of the benchmark calibrated model.32
|
Aiyagari's (1994) benchmark calibration predictions for the wealth holdings of the top ![]() and the top
and the top ![]() of the population are
of the population are ![]() and
and ![]() ,
respectively. Hence, the present model demonstrates how the random-walk component introduced in wealth by entrepreneurial risk helps generate a fatter right tail in the wealth distribution.33
,
respectively. Hence, the present model demonstrates how the random-walk component introduced in wealth by entrepreneurial risk helps generate a fatter right tail in the wealth distribution.33
Next, Figure 1 plots the Lorenz curves for the model's aggregate wealth and consumption distributions. The model produces results in the right direction, in that the distribution of wealth over the population is much more unequal than the distribution of consumption. The model's Gini coefficient for wealth, conditional on wealth being positive, is 0.62. The model's Gini coefficient for consumption is 0.15.34 In the data, the Gini coefficient for total net worth is 0.8, and the Gini coefficient for consumption is 0.32.
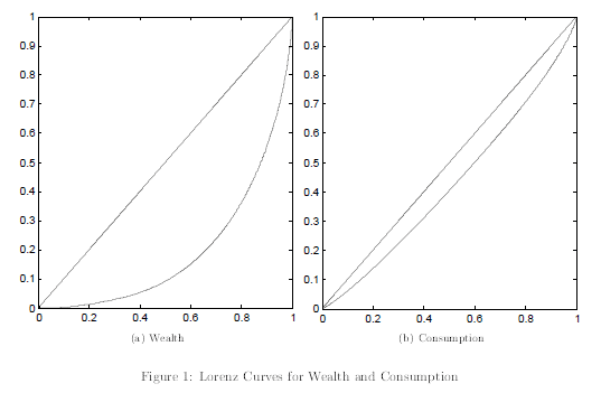
Finally, Figure 2 presents the model's conditional wealth distributions over entrepreneurs and laborers. On the horizontal axis is wealth normalized by mean annual income in the economy. On the vertical axis are frequencies. The solid line represents entrepreneurs, and the dashed line laborers. Consistent with the data, the distribution of wealth for the population of entrepreneurs displays a fatter tail than the one for laborers. This is due to the random-walk component that the uninsurable investment risk introduces into entrepreneurial wealth. Furthermore, the entrepreneurial wealth distribution is shifted to the right, and it has lower frequencies at lower levels of wealth. This is due to the higher mean return of the total entrepreneurial portfolio. Finally, the distributions of wealth for both groups have significant mass of people with wealth higher than fifty times mean income. In the model, the laborers at the right tail of the wealth distribution are former successful entrepreneurs.
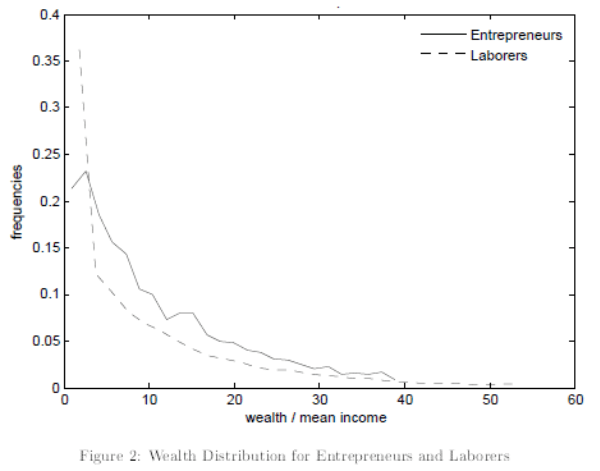
6 Effects of Capital-Income Taxation
Having gained some confidence about the overall quantitative performance of the model, this section now proceeds to study the effects of capital-income taxation in the benchmark calibration, where again the relevant parameters are those of Table 1. Subsection
![]() examines the steady-state effects of capital-income taxation, while subsection
examines the steady-state effects of capital-income taxation, while subsection
![]() examines the aggregate and welfare implications of abolishing the capital-income tax.
examines the aggregate and welfare implications of abolishing the capital-income tax.
6.1 Steady state
This section quantifies the main theoretical result of the paper, which is that an increase in the capital-income tax increases the steady-state capital stock, when the tax is low enough. As already explained, this result is due to the general-equilibrium effect of the insurance aspect of the capital-income tax, and it operates mainly through the endogenous adjustment of the interest rate.
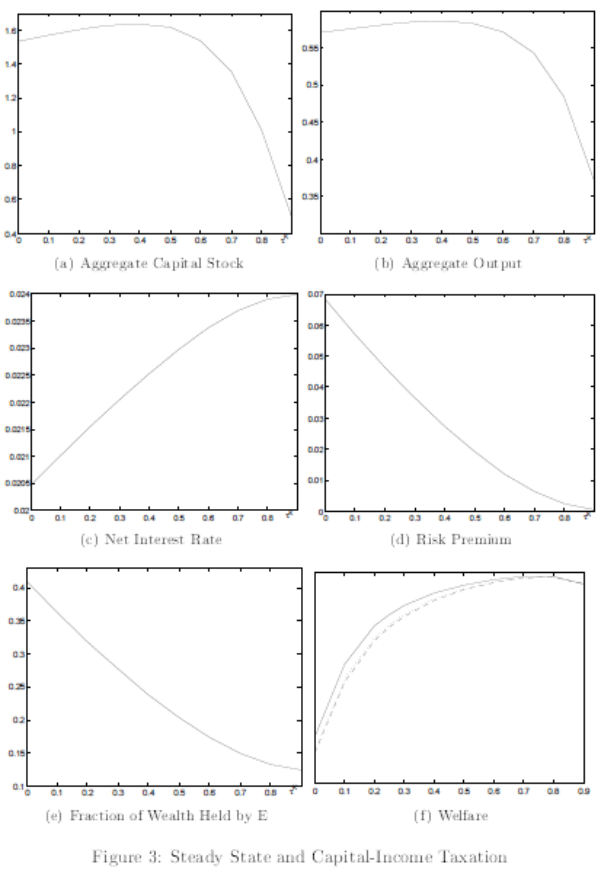
Figure 3 shows the behavior of the steady-state aggregates and welfare with respect to the capital-income tax. Capital (panel ![]() ) and output (panel
) and output (panel ![]() ) are inversely-U shaped with respect to the capital-income tax, and they reach a maximum when
) are inversely-U shaped with respect to the capital-income tax, and they reach a maximum when
![]() . The same is true for employment, the capital-labor (capital per work-hour) ratio, and output per work-hour. At
. The same is true for employment, the capital-labor (capital per work-hour) ratio, and output per work-hour. At
![]() , steady-state capital per work-hour is
, steady-state capital per work-hour is ![]() higher than when
higher than when
![]() , and output per work-hour is
, and output per work-hour is ![]() higher. As shown in Figure
higher. As shown in Figure
![]() , aggregate welfare is maximized at
, aggregate welfare is maximized at
![]() , whether for entrepreneurs (solid line), laborers (dashed line), or the economy as a whole (dotted line).35 This is because of the combined direct insurance effect of the tax, through the reduction in
, whether for entrepreneurs (solid line), laborers (dashed line), or the economy as a whole (dotted line).35 This is because of the combined direct insurance effect of the tax, through the reduction in
![]() , and the effect of the tax on aggregates.
, and the effect of the tax on aggregates.
Figure ![]() shows that the net interest rate increases with the tax, and that it tends to the discount rate,
shows that the net interest rate increases with the tax, and that it tends to the discount rate,
![]() , as
, as
![]() . This is the demonstration of the precautionary saving motive mentioned in section
. This is the demonstration of the precautionary saving motive mentioned in section
![]() : when the capital-income tax increases, the effective volatility of risk facing an entrepreneur decreases, which reduces the demand for
precautionary saving, and therefore increases the interest rate. Figure
: when the capital-income tax increases, the effective volatility of risk facing an entrepreneur decreases, which reduces the demand for
precautionary saving, and therefore increases the interest rate. Figure ![]() reinforces this interpretation of the capital-income tax as providing insurance: when the tax increases, the
precautionary saving motive becomes weaker, and therefore entrepreneurs are satisfied with a lower risk premium. Figure
reinforces this interpretation of the capital-income tax as providing insurance: when the tax increases, the
precautionary saving motive becomes weaker, and therefore entrepreneurs are satisfied with a lower risk premium. Figure ![]() shows that the fraction of wealth held by entrepreneurs in the
economy is decreasing in the capital-income tax. This results from the combination of the weaker precautionary saving motive, and the fall in the risk premium.
shows that the fraction of wealth held by entrepreneurs in the
economy is decreasing in the capital-income tax. This results from the combination of the weaker precautionary saving motive, and the fall in the risk premium.
At this point, it is useful to compare the effects of capital-income taxation in the present model to those under complete markets, where there is no scope for insurance (assuming that agents are homogeneous), as well as to those in the open economy version of the model, where only the direct
insurance aspect of the tax is present. As already mentioned, here, at
![]() , steady-state capital per work-hour and output per work-hour are
, steady-state capital per work-hour and output per work-hour are ![]() and
and ![]() , respectively, higher than when
, respectively, higher than when ![]() . By
contrast, under complete markets,36 at
. By
contrast, under complete markets,36 at
![]() , steady-state capital per work-hour and output per work-hour are
, steady-state capital per work-hour and output per work-hour are ![]() and
and ![]() lower than when
lower than when ![]() . And finally, in the open-economy version of
the model the aggregates fall all the way with the tax, but less so than under complete markets. In particular, at
. And finally, in the open-economy version of
the model the aggregates fall all the way with the tax, but less so than under complete markets. In particular, at
![]() , steady-state capital per work-hour and output per work-hour are
, steady-state capital per work-hour and output per work-hour are ![]() and
and ![]() lower than when
lower than when ![]() . In addition, steady-state welfare is maximized
when
. In addition, steady-state welfare is maximized
when
![]() , which reflects solely the direct insurance aspect of the tax.
, which reflects solely the direct insurance aspect of the tax.
Finally, in order to reinforce the insurance interpretation of the tax system, Figure 4 presents robustness checks with respect to volatility, ![]() , and risk aversion,
, and risk aversion, ![]() . On the vertical axis is the tax that maximizes the steady-state capital stock. When either the
volatility of risk increases or risk aversion increases, the tax that maximizes the steady-state capital stock increases. These comparative statics also indicate that the main result of the paper is robust to the wide range of empirically plausible values of
. On the vertical axis is the tax that maximizes the steady-state capital stock. When either the
volatility of risk increases or risk aversion increases, the tax that maximizes the steady-state capital stock increases. These comparative statics also indicate that the main result of the paper is robust to the wide range of empirically plausible values of
![]() and of
and of
![]() . In particular, for the low value of
. In particular, for the low value of
![]() , the capital-income tax that maximizes the steady-state capital stock is positive for all
, the capital-income tax that maximizes the steady-state capital stock is positive for all ![]() , and it is actually zero when
, and it is actually zero when ![]() .
.
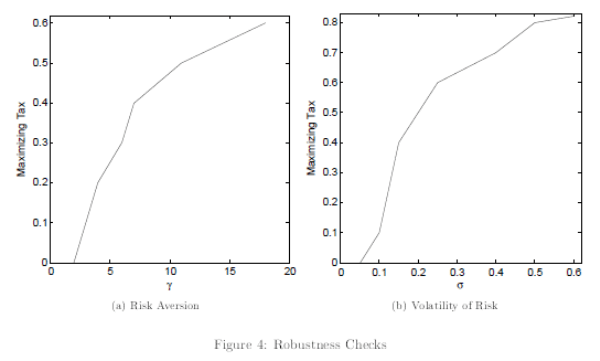
6.2 Dynamics of eliminating the capital-income tax
This section proceeds to examine the aggregate and welfare implications of eliminating the capital-income tax. In the standard representative-agent complete-markets neoclassical model, the optimal capital-income tax is zero in the long run, as well as in most of the short run for an interesting class of preferences. Steady-state welfare is also decreasing in the level of the capital-income tax. These findings have initiated an extensive debate as to the possible benefits of eliminating the tax on capital income. By contrast, the main result of the present paper is that an increase in the capital-income tax may actually increase the steady-state capital stock. In light of this result, it is worthwhile to revisit the discussion on the implications of setting the capital-income tax to zero.
The effects on aggregates and welfare when the capital-income tax is eliminated will be examined from two perspectives. On the one hand, one might be interested in examining the welfare of the current generation immediately after the policy reform, taking into account the entire transitional dynamics of the economy towards the new steady state with the zero tax. On the other hand, one might be interested in examining the welfare of the generations that will be alive in the distant future, i.e. at the new steady state in the long run.
The present model can in fact examine the current-generation implications of policy reforms, because it is very tractable, compared to other incomplete-markets models, where the entire wealth distribution is a relevant state variable. Here, only the mean of the wealth distribution is relevant for aggregate dynamics, which constitutes a significant gain in tractability, and allows for the entire dynamic response of the economy, after a policy change, to be considered. This is important, since it has long been recognized that the immediate effects of policy may well be very different from the long-run effects.
Here, the economy starts from the steady state described by the benchmark calibration parameters in Table 1, where the capital-income tax is
![]() . Subsequently, the tax is set to zero, ceteris paribus.
. Subsequently, the tax is set to zero, ceteris paribus.
6.2.1 Aggregate effects
This section presents the short-run and long-run responses of the aggregate variables to the policy reform that eliminates the capital-income tax. Table 4 shows the response of the
aggregates on the impact of the policy reform (denoted by Current), as well as at the new steady state (denoted by Long Run), under both complete markets and the present model of incomplete markets. The effects on the interest rate, ![]() , the risk premium,
, the risk premium, ![]() , and the investment-output ratio,
, and the investment-output ratio, ![]() , are in percentage units. The rest of the numbers denote percentage changes.
, are in percentage units. The rest of the numbers denote percentage changes.
|
Under complete markets, a permanent (unanticipated) tax cut leads to an immediate negative jump in consumption and an immediate positive jump in investment. Capital slowly increases and converges to a higher steady-state value, while consumption is initially lower and increases over time. In other words, the long-run increase in investment requires an initial period of lower consumption, which in turn allows for an immediate increase in investment as well. By contrast, under incomplete markets, the exact opposite is the case. In light of the main mechanism of the paper, investment decreases in the long run. This allows for an immediate increase in consumption, and therefore necessitates a fall in current investment. In particular, the investment-output ratio falls by more than 3 percentage units. These effects are also illustrated in Figure 5, which plots the impulse responses of the variables when the capital-income tax is eliminated.
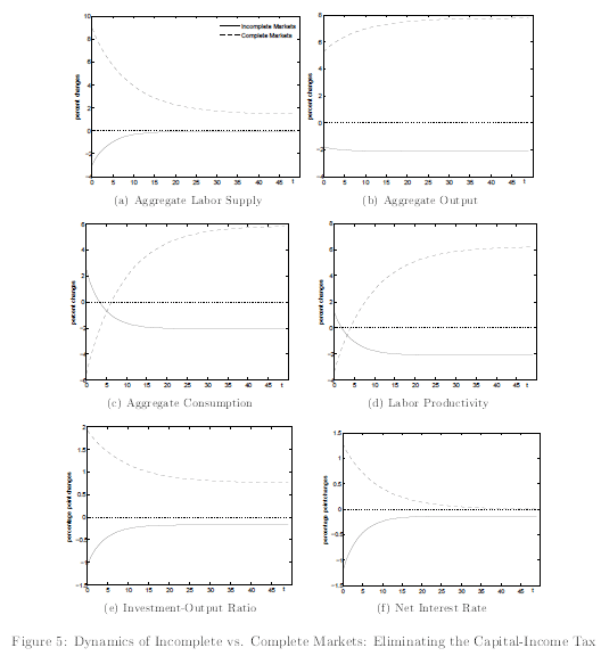
6.2.2 Welfare effects
This section studies the welfare implications of eliminating the capital-income tax. These implications are represented in terms of a compensating differential for each level of wealth and each type of agent, whether entrepreneur or laborer. In particular, starting from the old regime with
![]() , the question is what fraction of his financial wealth would an agent be willing to give up in order to avoid the impact of the new regime initiated by the policy change, either
immediately or in the long run.
, the question is what fraction of his financial wealth would an agent be willing to give up in order to avoid the impact of the new regime initiated by the policy change, either
immediately or in the long run.
Figure 6 presents the welfare implications of abolishing the capital-income tax for entrepreneurs (solid line) and laborers (dashed line). Panel ![]() shows the welfare implications for the current generation, taking into account the entire transitional dynamics of the economy towards the new steady-state, and panel
shows the welfare implications for the current generation, taking into account the entire transitional dynamics of the economy towards the new steady-state, and panel ![]() shows the welfare implications for the generations alive at the new steady state. Financial wealth normalized by annual mean income is on the horizontal axis, and the compensating differentials are on the vertical axis. A negative number on the
vertical axis indicates an agent who benefits from the reform: the agent would have to be paid to be indifferent between the old regime and the regime initiated by the impact of the policy change, hence the agent prefers the new regime with the zero capital-income tax.
shows the welfare implications for the generations alive at the new steady state. Financial wealth normalized by annual mean income is on the horizontal axis, and the compensating differentials are on the vertical axis. A negative number on the
vertical axis indicates an agent who benefits from the reform: the agent would have to be paid to be indifferent between the old regime and the regime initiated by the impact of the policy change, hence the agent prefers the new regime with the zero capital-income tax.

Figure ![]() shows that current-generation poor agents, whether entrepreneurs or laborers, prefer the zero capital-income tax regime. As wealth increases, both entrepreneurs and laborers
prefer the positive capital-income tax regime. Finally, the mean cost of eliminating the tax is higher for the middle-class agents than for the very rich. Figure
shows that current-generation poor agents, whether entrepreneurs or laborers, prefer the zero capital-income tax regime. As wealth increases, both entrepreneurs and laborers
prefer the positive capital-income tax regime. Finally, the mean cost of eliminating the tax is higher for the middle-class agents than for the very rich. Figure ![]() shows that, in the long
run, both types of agents and at all wealth levels prefer the steady state with the positive tax, the rich less so than the poor, and the entrepreneurs less so than the laborers.
shows that, in the long
run, both types of agents and at all wealth levels prefer the steady state with the positive tax, the rich less so than the poor, and the entrepreneurs less so than the laborers.
These cross-sectional differences can be explained by referring to Figure 7, which plots, in the top row for the current generation, and in the bottom row for the long-run generation, the
response of human wealth and of the (risk-adjusted) returns to saving for laborers and entrepreneurs, against the tax rate of the policy reform. Let's first turn to the immediate implications. The decrease in the capital-income tax from
![]() to
to ![]() increases the demand for precautionary saving, and
therefore leads to a fall in the interest rate.37 Roughly speaking, since the capital stock is historically given and cannot change, the fall in the
interest rate increases human wealth. For poor agents, whether entrepreneurs or laborers, human wealth constitutes a significant part of total wealth, and hence they benefit from the elimination of the tax. Furthermore, poor agents do not benefit much from insurance directly, since they invest
little or nothing in the risky asset. Therefore, in the short run, poor agents prefer the zero capital-income tax regime, mainly because the elimination of the tax increases their safe income, and safe income is a big part of their total wealth. Turning to the long run, the elimination of the
capital-income tax increases the demand for precautionary saving, and it therefore leads to a fall in the interest rate. But now, the general-equilibrium implications of the interest rate adjustment for capital accumulation become relevant. In particular, the fall in the interest rate reduces
steady-state wealth and capital accumulation. It turns out that the fall in the steady-state capital stock dominates the fall in the interest rate, so that in the end steady-state human wealth falls. This adversely affects poor agents of all types, since human wealth represents a big part of their
total wealth. Because the risk-adjusted return for entrepreneurs,
increases the demand for precautionary saving, and
therefore leads to a fall in the interest rate.37 Roughly speaking, since the capital stock is historically given and cannot change, the fall in the
interest rate increases human wealth. For poor agents, whether entrepreneurs or laborers, human wealth constitutes a significant part of total wealth, and hence they benefit from the elimination of the tax. Furthermore, poor agents do not benefit much from insurance directly, since they invest
little or nothing in the risky asset. Therefore, in the short run, poor agents prefer the zero capital-income tax regime, mainly because the elimination of the tax increases their safe income, and safe income is a big part of their total wealth. Turning to the long run, the elimination of the
capital-income tax increases the demand for precautionary saving, and it therefore leads to a fall in the interest rate. But now, the general-equilibrium implications of the interest rate adjustment for capital accumulation become relevant. In particular, the fall in the interest rate reduces
steady-state wealth and capital accumulation. It turns out that the fall in the steady-state capital stock dominates the fall in the interest rate, so that in the end steady-state human wealth falls. This adversely affects poor agents of all types, since human wealth represents a big part of their
total wealth. Because the risk-adjusted return for entrepreneurs,
![]() , increases when the capital-income tax is eliminated, the cost of the policy change is not as high for an entrepreneur as it is for a laborer at any given level of wealth.
, increases when the capital-income tax is eliminated, the cost of the policy change is not as high for an entrepreneur as it is for a laborer at any given level of wealth.
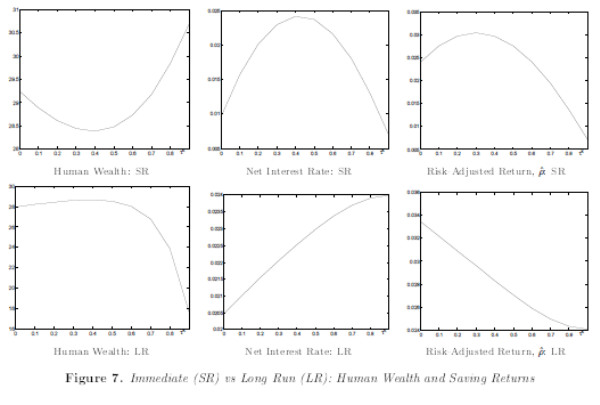
In conclusion, the elimination of the capital-income tax has welfare implications that differ across time and in the cross-section of the population. These differences are due to the general-equilibrium effects of the interest rate adjustment on capital accumulation. In particular, they operate mainly through the different response of human wealth: immediately after the elimination of the tax, when the capital stock cannot adjust, human wealth increases, whereas in the long run, when capital accumulation changes endogenously, human wealth falls. Therefore, current-generation poor agents prefer a zero capital-income tax in the short run, whereas future-generation poor agents prefer a positive capital-income tax. Rich agents always prefer a positive tax, but less forcefully in the long-run, because in the long run the elimination of the tax increases the mean entrepreneurial portfolio return.
7 Extension: Introducing Publicly Traded Sector
So far it has been assumed that all investment is subject to uninsurable idiosyncratic risk. This might not be an appropriate assumption for a country like the United States, where private equity actually accounts for about ![]() of total financial wealth. In order to capture this fact, and to demonstrate the robustness of the main mechanism, a second sector of production is here formally introduced. In this sector, all firms are publicly traded, and it is assumed that they can
perfectly diversify away all idiosyncratic risks.38
of total financial wealth. In order to capture this fact, and to demonstrate the robustness of the main mechanism, a second sector of production is here formally introduced. In this sector, all firms are publicly traded, and it is assumed that they can
perfectly diversify away all idiosyncratic risks.38
Assume that both entrepreneurs and laborers can invest and work in the public sector. In other words, the public sector is an additional safe asset, but in positive net supply, as opposed to the bond, which is in zero net supply. Let the production function of the public sector be of the same
form as the aggregate production function in the private sector, that is
![]() , where
, where ![]() is the total capital
and
is the total capital
and ![]() is the total labor employed by public firms. Here
is the total labor employed by public firms. Here ![]() is a scaling
factor, ensuring that the mean return to capital in the public sector is lower than in the private sector.39 Let public sector capital be taxed at the rate
is a scaling
factor, ensuring that the mean return to capital in the public sector is lower than in the private sector.39 Let public sector capital be taxed at the rate
![]() , and public sector labor at the rate
, and public sector labor at the rate ![]() . By no arbitrage, in
equilibrium, the risk-free rate will be equal to the marginal product of capital in the public sector, i.e.
. By no arbitrage, in
equilibrium, the risk-free rate will be equal to the marginal product of capital in the public sector, i.e.
![]() , and the wage will be equal to the marginal product of labor in the public sector, i.e.
, and the wage will be equal to the marginal product of labor in the public sector, i.e.
![]() . The rest of the equilibrium characterization proceeds as in the benchmark model, with bond holdings now replaced by the sum of bond and public equity
holdings. So aggregate wealth in the economy will now be
. The rest of the equilibrium characterization proceeds as in the benchmark model, with bond holdings now replaced by the sum of bond and public equity
holdings. So aggregate wealth in the economy will now be
![]() . Hence, we obtain the following variant of Proposition
. Hence, we obtain the following variant of Proposition
![]() .
.
| (31) | |
| (32) | |
| (33) | |
| (34) | |
| (35) |
along with
The proof of Proposition
![]() is straightforward. Following similar steps as in the model with only the private sector, we can show that
is straightforward. Following similar steps as in the model with only the private sector, we can show that
![]() , and
, and
![]() .
.
In the public sector, where there is no scope for insurance, an increase in the capital-income tax unambiguously reduces investment, so that public capital is a negative function of the tax. As a result, the overall effect of the tax on the aggregate capital stock is in general ambiguous. In addition though, the increase in the capital tax might now trigger a reallocation of resources, away from the low-risk and low-productivity public sector, towards the higher-risk and higher-productivity private sector, thus increasing total factor productivity. Hence, aggregate output may increase with the tax, even if aggregate capital falls.
Coming now to the steady-state calibration,40 parameter ![]() is chosen so that the share of private capital in the aggregate capital stock is
is chosen so that the share of private capital in the aggregate capital stock is ![]() . As in the one-sector economy, the calibration ensures that at
. As in the one-sector economy, the calibration ensures that at
![]() , the interest rate is about
, the interest rate is about ![]() , and that government spending as a
fraction of GDP is
, and that government spending as a
fraction of GDP is ![]() . At this level of the tax, the private equity premium is
. At this level of the tax, the private equity premium is ![]() , which is lower than its value of
, which is lower than its value of ![]() in the one-sector economy, since there is now one additional (safe) asset.41 In the two-sector economy, the capital-income tax that maximizes aggregate capital and welfare is zero, and the per capita variables are all decreasing in the tax. However, at
in the one-sector economy, since there is now one additional (safe) asset.41 In the two-sector economy, the capital-income tax that maximizes aggregate capital and welfare is zero, and the per capita variables are all decreasing in the tax. However, at
![]() , the capital-labor ratio in the public sector is
, the capital-labor ratio in the public sector is ![]() lower than it
would have been if
lower than it
would have been if ![]() , i.e. it falls by less than under complete markets, where it would have fallen by
, i.e. it falls by less than under complete markets, where it would have fallen by ![]() . In fact, the capital-labor ratio in publicly traded firms is unambiguously always higher than under complete markets, since the interest rate under incomplete markets is lower than the discount rate. In addition, at
. In fact, the capital-labor ratio in publicly traded firms is unambiguously always higher than under complete markets, since the interest rate under incomplete markets is lower than the discount rate. In addition, at
![]() , the ratio of total output to total labor falls by
, the ratio of total output to total labor falls by ![]() , whereas
under complete markets it falls by
, whereas
under complete markets it falls by ![]() .
.
To summarize, in steady state and for
![]() , output-per work-hour is approximately
, output-per work-hour is approximately ![]() higher than under
complete markets when all production takes place in the private sector, and it is
higher than under
complete markets when all production takes place in the private sector, and it is ![]() higher than under complete markets when the private sector accounts for
higher than under complete markets when the private sector accounts for ![]() of financial assets.
of financial assets.
8 Conclusions
This paper studies the aggregate and welfare effects of capital-income taxation in an environment where agents face uninsurable idiosyncratic entrepreneurial risk. The counter-intuitive result emerging is that an increase in the capital-income tax may actually, due to its general-equilibrium
insurance aspect, stimulate capital accumulation. This result stands in stark contrast to the effects of capital-income taxation in either complete-markets models, or in Bewley-type incomplete-markets models, since in those models capital-income taxation necessarily discourages capital
accumulation. Furthermore, the result is quantitatively significant: for the preferred calibration of the model, the steady-state levels of the capital stock, output, and employment are all maximized for a positive value of the capital-income tax, at which point output per work-hour is ![]() higher than it would have been had the tax rate been zero.42
higher than it would have been had the tax rate been zero.42
Although the present paper provides some useful guidance about the direction of optimal policy, it does not solve for the fully optimal policy. An interesting direction for future research is the formal study of optimal policy, either in the Ramsey tradition (though allowing for lump-sum taxes, as in the present model), or in the Mirrlees tradition of endogenizing the source of market incompleteness and having no ad hoc restrictions placed on the set of available instruments.
This paper focuses on the effects of uninsurable entrepreneurial risk, and abstracts from labor-income risk, borrowing constraints, and decreasing returns to scale at the individual level. Extending the model to include these relevant aspects of the data and revisiting the effects of capital taxation in this richer setting is important, not only to get a better quantitative evaluation of the implications of capital taxation, but also to examine whether the general-equilibrium effects identified here might interact with other sources of market incompleteness in an interesting way. For example, after an increase in the capital-income tax, the increase in steady-state wealth documented here could make borrowing constraints less binding. At the same time, the increase in the steady-state interest rate could also increase the cost of borrowing. Further investigating these rich general-equilibrium interactions will greatly facilitate a better theoretical and quantitative assessment of the implications of fiscal policy in dynamic heterogeneous-agent environments.
9 Appendix: Proofs
where
where
![\displaystyle z(c,U)\equiv\frac{\beta }{1-1/\theta }\left[ \frac{(c_{t}^{1-\psi }n_{t}^{\psi })^{1-1/\theta}} {((1-\gamma )U)^{\frac{-1/\theta +\gamma }{1-\gamma }}}-(1-\gamma )U \right].](img490.gif)
 |
 |
Then:
![\displaystyle g(U_{t})=\frac{J_{t}^{1-1/\theta }}{1-1/\theta}=(1-e^{-\beta\Delta t})\frac{(c_{t}^{1-\psi }n_{t}^{\psi})^{1-1/\theta }}{1-1/\theta }+e^{-\beta\Delta t}g(E_{t}[U_{t+\Delta t}]) .](img493.gif) |
Take a first order Taylor expansion in
![\displaystyle g(U_{t})=g(U_{t})+\beta\frac{(c_{t}^{1-\psi }n_{t}^{\psi })^{1-1/\theta }}{1-1/\theta }\Delta t-\beta g(U_{t})\Delta t+g^{\prime }(U_{t})E_{t}[\Delta U_{t}] .](img495.gif) |
Then:
![\displaystyle E_{t}[\Delta U_{t}]=-\frac{\beta\frac{(c_{t}^{1-\psi }n_{t}^{\psi })^{1-1/\theta }}{1-1/\theta }-\beta g(U_{t})}{g^{\prime }(U_{t})}\Delta t ,](img496.gif) |
where:
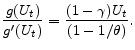 |
Hence:
where:
![\displaystyle z(c_t,n_t,U_t)\equiv \frac{\beta}{1-1/\theta }[\frac{(c_{t}^{1-\psi }n_{t}^{\psi })^{1-1/\theta }}{((1-\gamma )U_t)^{\frac{-1/\theta +\gamma }{1-\gamma }}}-(1-\gamma )U_t] .](img499.gif) |
For a more general proof of the above and for a proof of existence and uniqueness of the solution to the integral equation
Proof of Proposition 3.1. Because of the CRRA/CEIS specification of preferences, guess that the value function for an entrepreneur is:
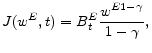 |
where the term
![\displaystyle 0=\max_{c^E, n^E, \phi} {z(c^E,n}^E,J^{E}(w^E,t)) + \frac{\partial J^E}{\partial w^E}(w^E,t)[(\phi (1-\tau^K_t)r_t +(1-\phi)(1-\tau^K_t)R_t)w^E-c^E-(1-\tau _t^{L})\omega _{t}n^E]](img503.gif) |
![\displaystyle + \frac{\partial J^E}{\partial t}(w^E,t) + \frac{1}{2}\frac{\partial^2 J^E}{\partial w^{E 2}}(w^E,t)\sigma ^{2}(1-\tau_t ^{K})^{2}\phi^{2}w^{2} + p_{EL}[J(w^L,t)-J(w^E,t)] ,](img504.gif) |
where the function
| (38) |
From the envelope condition we get:
Similarly, guess that the value function for a laborer is:
 |
The Bellman equation for a laborer is:
![\displaystyle 0=\max_{c^L,n^L} \quad z(c^L,n^L,J^{L}(w^L,t)) +\frac{\partial J^L}{\partial w^L}(w^L,t)[R_tw^L-c^L-(1-\tau _t^{L})\omega _{t}n^L]](img513.gif) |
![\displaystyle + \frac{\partial J^L}{\partial t}(w^L,t) + p_{LE}[J(w^E,t)-J(w^L,t)] .](img514.gif) |
Following similar steps, we get from the envelope condition that:
It follows that:
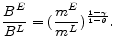 |
Using this, the first order conditions, the envelope conditions, and plugging back into the Bellman equation we get
Proof of Proposition 3.2. Let
![]() be the effective risk-free rate. The human wealth for each individual
be the effective risk-free rate. The human wealth for each individual ![]() in the economy is
in the economy is
![]() . The human wealth of the measure-
. The human wealth of the measure-![]() group of entrepreneurs is
group of entrepreneurs is
![]() , and the human wealth of the measure-
, and the human wealth of the measure-
![]() group of laborers is
group of laborers is
![]() . Hence total human wealth is
. Hence total human wealth is
![]() . Using the Leibniz rule, and substituting in from the government
budget constraint
. Using the Leibniz rule, and substituting in from the government
budget constraint
![]() , we get that the evolution of total human wealth is described by
, we get that the evolution of total human wealth is described by
![]() . Since only entrepreneurs invest in capital, the aggregate capital stock in the economy is given by
. Since only entrepreneurs invest in capital, the aggregate capital stock in the economy is given by
![]() . For an agent in the E and L group respectively,
. For an agent in the E and L group respectively,
![]() and
and ![]() . Aggregating over each
group, we get
. Aggregating over each
group, we get
![]() and
and ![]() . Adding up and
using the fact that
. Adding up and
using the fact that
![]() , we get
, we get
![]() . Now using
. Now using
![]() and
and
![]() , we get
, we get
![]() . Combining
. Combining
![]() ,
,
![]() , and
, and
![]() , we get
, we get
![]() . Aggregating across leisure choices we get
. Aggregating across leisure choices we get
![]() , where
, where
![]() ,
,
![]() , and
, and
![]() . Aggregating across
. Aggregating across
![]() and
and
![]() , and adding up, using
, and adding up, using
![]() ,
,
![]() , and labor market clearing, we get:
, and labor market clearing, we get:
Using
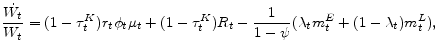 |
which gives
Proof of Proposition 3.3. Consider first the case with ![]() and
and ![]() (and labor is exogenous, so
(and labor is exogenous, so ![]() ). Combining
). Combining
![]() or
or
![]() in steady state, with
in steady state, with
![]() in steady state, and using the definitions of
in steady state, and using the definitions of ![]() and
and
![]() , we get equation
, we get equation
![]() . Combining
. Combining
![]() with
with
![]() in steady state , we get equation
in steady state , we get equation
![]() .
.
Now, let ![]() and
and
![]() denote, respectively, the risk premium and the fraction of effective wealth held in capital, when
denote, respectively, the risk premium and the fraction of effective wealth held in capital, when ![]() is given by
is given by
![]() :
:
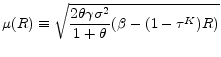 and
and 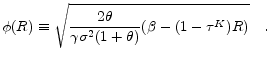
Note that
![\displaystyle K(R)=\left[ \frac{\mu (R)+\delta + R}{\alpha }\right] ^{\frac{1}{\alpha -1}}.](img571.gif)
Finally, for
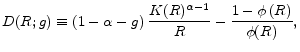
where
Furthermore,
These properties, together with the continuity of
![\displaystyle \frac{\partial D}{\partial R}=(1-\alpha -g)\frac{K(R)^{\alpha -1}}{R^{2}}% \left[{(\alpha -1)R\frac{K^{\prime }(R)}{K\left( R\right) }-1}\right]+\frac{% \phi ^{\prime }(R)}{\phi \left( R\right) ^{2}} .](img598.gif)
In addition:
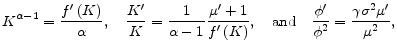 |
where the dependence of
![\displaystyle \frac{1-\alpha -g}{\alpha }\frac{f^{\prime }\left( K\right) }{R^{2}}\left[ R\frac{\mu ^{\prime }+1}{f^{\prime }\left( K\right) }-1\right] +\frac{\gamma \sigma ^{2}\mu ^{\prime }}{\mu ^{2}}=](img604.gif) |
|||
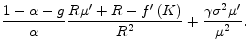 |
Since
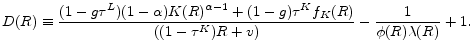 |
However, in that case, uniqueness has not been proved, although simulations suggest that the steady state is always unique.
In order to see how the existence of two types of agents modifies the characterization of the steady state, consider next the case where
![]() , and take
, and take ![]() for simplicity. Then, the marginal propensity
to consume is always constant and equal to
for simplicity. Then, the marginal propensity
to consume is always constant and equal to ![]() , for both types of agents. Equation
, for both types of agents. Equation
![]() in steady state yields
in steady state yields
![]() . Combining this with
. Combining this with
![]() in steady state gives:
in steady state gives:
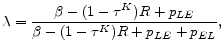
which verifies that
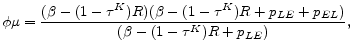
from which, if we use the definition of
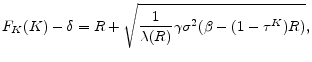
as the relevant version of
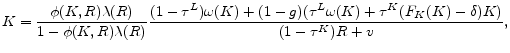
which is the relevant version of
When labor is endogenous and ![]() , then
, then
![]() , and the proofs above carry through the same way, only now with
, and the proofs above carry through the same way, only now with
![]() and
and
![]() . So for characterization of the steady state we need to add the labor market clearing condition, and the steady state system will be in
. So for characterization of the steady state we need to add the labor market clearing condition, and the steady state system will be in ![]() . In particular, labor market clearing, combined with
. In particular, labor market clearing, combined with
![]() ,
,
![]() , and
, and
![]() gives:
gives:
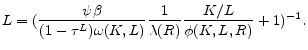 |
Finally, when labor is endogenous and
![]() then:
then:
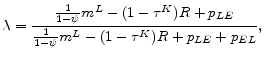 |
and
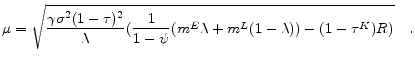 |
Here we need to add two more equations to characterize the steady state, namely the Euler conditions for the marginal propensities to consume. This will be a system of two equations in two unknowns to be solved as a function of steady state prices.43
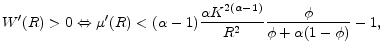 |
which means that the interest rate has to be higher than a given threshold, i.e.
Proof of Proposition 3.4. Let the newborn household receive a weighted average
![]() , where
, where ![]() , upon birth.44 Let
, upon birth.44 Let ![]() be the indicator function, where
be the indicator function, where ![]() for entrepreneurs and
for entrepreneurs and ![]() for laborers. The dynamic system for the state vector
for laborers. The dynamic system for the state vector
![]() , where ,
, where ,
![]() as in the text, is:
as in the text, is:
where
where:
and:
Let
![]() and
and
![]() be the conditional distributions for entrepreneurs and laborers respectively. In steady state the conditional distribution
be the conditional distributions for entrepreneurs and laborers respectively. In steady state the conditional distribution ![]() satisfies the forward Kolmogorov equation:
satisfies the forward Kolmogorov equation:


To that end, let the old state be
and:
Substituting for
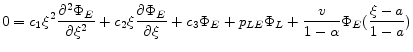
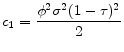
![\displaystyle Y^{\prime }(s)=-\int_{0}^{\infty }e^{-st}ty(t)dt=-L[ty(t)] \Rightarrow L[ty]=-\frac{d}{ds}Y(s) ,](img720.gif)
![\displaystyle Y^{\prime }(s)=-\int_{0}^{\infty }e^{-st}ty(t)dt \Rightarrow Y^{\prime \prime }(s)=\int_{0}^{\infty }e^{-st}t^{2}y(t)dt=L[t^{2}y(t)] .](img721.gif)
![\displaystyle L[ty^{\prime }]=\int_{0}^{\infty }e^{-st}ty^{\prime }dt=-sY^{\prime }(s)-Y(s) ,](img722.gif)
![\displaystyle L[t^{2}y^{\prime \prime }]=\int_{0}^{\infty }e^{-st}t^{2}y^{\prime \prime }dt=s^{2}Y^{\prime \prime }(s)+4sY^{\prime }(s)+2Y(s) .](img723.gif)
Let
![]() ,
,
![]() , and
, and
![]() , then
, then
![]() and
and
![]() . So we have:
. So we have:
![\displaystyle L[y(\frac{t-a}{1-a})]=\int_{k/c}^{\infty }e^{-st}y(ct-k)dt=\frac{1}{c}e^{-s\frac{k}{c}}L[y(t)]_{s\rightarrow s/c}=(1-a)e^{-k(1-a)}L[y(t)]_{s\rightarrow s(1-a)} .](img729.gif)
![\displaystyle L[y(\frac{t-a}{1-a})]=(1-1)e^{-k(1-1)}\int_{0}^{\infty }y(t)dt=0\cdot 1\cdot 1 ,](img730.gif)
After changing variables to ![]() , and defining
, and defining
![]() we get:
we get:
Proof of Corollary 2. Consider the case with ![]() and
and ![]() . Then, using
. Then, using
![]() or
or
![]() and
and
![]() in steady state, using the definition of
in steady state, using the definition of
![]() , and taking the total differential with respect to
, and taking the total differential with respect to ![]() and
and ![]() , gives:
, gives:
 |
which proves that:
References
- Ahsan, S. M. (1974), "Taxation in a Two-Period Temporal Model of Consumption and Portfolio Allocation,"Journal of Public Economics 5, 337-352.
- Aït-Sahalia, Y., Parker, J. A., and M. Yogo (2001), "Luxury Goods and the Equity Premium,"NBER, Working Paper 8417.
- Aiyagari, S. R. (1994), " Uninsured Idiosyncratic Risk and Aggregate Saving,"Quarterly Journal of Economics 109, 659-684.
- Aiyagari, S. R. (1995), "Optimal Capital Income Taxation with Incomplete Markets, Borrowing Constraints, and Constant Discounting,"Journal of Political Economy 103, 1158-1175.
- Alan, S., and M. Browning (2008), " Estimating Intertemporal Allocation Parameters using Synthetic Residual Estimation,"Cambridge and Oxford University mimeo.
- Albanesi, S., and C. Sleet (2005), "Dynamic Optimal Taxation of Productive Assets," 2005 Society for Economic Dynamics Meeting Papers.
- Altig, D., Auerbach, A. J., Kotlikoff, L. J., Smetters, K. A., and J. Walliser (2001), "Simulating Fundamental Tax Reform in the United States," American Economic Review 91, 574-595.
- Alvarez, Y., Burbidge, J., Farrell, T., and L. Palmer (1992), "Optimal Taxation in a Life-Cycle Model,"Canadian Journal of Economics 25, 111-122.
- Angeletos, G.-M. (2007), " Uninsured Idiosyncratic Investment Risk and Aggregate Saving,"Review of Economic Dynamics 10, 1-30.
- Angeletos, G.-M. , and V. Panousi (2009), "Revisiting the Supply-Side Effects of Government Spending,"forthcoming in Journal of Monetary Economics, February.
- Angeletos, G.-M. , and I. Werning (2006), "Pecuniary Externality and Efficiency with Uninsurable Investment Risk,"MIT mimeo.
- Atkeson, A., Chari, V. V., and P. J. Kehoe (1999), "Taxing Capital Income: A Bad Idea ,"Federal Reserve Bank of Minneapolis Quarterly Review 23, 3-17.
- Attanasio, O. P., and G. Weber (1993), "Consumption Growth, Interest Rate, and Aggregation,"Review of Economic Studies 60, 631-649.
- Attanasio, O. P., Banks, J., and S. Tanner (2002), "Asset Holding and Consumption Volatility ,"Journal of Political Economy 110, 771-793.
- Barsky, R. B., Juster, F. T., Kimball, M. S., and M.D. Shapiro (1997), "Preference Parameters and Behavioral Heterogeneity: An Experimental Approach in the Health and Retirement Study," Quarterly Journal of Economics 112, 537-579.
- Benabou, R. (2002), "Tax and Education Policy in a Heterogeneous-Agent Economy: What Levels of Redistribution Maximize Growth and Efficiency,"Econometrica 70, 481-517.
- Bisin, A., and A. Rampini (2008), "A Mirrleesian Theory of Ramsey Taxation,"Working Paper.
- Bustos, A., Engel, E. M. R. A., and A. Galetovic (2004), "Could Higher Taxes Increase the Long-Run Demand for Capital? Theory and Evidence from Chile,"Journal of Development Economics 73, 675-697.
- Cagetti M., and M. De Nardi (2006), " Entrepreneurship, Frictions and Wealth," Journal of Political Economy 114, 835-870.
- Cagetti M., and M. De Nardi (2007), "Estate Taxation, Entrepreneurship, and Wealth,"NBER Working Paper 13160.
- Campbell, J. Y. (1996), "Understanding Risk and Return,"Journal of Political Economy 104, 298-345.
- Campbell, J. Y., Lettau, M., Malkiel, B. G., and Y. Xu (2001), "Have Individual Stocks Become More Volatile? An Empirical Exploration of Idiosyncratic Risk ,"Journal of Finance LVI, 1-41.
- Carroll, C. D. (2000), "Portfolios of the Rich,"NBER Working Paper 7826.
- Chamley C. (1986), "Optimal Taxation of Capital Income in General Equilibrium with Infinite Lives,"Econometrica 54, 607-622.
- Chari, V. V., Christiano, L. J., and P. J. Kehoe (1994), "Optimal Fiscal Policy in a Business Cycle Model,"Journal of Political Economy 102, 617-652.
- Christiano, L. J., and M. Eichenbaum (1992), "Current Real-Business-Cycle Theories and Aggregate Labor Market Fluctuations," American Economic Review 82, 430-450.
- Cohen, A., and L. Einav (2005), "Estimating Risk Preferences from Deductible Choice ," NBER Working Paper 11461.
- Conesa, C., and D. Krueger (2006), "On the Optimal Progressivity of the Income Tax Code,"Journal of Monetary Economics 53, 1425-1450.
- Davila, J., Hong, J. H., Krusell, P., and J.-V. Ríos-Rull (2007), "Constrained Efficiency in the Neoclassical Growth Model with Uninsurable Idiosyncratic Shocks,"Working Paper.
- Davis, S. J., Haltiwanger, J., Jarmin, R., and J. Miranda (2006), "Volatility and Dispersion in Business Growth Rates: Publicly Traded versus Privately Held Firms,"NBER Working Paper 12354.
- Desai, M. A., Dyck, A., and L. Zingales (2007), "Theft and Taxes," Journal of Financial Economics.
- Dohmen, T., Falk, A., Huffman, D., Sunde, U., Schupp, J., and G. G. Wagner (2005), " Individual Risk Attitudes: New Evidence from a Large, Representative, Experimentally-Validated Survey,"IZA Discussion Paper 1730.
- Domeij, D., and J. Heathcote (2004), "On the Distributional Effects of Reducing Capital Taxes,"International Economic Review 45, 523-554.
- Domar, E. D., and A. M. Musgrave (1944), "Proportional Income Taxation and Risk Taking,"Quarterly Journal of Economics 58, 388-422.
- Duffie, D., and L. G. Epstein (1992), " Stochastic Differential Utility," Econometrica 60, 353-394.
- Erosa, A., and M. Gervais (2002), "Optimal Taxation in Life Cycle Economies," Journal of Monetary Economics 105, 338-369.
- Erosa, A., and T. Koreshkova (2007), "Progressive Taxation in a Dynastic Model of Human Capital,"Journal of Monetary Economics 54, 667-685.
- Garriga, C. (2003), "Optimal Fiscal Policy in Overlapping Generations Models,"Working Paper.
- Gentry, W. M., and G. Hubbard (2004), " Entrepreneurship and Household Saving," Advances in Economic Analysis and Policy 4, 1053-1108.
- Golosov, M., Kocherlakota, N, and A. Tsyvinski (2003), "Optimal Indirect and Capital Taxation,"Review of Economic Studies 70, 569-588.
- Guiso, L., and M. Paiella (2005), "The Role of Risk Aversion in Predicting Individual Behavior,"Banks of Italy Working Paper 546.
- Himmelberg, C. P., Hubbard, R. G., and I. Love (2002), "Investor Protection, Ownership, and the Cost of Capital,"Working Paper.
- Jokisch, S. and L. J. Kotlikoff (2006), "Simulating the Dynamic Macroeconomic and Microeconomic Effects of the Fair Tax".
- Judd, K. L. (1985), "Redistributive Taxation in a Simple Perfect Foresight Model," Journal of Public Economics 28, 59-83.
- King, R. G., Plosser, C., and S. Rebelo (1988), "Production, Growth and Business Cycles: I. the Basic Neoclassical Model," Journal of Monetary Economics 21, 195-232.
- Kitao, S. (2007), " Entrepreneurship, Taxation, and Capital Investment,"Review of Economic Dynamics 11, 44-69.
- Li, W. (2002), " Entrepreneurship and Government Subsidies: A General Equilibrium Analysis,"Journal of Economic Dynamics and Control 26, 1815-1844.
- Malloy, C. J., Moskowitz, T. J., and A. Vissing-Jørgensen (2006), "Long Run Stockholder Consumption Risk and Asset Returns," Working Paper.
- Meh, C.A. (2005), " Entrepreneurship, Wealth Inequality, and Taxation,"Review of Economic Dynamics 8, 688-719.
- Moskowitz, T.J., and A. Vissing-Jørgensen (2002), "The Returns to Entrepreneurial Investment: A Private Equity Premium Puzzle?," American Economic Review 92, 745-778.
- Pálsson, A. - M. (1999), "Does the Degree of Relative Risk Aversion Vary with Household Characteristics?," Journal of Economic Psychology 17, 771-787.
- Panousi, V., and D. Papanikolaou (2008), "Investment, Idiosyncratic Risk, and Ownership, "Working Paper.
- Quadrini, V. (2000), " Entrepreneurship, Saving, and Social Mobility," Review of Economic Dynamics 3, 1-40.
- Reiter, M. (2004), "The Optimal Nonlinear Taxation of Capital in Models with Uninsurable Income Risk,"Working Paper.
- Sandmo, A. (1977), " Portfolio Theory, Asset Demand and Taxation: Comparative Statics with Many Assets,"Review of Economic Studies 44, 369-379.
- Stiglitz, J. E. (1969), " The Effect of Income, Wealth, and Capital Gains Taxation on Risk-Taking,"Quarterly Journal of Economics 83, 263-283.
- Uhlig, H., and N. Yanagawa (1996), " Increasing the Capital Income Tax May Lead to Faster Growth,"European Economic Review 40, 1521-1540.
- Vissing-Jørgensen, A., and O. P. Attanasio (2003), "Stock Market Participation, Intertemporal Substitution, and Risk Aversion," American Economic Review 93, 383-391.
- Werning, I. (2007), " Optimal Fiscal Policy with Redistribution," Quarterly Journal of Economics 122, 925-967.