
Does Credit Scoring Produce a Disparate Impact?
Keywords: Credit scoring, discrimination, disparate impact
Abstract:
I. Introduction
As the use of credit scoring has expanded over the past 20 years, concerns have been raised about whether its use may unfairly affect minorities and other populations.1 Some of these concerns have focused on the specific predictive factors, or "credit characteristics," used in the models that generate credit scores and the question of whether the use of individual credit characteristics may have a disparate impact. These concerns about the fairness of credit scoring have lingered without being resolved.
Despite the public policy interest in addressing these questions, research on this topic has been largely nonexistent for two reasons.2 First, credit scoring models are generally proprietary and, as a result, there is little or no information available about the specific credit characteristics that comprise these models. Second, there has been no data available that connects the demographic characteristics of individuals (including race or ethnicity, gender, or national origin) to their credit scores and credit history. The absence of data is partly a result of Federal laws that prohibit the collection of such information as part of non-mortgage credit applications.3
This paper takes advantage of a unique source of data to address the questions that have been raised about whether credit scoring has a disparate impact on minorities and other demographic groups. The data we rely on are based on a nationally representative sample of over 300,000 anonymous credit records that are observed at two points in time, June 2003 and December 2004. This dataset is similar to the data used in constructing and evaluating credit scoring models. These credit records are supplemented by demographic information on each individual from the Social Security Administration and a demographic information company.4 The resulting dataset is the first to combine this information for a nationally representative sample of individuals.
Using these data, we examine the individual predictive factors included in credit scoring models and assess whether including each of these factors in a credit scoring model results in a disparate impact by race or ethnicity, age, or gender. Credit characteristics are included in credit scoring models because they predict future credit performance; however, since these models cannot legally incorporate race or certain other demographic information, the predictiveness of an individual credit characteristic might arise because that characteristic is serving as a proxy for an excluded demographic characteristic. Using race as an example, a credit characteristic might serve as a proxy when (1) race is correlated with performance, and (2) the credit characteristic is correlated with race.5 A credit characteristic that derives its predictiveness solely by functioning as a proxy for demographics would not predict performance in a model that was estimated in a "demographically neutral environment," where demographics are controlled for or where the estimation sample is limited to a single demographic group. Credit characteristics that operate, in whole or in part, as proxies for a demographic characteristic have a "disparate impact" on individuals in that demographic group.
An analysis of the extent to which the credit characteristics that comprise a commercially available credit scoring model result in disparate impact would pose substantial data burdens. First, it would require detailed knowledge of the model being analyzed. This would include, among other things, a listing of the credit characteristics that comprise the model, the functional form in which each characteristic enters the model, and the weights assigned to each included characteristic. Second, such an analysis would require the actual sample that was used to develop the model, with the addition of the race, ethnicity, and gender of each individual in the sample, so that the model could be reestimated in demographically neutral environments. We are unaware of any commercially available credit scoring model for which this type of data is available.
Instead, we rely here on the model-building methodology developed as part of the Federal Reserve Board's Report to the Congress on Credit Scoring and its Effect on the Availability and Affordability of Credit (Board of Governors, 2007). This methodology emulates the process used by industry model builders to develop credit scoring models based exclusively on the information included in the credit records of individuals. The methodology is completely algorithmic which allows the process to be replicated using restricted or supplemented samples, such as those limited to a single demographic group. This allows us to perform two analyses on a baseline model that we develop using the entire sample: reestimation and redevelopment. Reestimation uses the same selection of credit characteristics that were selected for the baseline model to assess how the coefficients on each credit characteristic change when the model is reestimated in demographically neutral environments. Redevelopment replicates the entire model building process, including credit characteristic selection, in demographically neutral environments to evaluate how the selection of credit characteristics is affected. These two analyses allow us to examine the potential for disparate impact to emerge either from the coefficients estimated on each credit characteristic or from the choice of credit characteristics to include in the model.
The results of our analyses provide little or no evidence of disparate impact by race or ethnicity or by gender. Both reestimation and redevelopment of the baseline model in race-neutral and gender-neutral environments result in model coefficients, and consequently credit scores, that are very close to those produced by the baseline model. Additionally, we are unable to identify any credit characteristics whose omission from the model appears to be the result of correlations with these demographic groups.
However, we do find evidence of disparate impact by age. When the baseline model is reestimated or redeveloped in each of three age neutral environments, the scores of younger individuals decline and those of older individuals increase. We are able to trace these score changes to a single credit characteristic representing the average age of the credit accounts on file. The inclusion of this credit characteristic in our scoring model also appears to have an adverse effect on the credit scores of foreign-born individuals, and of recent immigrants in particular.
The remainder of the paper is organized as follows. The next section provides background information on credit record data in general and on the dataset used in this paper. Section III then conducts univariate analyses of the credit characteristics used in constructing our credit scoring model. Section IV discusses the model-building process that we follow and presents the baseline model. Sections V and VI then present the results of our model reestimation and redevelopment. Finally, Section VII presents our conclusions and suggests appropriate policy responses.
II. Background
Concerns about possible discrimination in the credit underwriting process are longstanding. Largely reflecting the availability of data, much of the research in this area has focused on the fairness of access to mortgage credit. The literature in this vein is quite large and varied in nature (Goering and Wienk, 1996; Ross and Yinger, 2002). Much of the research has attempted to replicate in some fashion the information available to underwriters and focus on whether similarly situated minorities have the same outcomes (whether in terms of denials or loan pricing) as nonminorities (Munnell, et al., 1996; Stengel and Glennon, 1999; Black, Boehm, and DeGennaro, 2003; Courchane, 2007). Another approach has been to evaluate the fairness of outcomes by examining loan performance (Berkovec, et al., 1994, 1996, 1998). Building upon the research into the economics of discrimination of Becker (1971), this approach is premised on the notion that biased lenders will require higher expected profits from loans to minority applicants.
A central issue in virtually all of the research in this area is the need to compare lending outcomes of loan applicants in similar financial and related circumstances. One of the most difficult aspects of such endeavours is accounting for possible differences in credit history, sometimes summarized by a credit score. However, little research has focused on the fairness of credit scores themselves.
II.1 Credit Record Data
The data that underlie most generic credit history scoring models come from the files of credit reporting agencies. Each of the three national credit reporting agencies (Equifax, Experian, and TransUnion) maintain records on as many as 1.5 billion credit accounts held by approximately 225 million individuals (Avery, Calem, and Canner, 2003). These credit records contain four types of information.
The first type is "tradeline" information which includes the details provided by creditors (and some other entities such as utility companies) on current and past loans, leases, and non-credit-related bills. This information includes the type of account (closed- or open-ended loan), the purpose of the account (for example, automobile loan, mortgage, student loan), the historical payment performance on the account, and details about other account derogatories (such as whether the account has been charged off or is in collection, is associated with a judgement, bankruptcy, foreclosure, or repossession).
The second type of information comes from monetary-related public records and includes records of bankruptcy filings, liens, judgements, and some foreclosures and lawsuits. The data distinguish (albeit imperfectly) between tax liens and other liens, though (unlike credit account data) the public record data do not provide a classification code for the type of creditor or plaintiff. Although public records include some details about the action, such as the date filed, the information available is much narrower in scope than that available on credit accounts.
Information on non-credit-related bills in collection that are reported by collection agencies constitutes the third type of information. These collection actions most commonly involve unpaid bills for medical or utility services. Collection agency records include only limited details about the action, including the date acquired by the collection agency, the original collection balance, and an indicator of whether the collection has been paid in full. There is no code indicating the type of original creditor or the date the account was opened or first became delinquent.
Finally, the fourth type of information reflects requests for information from an individual's credit record. Each time an individual or company requests information from an individual's credit record, an inquiry record is created. Only inquiries by creditors following an application ("hard" inquiries) are included in credit scoring models; inquiries for account management or solicitation purposes are not considered. The data on inquiries are maintained for two years and record only the type of firm making the inquiry, the date on which it was made, and the purpose of the inquiry.
In addition to these four types of information, credit records also include some personal identifying information, including each person's name, Social Security number, and a list of current and previous addresses. This information was not included in the data supplied to the Federal Reserve. Credit records do not include such personal information as race, ethnicity, or marital status. Age is sometimes included in credit records. The information reported in these files, generally, reflects monthly information received from creditors and others, with the records updated within one to seven days of receiving new information.
II.2 Data
The dataset compiled for this study is based on a nationally representative random sample of 301,536 individuals drawn as of June 30, 2003 from the credit bureau records of TransUnion. The records of these same individuals were also drawn as of December 30, 2004. Some individuals (15,743) in the initial 2003 sample no longer had active credit records as of December 30, 2004, leaving a total of 285,793 individuals with active credit files in both time periods.6
For each of these individuals, the Federal Reserve received the four types of information outlined in the previous section. In addition, TransUnion also provides 312 precalculated "credit characteristics," which contain summary information on each individual's credit record (such as the number of accounts on file or the average age of the accounts of file), for use in model construction.7 These are the credit characteristics that we evaluate in this study and comprise the group we select from in constructing our credit scoring models.
The sample of data also includes two different commercially available credit scores. The first is the TransRisk Account Management Score ("TransRisk score"), which is produced by TransUnion and predicts the likelihood that an individual will become seriously delinquent on at least one existing account during the next 24 months. The second is the VantageScore, produced by VantageScore Solutions, LLC, which predicts the likelihood that the individual will become seriously delinquent on a randomly selected new or existing account over the ensuing 24 months. Both scores were calculated for each of the two sample dates.
Credit scores could not be produced for all individuals in the sample. Individuals who have too few active credit accounts are generally considered "unscoreable," though the exact definition of what constitutes an unscoreable credit record varies across credit scoring models. About 17 percent of individuals in the sample (51,536) were not assigned a TransRisk score and 43,630 sample individuals did not receive a VantageScore. The sample used for most of the analysis here consists of the 232,467 individuals who had both scores.
These credit bureau records were supplemented by additional information on demographic characteristics from the Social Security Administration (SSA) and from a demographic information company that provides such information to creditors and other entities for use in marketing and solicitation activities.8 The SSA gathers demographic information when individuals apply for a Social Security card, including state or country of birth, race or ethnic description, gender, and date of birth.9 Only the race or ethnic description is provided on a voluntary basis. The data from the demographic information company included, to the extent available, details on each individual's race, education, sex, marital status, language preference, occupation, income range and date of birth. To resolve inconsistencies across different data sources for race, ethnicity, sex, and age, the decision was made to rely on the information provided in the official government records maintained by the SSA, unless we had strong reason to believe that the information was incorrect, in which case we deemed it "missing."10
Overall, almost 80 percent of the 301,536 individuals in the sample could be matched to SSA records. This includes 90 percent of individuals with both credit scores as of June 30, 2003, the sample most relevant for this analysis. Age and gender were available for virtually all of the individuals matched to the SSA records. Race or ethnicity was available for almost 97 percent of the individuals matched to the SSA records.
III. Credit Characteristics
For a credit characteristic to be included in a credit scoring model and to operate as a proxy for race or other demographic characteristics, it must be correlated with both performance and some demographic characteristic that is itself correlated with performance. In this section, we explore, in a univariate setting, the potential of each of the 312 credit characteristics to operate as a proxy, by examining the correlation of each credit characteristic with both performance and demographics.
Correlation coefficients for many credit characteristics could not be calculated because the characteristic took on "non-applicable" values. Often, these non-applicable values provide a significant portion of the characteristic's predictive power. For example, credit characteristic AT36, "total number of months since most recent account delinquency," takes on non-applicable values for individuals who have never been delinquent and this identification of the population that has never been delinquent has substantial predictive power for future delinquency. Instead, our approach is to estimate regressions of the form
The dependent variable, ![]() , reflects either performance or demographics. For performance,
, reflects either performance or demographics. For performance, ![]() is an indicator variable that equals 1 if the individual had bad performance and zero otherwise. For demographics, the dependent variable can be continuous (in the case of age) or an indicator variable reflecting membership in a particular demographic group (for example, gender).
Two right-hand-side variables are used to reflect the values of the credit characteristic. The first,
is an indicator variable that equals 1 if the individual had bad performance and zero otherwise. For demographics, the dependent variable can be continuous (in the case of age) or an indicator variable reflecting membership in a particular demographic group (for example, gender).
Two right-hand-side variables are used to reflect the values of the credit characteristic. The first, ![]()
, is a variable that indicates whether the value for credit characteristic ![]() is "not applicable." This variable is omitted from estimations that involve credit characteristics whose values
are always calculable. The second,
is "not applicable." This variable is omitted from estimations that involve credit characteristics whose values
are always calculable. The second, ![]() , is a continuous variable that equals the value of characteristic
, is a continuous variable that equals the value of characteristic ![]() , or zero if the value is not applicable. The square root of the R-squared statistic from these regressions is used as the measure of correlation between each characteristic and performance or demographics.
, or zero if the value is not applicable. The square root of the R-squared statistic from these regressions is used as the measure of correlation between each characteristic and performance or demographics.
In addition to the continuous dependent variable used for age, indicator variables are used to reflect demographics including race or ethnicity, gender, marital status, and whether the person was foreign born or a recent immigrant. Our definition of a recent immigrant is a person who is 30 or more years old and who applied for a Social Security card in the 10 years before the 2003 sample was drawn (which is a crude measure of when the person emigrated to the United States). We focus on this population because these individuals may have credit records that make them appear younger than their age and, consequently, they may be affected by credit characteristics that proxy for age. In estimations involving these demographic indicator variables, the regressions were run using only observations of individuals from that demographic group and from an appropriate base or comparison group. For example, the regression for black individuals was estimated using observations representing black individuals or non-Hispanic whites, which is the base group used for race.
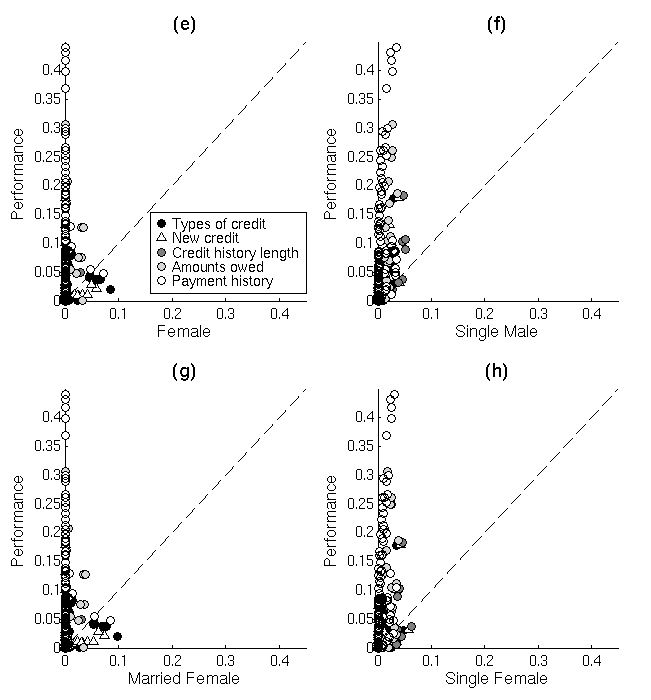
The correlation measures for different demographic categories are shown in figure 1. Each panel shows, for each of the 312 credit characteristics, the correlation with performance on the y-axis and demographics on the x-axis. Points that are located farthest from both axes are those that are highly correlated with both performance and demographics and have the greatest potential to serve as proxies.
For most demographic characteristics, most notably those related to race or ethnicity, each credit characteristic's correlation with the demographic characteristic is lower than the correlation with performance. While several credit characteristics are highly correlated with performance, few have correlations with demographics that exceed 0.05 and even fewer have correlations approaching 0.1. The exceptions, however, are notable. Some credit characteristics reflecting past payment history are correlated with the black indicator variables, the only racial or ethnic characteristic that is correlated with credit characteristics at levels approaching 0.1. A second notable exception is the credit characteristics that are more highly correlated with being female (as observed in the estimations involving all females, single females, and married females) than with performance. While these credit characteristics are drawn from different groups, in each case they are characteristics that are associated with retail store tradelines.
The most significant exception is age. Not only are several credit characteristics more correlated with age than with credit performance, but in some cases the correlations with age are as high as 0.4, which is higher than any observed correlations with performance. All of the credit characteristics that have correlations with age exceeding 0.2 reflect the length of credit history. There are also, however, characteristics from the groups "new credit" and "amounts owed" that are correlated with age at levels in excess of 0.1.
These univariate results suggest that there are some credit characteristics that have correlations with both performance and demographics that are non-negligible and, consequently, have the potential to serve as proxies for demographic characteristics. These results also identify some demographic groups (blacks, females, and unspecified age groups) that are the most likely to be subject to disparate impact from the inclusion of credit characteristics that serve as proxies. By themselves, however, these results do not necessarily demonstrate the existence of such impact. Credit characteristics that are highly correlated with demographics may not be sufficiently correlated with performance to justify their inclusion in the model, or their correlation with demographics may be substantially reduced in a multivariate setting. To examine the extent to which credit characteristics that are likely to be included in credit scoring models result in disparate impact in the type of multivariate setting provided by these models, we develop a credit scoring model referred to here as the "baseline model."
IV.1 Model Building Methodology
In this section, we present the credit scoring model used in this paper. The model-building methodology uses an algorithm that mirrors, to the extent possible, the development process used by industry model builders (Board of Governors, 2007). An algorithmic approach has the advantage that the rules governing the process are spelled out in precise detail and can be exactly replicated using different samples. However, this approach has the disadvantage of being devoid of any aspects of credit scoring "art" that could not be reduced to simple algorithmic procedures. While the algorithm does not resemble the process used by any individual model builder exactly, we believe, based on conversations with industry modellers and a review of the available literature, that it is a fair representation of industry practice as a whole regarding the model construction.
The first step in the development process is to select the outcome to be predicted. Our model predicts an individual's worst performance on an account during the 18-month performance period between our two samples (June 2003 and December 2004). We evaluate performance on new and existing accounts, meaning those accounts that were either opened during the first six months of the performance period (July to December 2003) or were open at the beginning of the performance period.
An individual's worst performance is classified based on the performance on her accounts. If she was 90 or more days past due during the performance period on a new or existing account, then she exhibited "bad" performance. If she was never past due during the performance period (beyond an isolated 30-day delinquency) and had at least one account with on-time payments, then she exhibited "good" performance. Otherwise, her performance was "indeterminate" (generally, these were individuals whose worst performance 60 days past due). Following industry practice, those individuals with indeterminate performance are not used in the estimation sample, though they are used in the rest of the analysis.
The next step in the model-building process is to decide which credit characteristics will be considered for possible inclusion in the model. The credit characteristics used in model development fall into five broad areas: payment history, amounts owed, length of credit history, types of credit in use, and acquisition of new credit. All five of these areas are represented in the 312 credit characteristics that TransUnion supplies for model-building purposes. We use these credit characteristics as the pool from which we select characteristics for our model.
Although a generic credit history score can be estimated using a single equation, estimation samples are generally divided into distinct subpopulations or "scorecards." Since we are using a smaller sample size than is commonly used by industry model builders, we restrict ourselves to three scorecards. While not empirically derived, these scorecards were selected to represent the major population segmentations used in scorecard development. The first scorecard, the "thin" scorecard, contains those individuals with two or fewer tradelines. Individuals with more than two tradelines are placed on the "dirty" scorecard if they have had one or more 90-day delinquency, a public record, or a collection account of more than $50. Otherwise, individuals with more than two tradelines are placed on the "clean" scorecard.11 The process of creating attributes, selecting credit characteristics, and estimating models is then conducted separately for each of the three scorecards.
Following industry practice, credit characteristics enter a model as a series of dummy variables, called "attributes." An attribute reflects a specific range of values, with the attribute assigned a value of 1 if the value of characteristic falls within the specified range and zero otherwise. The attributes partition the space of possible values, so that a single attribute is assigned a value of 1 and the others equal zero.
Attributes are created for each of the 312 credit characteristics, with a separate set of attributes created for each scorecard. The first step in attribute creation is to determine whether the credit characteristic can include non-applicable values, which arise when the value of a credit characteristic cannot be calculated. For example, the credit characteristic "total number of months since the most recent account delinquency" cannot be calculated for individuals who have never had a delinquency. For those characteristics where a non-applicable value is possible, an attribute is created to reflect non-applicable values. For credit characteristics where non-applicable values are not possible, such as the "total number of mortgage accounts" (which takes on a value of zero for individuals who have never had a mortgage) attributes for non-applicable data are irrelevant and are not included.
Once the attributes corresponding to non-applicable values are created (if necessary), the range of remaining values for each credit characteristic is partitioned into a series of one or more attributes. This process begins by creating a single attribute that covers all of the remaining values of the credit characteristic. Then, each possible subdivision of this attribute into two candidate attributes, each covering a compact set of sequential values, is evaluated.12 The subdivision that results in the smallest sum of squared residuals is selected. If the difference in mean performance between the two candidate attributes is statistically significant at the 5 percent level then the two candidate attributes replace the single attribute.
The process then examines each of the attributes of a credit characteristic in basically the same manner. Each attribute is subdivided into the best two candidate attributes. At this stage, to be considered a set of candidate attributes, a subdivision has to result in two attributes that would maintain the monotonicity of mean performance levels across all of the attributes of a credit characteristic. Subdivisions that do not maintain this monotonicity are not considered candidate attributes. The two candidate attributes that best predict performance then replace the attribute under examination if the difference in mean performance between the two candidate attributes is statistically significant at the 5 percent level. This process is repeated until no additional statistically significant and monotonicity-preserving subdivisions are possible. The number of attributes created for each credit characteristic varies from one (for those characteristics with no non-applicable values and no statistically significant subdivisions) to 21.
The next step in the process is to select the credit characteristics that appear on each of the three scorecards. When a credit characteristic is included in a model, all of its attributes are included, with the exception of the attribute representing the lowest values for that characteristic, which is the omitted category. Following standard model-building practice, we estimate a logit model subject to the constraint that the coefficients across the attributes of each credit characteristic must be monotonic (with the exception of the coefficient on the attribute for non-applicable values).13
Credit characteristics are added to the model in a forward-stepwise manner, in which the credit characteristic that produces the largest increase in the divergence statistic is chosen. Characteristics are added until the marginal increase in the divergence statistic that results when the characteristic is added to the model falls below 0.75 percent. This threshold was chosen to ensure that each scorecard contained approximately 10 to 15 credit characteristics, the number typically found on industry scorecards.
Once the stepwise process is complete, each characteristic is again evaluated to ensure that its marginal contribution to the divergence statistic continues to exceed the threshold. This is done by removing each of the ![]() credit characteristics that comprise a scorecard, calculating the divergence statistic based on a model that includes only the remaining
credit characteristics that comprise a scorecard, calculating the divergence statistic based on a model that includes only the remaining ![]() characteristics, and
calculating the increase in the divergence statistic that results when the characteristic is included. Any credit characteristic whose marginal contribution to the divergence statistic is below the threshold is removed from the model. If a characteristic is removed, then the algorithm again
evaluates all of the remaining characteristics for inclusion.
characteristics, and
calculating the increase in the divergence statistic that results when the characteristic is included. Any credit characteristic whose marginal contribution to the divergence statistic is below the threshold is removed from the model. If a characteristic is removed, then the algorithm again
evaluates all of the remaining characteristics for inclusion.
The process of removing and adding credit characteristics continues until (a) each of the credit characteristics included in the model contributes to the divergence statistic a percentage increase on the margin that exceeds the threshold; and (b) none of the excluded credit characteristics would improve the divergence statistic by a percentage that exceeds the threshold if included in the model. Once these two conditions are met, the credit characteristics that comprise the model for the scorecard being constructed are set. This process is repeated for all three scorecards.
The final step in the model-building process involves normalizing the score to a rank-order scale. Fitted values are calculated for each individual in our full sample (including those individuals who had indeterminate performance and were not included in the estimation sample). Based on these fitted values, individuals are ranked and receive a score between 0 and 100 that reflects the percentile of the distribution into which the individual falls. As a result, five percent of individuals have a score of 5 or less and 50 percent have a score of 50 or less. Normalizing all of the credit scores in the sample to the same rank-order scale allows for a straightforward comparison of the different models being examined.
IV.2 Specification and Comparison with Commercial Scores
A full description of the baseline model is provided in panels (A) through (C) of table 1. This table provides a complete list of attributes and weights for each credit characteristic on the three scorecards. A baseline score is calculated for each individual by calculating the fitted value for
each individual (using the equation
![]() , where
, where ![]() is the sum of the weights for each credit characteristic) and
then normalizing this fitted value using the function depicted in figure 2. This normalized score is what we refer to as the baseline score.
is the sum of the weights for each credit characteristic) and
then normalizing this fitted value using the function depicted in figure 2. This normalized score is what we refer to as the baseline score.
A primary concern about evaluating the baseline model is that it may not closely resemble models used by industry. To evaluate how closely the baseline scores compare to scores from commercially available scores, we compare score distributions for different demographic groups generated by the baseline model with the distributions for the TransRisk score and the VantageScore. Both commercial scores are normalized to the same rank-order scale described earlier (so the distributions of each score for the entire population is approximately identical) to facilitate these comparisons.
As seen in table 2, distributions of each of the three scores are very similar for each demographic group. Mean and median baseline credit scores are generally within 2 points of the commercial scores. Unfortunately, comparisons of the distributions of two different credit scores for the same population of individuals are not amenable to standard statistical tests so we are unable to report statistical significance levels.14 Nevertheless, the similarities between the baseline scores and the TransRisk and VantageScores suggest that the baseline model is capturing most of the difference observed in credit scores across demographic groups.
IV.3 Credit Characteristics and Score Differences Across Demographic Groups
Baseline scores, as well as the two commercially available scores for the sample population, indicate that there are substantial differences across demographic groups. In this section, we examine how the score differences are affected by the inclusion of specific credit characteristics in the baseline model. For each characteristic in the baseline model, we estimate a revised model that excludes that characteristic. We then compare scores from these revised models (which are normalized to a rank-order scale) with the baseline scores. When a credit characteristic appears on more than one scorecard, a separate revised model is calculated for each scorecard (so that the credit characteristic is removed from one scorecard but left on the others). This process helps to identify which characteristics have large impacts on score differences of different demographic groups as a result of their inclusion in the model.
Table 3 provides a definition of the four-character names of each of the credit characteristics that appear in the baseline model or are used elsewhere in this study and table 4 shows the mean and median score changes, by demographic group, that result from the omission of each credit characteristic from the baseline model. Score changes are for the individuals in each demographic group whose records place them on the scorecard from which the characteristic was dropped. Very few of the credit characteristics in the baseline model, on the margin, have a substantial effect (either positive or negative) on the credit scores of any demographic group. This is particularly true for score differences across race or ethnicity, gender, and marital status, where score differences generally change by 1 point or less and almost none are changed by more than two points.
A number of credit characteristics, when excluded from the baseline model, alter the relative credit scores of different age groups by more than two points. These include four characteristics on the thin scorecard (![]() , AT34, AT28, and RE20) and characteristic
, AT34, AT28, and RE20) and characteristic ![]() on both the clean and
dirty scorecards. The finding that some credit characteristics have substantial effects on scores by age, but not by race or gender, is consistent with our earlier univariate finding of higher correlations of credit characteristics with age than with other demographic characteristics. The credit
characteristics whose exclusion altered score differences across age groups also appear to have had relatively large effects on the scores of the foreign born and, in particular, recent immigrants.
on both the clean and
dirty scorecards. The finding that some credit characteristics have substantial effects on scores by age, but not by race or gender, is consistent with our earlier univariate finding of higher correlations of credit characteristics with age than with other demographic characteristics. The credit
characteristics whose exclusion altered score differences across age groups also appear to have had relatively large effects on the scores of the foreign born and, in particular, recent immigrants.
V. Reestimating the Baseline Model in Demographically Neutral Environments
As discussed earlier, the coefficients on attributes of a credit characteristic that is functioning as a proxy for membership in a particular demographic group will change when estimated in a demographically neutral environment. In the extreme case where a credit characteristic is operating solely as a proxy for membership in a demographic group, the coefficients on the attributes of that characteristic will be close to zero when the model is estimated in an environment that is neutral with respect that demographic group. In other cases, where the credit characteristic operates as a demographic proxy but also has predictive power within each demographic group, the coefficients estimated for attributes of that characteristic may either increase or decrease in a demographically neutral environment, depending upon the relationship among the credit characteristic, demographics, and performance. In this section, we reestimate the baseline model in the eight different demographically neutral environments listed in table 5 to examine whether the credit characteristics included in the baseline model are causing disparate impact for members of a variety of demographic groups.
When reestimating the baseline model in these environments, we use the same credit characteristics and attributes as in the baseline model and continue to impose monotonicity across attribute coefficients. Fitted values for each individual in the sample are then calculated as though everyone was part of the same demographic group (i.e., everyone is the same age, gender, or race or ethnicity) and normalized to a rank-order scale using the full sample population of 232,467 individuals.15
We use the reestimated models to explore for the existence of disparate impact using a two-part process. First, we compare the baseline credit scores to the scores generated by the models reestimated in the demographically neutral environments. If a credit characteristic is operating as a proxy for membership in a demographic group, the credit scores of individuals who are benefited (harmed) by the proxy should fall (rise) in an environment that is neutral with regards to that demographic group. For example, if a credit characteristic in the baseline model is proxying for race in a manner that adversely affects blacks, we would expect the scores of blacks to increase when the model is reestimated in a race-neutral environment. In the second part of the process, for those demographic groups whose scores change significantly when the baseline model is reestimated in a demographically neutral environment, we trace any score differences to the credit characteristics that generate them. This is done by comparing the coefficients on each attribute in the baseline model with the coefficients from the reestimated models. This process allows us to identify any credit characteristic whose inclusion in the baseline model results in a disparate impact on any of the demographic groups examined.
The score changes are shown in table 6 for each demographically neutral environment for select demographic groups associated with that environment. Changes in the mean scores associated with reestimations in each race-neutral and gender-neutral environment were uniformly very small, in each case being under 0.2, the smallest increment allowed under the normalization. Changes in the median scores were 0.2 or zero for each demographic group listed, except for American Indians where the sample size is very small. This suggests that credit characteristics in the baseline model are unlikely to be operating as proxies for race, ethnicity, or gender.
In contrast, in each of the three age-neutral environments, reestimation results in lower mean scores for younger individuals and higher mean scores for older individuals than were produced by the baseline model. This pattern is consistent with what one would expect to observe if a credit characteristic was operating in whole or in part as a proxy for age. Additionally, the change in mean scores for foreign-born individuals, and for recent immigrants in particular, are uniformly lower when the baseline model is reestimated in age-neutral environments. This finding is also consistent with the presence of an age-proxy, as these individuals have been in the county for a shorter period of time than native-born individuals and are likely to have credit profiles (as reflected in the bureau data) that are similar to younger individuals in that they tend to have shorter credit histories.
To examine which credit characteristic is the cause of these differences, mean score changes resulting from the reestimation of the baseline model in age neutral environments were decomposed by scorecard. This decomposition indicates that the change in relative credit scores by age and
immigration status can be traced to changes on the clean scorecard. While the attribute coefficients for most characteristics on this scorecard are of relatively similar magnitudes in the baseline and age-neutral models, ![]() ("average age of accounts on credit report") stands out as the source of the relative score differences by age group and immigration status. Table 7 provides the coefficients on each attribute of
("average age of accounts on credit report") stands out as the source of the relative score differences by age group and immigration status. Table 7 provides the coefficients on each attribute of ![]() from the clean scorecard for the baseline model and for each of the demographically neutral models, along with the distribution of individuals on the clean scorecard across the different attributes. The differential in the coefficients on the lower
and higher attributes of
from the clean scorecard for the baseline model and for each of the demographically neutral models, along with the distribution of individuals on the clean scorecard across the different attributes. The differential in the coefficients on the lower
and higher attributes of ![]() is greater in the age neutral models than the differential in coefficients in the baseline model. For example, the difference in the value of the coefficients on
the modal attribute for the 30 and under population and the coefficient on the modal attribute for the 62 and older population is approximately 0.97 for each of the three age neutral models. This is substantially higher than the 0.72 difference between these coefficients in the baseline model. It
is this widening difference in the value of the coefficients on the attributes of
is greater in the age neutral models than the differential in coefficients in the baseline model. For example, the difference in the value of the coefficients on
the modal attribute for the 30 and under population and the coefficient on the modal attribute for the 62 and older population is approximately 0.97 for each of the three age neutral models. This is substantially higher than the 0.72 difference between these coefficients in the baseline model. It
is this widening difference in the value of the coefficients on the attributes of ![]() that results in the widening credit score difference across age groups when the models are reestimated in
each of the three age neutral environments.
that results in the widening credit score difference across age groups when the models are reestimated in
each of the three age neutral environments.
This result suggests that the inclusion of this credit characteristic on the clean scorecard has a disparate impact by age. Our results show that when the baseline model is reestimated in an age neutral environment the predictiveness of ![]() increases, so that score differences between individuals with high and low values of this credit characteristic widen. This implies that the baseline credit scores of older individuals
are too low and the credit scores of younger individuals are too high as a result of this credit characteristic proxying for age.
increases, so that score differences between individuals with high and low values of this credit characteristic widen. This implies that the baseline credit scores of older individuals
are too low and the credit scores of younger individuals are too high as a result of this credit characteristic proxying for age.
The method in which disparate impact arises from this credit characteristic is counterintuitive. Given the positive correlations among age, ![]() , and performance, one would expect the
relationship between
, and performance, one would expect the
relationship between ![]() and performance to become stronger as a result of this characteristic proxying for age. As a result, the coefficients on
and performance to become stronger as a result of this characteristic proxying for age. As a result, the coefficients on ![]() in the baseline model would be larger than those in the age-neutral models and the scores of the old (young) would be lower (higher) in the age-neutral models. Instead, we observe the opposite result: Credit scores of the old are
higher in the age-neutral models and the relationship between
in the baseline model would be larger than those in the age-neutral models and the scores of the old (young) would be lower (higher) in the age-neutral models. Instead, we observe the opposite result: Credit scores of the old are
higher in the age-neutral models and the relationship between ![]() and performance is dampened as a result of
and performance is dampened as a result of ![]() proxying for age. The reason for this counterintuitive result is that
proxying for age. The reason for this counterintuitive result is that ![]() is more predictive of future performance between individuals of the same age than
it is for individuals of different ages. As a result, in models estimated in environments that are not age-neutral, which would include most credit scoring models, we expect the relationship between length of credit history and performance to be weakened because of credit history variables proxying
for age. This suggests that the use of this credit characteristic,
is more predictive of future performance between individuals of the same age than
it is for individuals of different ages. As a result, in models estimated in environments that are not age-neutral, which would include most credit scoring models, we expect the relationship between length of credit history and performance to be weakened because of credit history variables proxying
for age. This suggests that the use of this credit characteristic, ![]() , has a disparate impact by age that negatively affects older individuals and positively affects younger individuals.
, has a disparate impact by age that negatively affects older individuals and positively affects younger individuals.
VI. Redeveloping Models in Demographically Neutral Environments
Reestimating the baseline model in demographically neutral environments is useful in examining the potential of the credit characteristics selected for the baseline model to have a disparate impact on different populations. However, that approach holds constant the credit characteristics (and attributes) that comprised the model and does not evaluate the potential disparate impact that could emerge because of the selection of characteristics included in the model. In particular, it is possible that some of the credit characteristics that were not selected for the credit scoring model were omitted because the strength of the relationship between the characteristic and performance was dampened because the characteristic was proxying for demographics. If the model development process had been conducted in a demographically neutral environment, such characteristics would have been selected and the scores of different demographic groups may have been altered.
Because our method of creating attributes and selecting credit characteristics is algorithmic, we can re-run the model development process in the eight demographically neutral environments. We can then use these redeveloped models in a two-part analysis that is similar to that conducted for the reestimated models in the previous section. In the first part, we compare the credit characteristics that are selected for inclusion in each of the redeveloped models with the characteristics that were selected for the baseline model. Any credit characteristics that were omitted from the baseline model because the model was proxying for demographics, should appear in the models that are redeveloped in a demographically neutral environment. The second part of the analysis then examines how the model redevelopment affects the credit scores of different demographic groups.
Table 8 presents the credit characteristics that comprise each scorecard of the models that were redeveloped in the eight demographically neutral environments. The characteristics selected for each model are somewhat different than those selected for the baseline model. The extent to which the selection of baseline characteristics is similar to the characteristics in the redeveloped models appears to differ somewhat by scorecard, with more similarity on the thin and dirty scorecards than on the clean scorecard.
The differences in the characteristics that have been selected reveal few credit characteristics that appear to have been systematically excluded as a result of the characteristic proxying for demographics. Credit characteristics whose predictiveness is muted as a result of correlations with demographics would have enhanced predictive power in all of the environments that are neutral with respect to that demographic characteristic. As a result, these characteristics would be more likely to be included in each of the models that are redeveloped in those environments. There are very few credit characteristics where this appears to be the case.
The models that have been redeveloped in race-neutral environments fail to identify any credit characteristics that are being excluded as a result of correlations with race or ethnicity. There are two credit characteristics that are added to the models redeveloped in race neutral environments:
AT34 ("Percentage of total remaining balance to total maximum credit for all open accounts reported in the past 12 months") on the clean scorecard and ![]() ("Number of accounts that have payments that are currently or previously 30 or more days past due within the past 18 months") on the dirty scorecard. However, these two credit characteristics are sufficiently similar to credit characteristics that are included in the baseline model, but excluded
in the race-neutral models, to suggest that the difference results from random variation from using different samples or additional demographic control variables. In particular, AT34 appears a close replacement for RE34 ("Percentage of total
remaining balance to total maximum credit for all open revolving accounts reported in the past 12 months") and
("Number of accounts that have payments that are currently or previously 30 or more days past due within the past 18 months") on the dirty scorecard. However, these two credit characteristics are sufficiently similar to credit characteristics that are included in the baseline model, but excluded
in the race-neutral models, to suggest that the difference results from random variation from using different samples or additional demographic control variables. In particular, AT34 appears a close replacement for RE34 ("Percentage of total
remaining balance to total maximum credit for all open revolving accounts reported in the past 12 months") and ![]() and a close replacement for
and a close replacement for ![]() ("Number of accounts that have payments that are currently or previously 30 or more days past due in the past 12 months.").
("Number of accounts that have payments that are currently or previously 30 or more days past due in the past 12 months.").
A very similar result can be found in the selection of credit characteristics for models redeveloped in the age-neutral environments. Only one credit characteristic was excluded from a scorecard of the baseline model and subsequently appeared on that scorecard in each of the models redeveloped in age-neutral environments. That credit characteristic is RE34 on the thin scorecard, which, as with the race-neutral result, appears to be a close substitute for credit characteristic AT34. Otherwise, there appears to be little evidence of a credit characteristics being excluded from the baseline model as a result of correlations with age.
The models that were redeveloped in gender-neutral environments reveal one credit characteristic, G096 ("Total number of inquiries for credit"), that is not included in the dirty scorecard of the baseline model, but that appears on that scorecard in each of the redeveloped gender-neutral models. Unlike the credit characteristics in the redeveloped race-neutral models, this credit characteristic does not appear to be substituting for a very similar credit characteristic in the baseline model. Consequently, this credit characteristic may result in some disparate impact.
To evaluate how these different models affect the scores of individuals in different demographic groups, we evaluate how mean and median scores are changed, relatively to the baseline model, in each of the demographically neutral models. These score changes are provided in table 9. As that table shows, there is very little evidence of the type of consistent, substantial score changes in any of the race- or gender-neutral models that would be indicative of disparate impact. To the extent that these models were constructed using somewhat different credit characteristics, there is no evidence that these differences had any meaningful impact on the credit scores of any race, ethnicity, or gender group.
Again, however, there are consistent changes in the scores across age groups for models estimated in each of the age neutral environments. The score changes are similar to those found in the previous section when the baseline model was reestimated in age neutral environments. Since the credit
characteristics that appear to have given rise to those differences (specifically ![]() remain in the models estimated in these environments, and since there appears to be little evidence of
credit characteristics that were inappropriately excluded from the model as a result of their correlation with age, we surmise that these score differences reflect disparate impact arising from the credit characteristics identified in the previous section. Overall, there appears to be little
evidence that the differences in credit characteristic selection had much, if any, disparate impact by age.
remain in the models estimated in these environments, and since there appears to be little evidence of
credit characteristics that were inappropriately excluded from the model as a result of their correlation with age, we surmise that these score differences reflect disparate impact arising from the credit characteristics identified in the previous section. Overall, there appears to be little
evidence that the differences in credit characteristic selection had much, if any, disparate impact by age.
VII. Conclusions
This paper explores the potential for specific credit characteristics included in generic credit history scoring models to have disparate impacts on certain demographic groups, most notably minorities. A credit characteristic can have a disparate impact (either positive or negative) on members of a given demographic group if the predictiveness of that credit characteristic derives, in whole or in part, from its functioning as a proxy for membership in that demographic group.
Our results provide little or no evidence that the credit characteristics used in credit history scoring models operate as proxies for race or ethnicity. The distributions of credit scores for different racial or ethnic groups or across genders are essentially unaffected by the reestimation or
redevelopment of the baseline credit scoring model in any of the race- or gender-neutral environments. This suggests that credit scores do not have a disparate impact across race, ethnicity, or gender. We do, however, find some evidence that credit characteristics associated with the length of an
individual's credit history (specifically, credit characteristic ![]() , "Average age of accounts on credit report") may have a disparate impact by age. In particular, we find that the
predictiveness of this credit characteristic increases when the credit scoring model is estimated in an age neutral environment. This suggests that the predictiveness of this credit characteristic is dampened as a result of its proxying for age and that, consequently, the credit scores of older
(younger) individuals are lower (higher) than they should be.
, "Average age of accounts on credit report") may have a disparate impact by age. In particular, we find that the
predictiveness of this credit characteristic increases when the credit scoring model is estimated in an age neutral environment. This suggests that the predictiveness of this credit characteristic is dampened as a result of its proxying for age and that, consequently, the credit scores of older
(younger) individuals are lower (higher) than they should be.
This finding raises questions about what the appropriate public policy response should be. There are two primary courses of action to correct this disparate impact. The first is to require that credit score modellers estimate their credit scoring models in demographically neutral (specifically
age neutral environments). While this would effectively eliminate the disparate impact associated with this and any other credit characteristics, the type of demographic data used in this study is not generally available to credit score model builders and consequently, while this might be our
preferred remedy, this is not a feasible response. The second course of action is to prohibit the use of this credit characteristic in credit scoring models. The downside of this approach is that ![]() has substantial predictive power, particularly in demographically neutral environments, and showed up as a highly predictive variable in each of the redeveloped scoring models. Banning the use of this credit characteristic in credit scoring models, therefore, would pose a large
cost in reduced model predictiveness.
has substantial predictive power, particularly in demographically neutral environments, and showed up as a highly predictive variable in each of the redeveloped scoring models. Banning the use of this credit characteristic in credit scoring models, therefore, would pose a large
cost in reduced model predictiveness.
Instead of these courses of action, we believe that the size of the disparate impact detected in this study is sufficiently small as to make inaction the preferred option. The disparate impact found lowered the scores of the elderly (who generally have very high credit scores) and raised the scores of the young (who generally have very low credit scores) only slightly. Consequently, the economic size of the harm caused by this disparate impact is unlikely to make either of the two potential remedies attractive.
Our results also indicate that credit characteristics associated with length of credit history may have an inappropriately adverse effect on foreign born individuals, in particular on recent immigrants. Because they were not born in the United States, these individuals have relatively short credit histories as reflected in their U.S. credit reports (presumably they may have had credit experience in their native countries, though this is not reflected in U.S. credit bureau files); such reports are consistent with those of younger individuals. Our result suggests that the credit scores of the foreign born population benefits to the extent that the coefficients in the baseline model are dampened as a result of disparate impact. Nevertheless, the fact that this population has shorter credit histories reflected in U.S. credit bureau records appears to result in lower scores for these individuals. This contributes to the tendency of this population to perform better on credit obligations, on average, than other native-born individuals with identical credit scores (Board of Governors, 2007). While this result is not related to the disparate impact we find by age, it does reflect that this specific characteristic is unfairly disadvantaging this population.
Unlike the disparate impact by age, there may be public policy options that reduce or eliminate this effect. For example, public policy might encourage or facilitate the gathering of information on the credit histories of recent immigrants from their native countries. This information can supplement the information provided in U.S. credit bureau records and may more accurately and completely reflect the credit histories of these individuals. Additionally, ongoing industry efforts to collect additional information on the use of non-traditional sources of credit (such as payday lending and pawn shops) or utility payments may broaden the information included in credit records and may serve to lengthen the period over which the foreign born have a credit record. Public policy efforts in these areas may reduce the disadvantage incurred by the foreign born, particularly recent immigrants, as a result of the use of credit characteristics related to length of credit history.
The conclusions in this paper are drawn from an analysis that has important limitations. Perhaps the most important is that the analysis is based upon a credit history scoring model that was developed specifically for this study and not upon a commercially available score. While the methodology attempts to emulate the process used by industry model builders, there is no standardized procedure in the industry so our methodology is approximate. Additionally, the sample size used in this study to estimate the model was substantially smaller than the sizes generally used to estimate commercial credit scoring models. As a result, our model was forced to utilize a smaller number of scorecards than would have been ideal and consequently may have missed possible disparate impact faced by small subsets of the population. Despite these limitations, we believe that the results of our analysis are generally applicable to most credit history scoring models that rely on credit bureau data.
References
Avery, Robert B., Raphael W. Bostic, Paul S. Calem and Glenn B. Canner, 1996, "Credit Risk, Credit Scoring, and the Performance of Home Mortgages," Federal Reserve Bulletin, vol. 82, July, pp. 621-48.
Avery, Robert B., Paul S. Calem, and Glenn B. Canner, 2003, "An Overview of Consumer Data and Credit Reporting," Federal Reserve Bulletin, 89, February, pp. 47-73.
Berkovec, James A., Glenn B. Canner, Stuart A. Gabriel, and Timothy H. Hannan, 1994, "Race, Redlining, and Residential Mortgage Loan Performance," Journal of Real Estate Finance and Economics, 9(3), pp. 263-94.
__________, 1996, "Mortgage Discrimination and FHA Loan Performance," Cityscape, 2(1), pp. 9-24.
__________, 1998, "Discrimination, Competition, and Loan Performance in FHA Mortgage Lending," Review of Economics and Statistics, 80(2), pp. 241-50.
Black, Harold A., Thomas P. Boehm, and Ramon P. DeGennaro, 2003, "Is There Discrimination in Mortgage Pricing? The Case of Overages." Journal of Banking and Finance, 27(6), pp. 1139-65.
Chandler, Gary, 1985, "Credit Scoring: A Feasibility Study," Credit Union Exec, 25, pp. 8-12.
Collins, M. Cary, Keith D. Harvey, and Peter J. Nigro, 2002, "The Influence of Bureau Scores, Customized Scores and Judgemental Review on the Bank Underwriting Decision Making Process," Journal of Real Estate Research, 24(2), pp. 129-52.
Courchane, Marsha J., 2007, "The Pricing of Home Mortgage Loans to Minority Borrowers: How Much of the APR Differential Can We Explain?" Journal of Real Estate Research, 29(4), pp. 399-439.
Elliehausen, Gregory E. and Thomas A. Durkin, 1989, "Theory and Evidence of the Impact of Equal Credit Opportunity: An Agnostic Review of the Literature," Journal of Financial Services Research, 2 (2), pp. 89-114.
Fortowsky, Elaine and Michael LaCour-Little, 2001, "Credit Scoring and Disparate Impact," Working paper.
Goering, John and Ron Wienk, eds., 1996, Mortgage Lending, Racial Discrimination, and Federal Policy (Washington, D.C.: Urban Institute Press).
Hand, David J. and Niall M. Adams, 2000, "Defining Attributes for Scorecard Construction in Credit Scoring," Journal of Applied Statistics, 27 (5), pp. 527-540.
Hunt, Robert M., 2005, "A Century of Consumer Credit Reporting in America," Working Paper, no. 05-13 Federal Reserve Bank of Philadelphia, June, pp. 1-54.
Lewis, Edward M., 1992, An Introduction to Credit Scoring, San Rafael, CA: Athena Press.
Martell, Javier, Paul Panichelli, Rich Strauch, and Sally Taylor-Shoff, 1991, "The Effectiveness of Scoring on Low-to-Moderate-Income and High-Minority Area Populations" (San Rafael, Calif: Fair Isaac).
Munnell, Alicia H., Lynn E. Browne, James McEnearney, and Geoffrey M. B. Tootell,, 1996, "Mortgage Lending in Boston: Interpreting HMDA Data." American Economic Review, 86(1), pp. 25-53.
Rosenberg, Eric and Alan Gleit, 1994, "Quantitative Methods in Credit Management: A Survey," Operations Research, 42 (4), pp. 589-613.
Ross, Stephen L. And John Yinger, 2002, The Color of Credit: Mortgage Discrimination, Research Methodology, and Fair-Lending Enforcement (New York: MIT Press).
Schreiner, Mark, 2002, "Scoring: The Next Breakthrough in Microcredit?" Consultative Group to Assist the Poorest.
Stengel, Mitchell, and Dennis Glennon, 1999, "Evaluating Statistical Models of Mortgage Lending Discrimination: A Bank-Specific Analysis." Real Estate Economics, 27(2), pp. 299-334.
Straka, John W., 2000, "A Shift in the Mortgage Landscape: The 1990s Move to Automated Credit Evaluations," Journal of Housing Research, 11(2), pp. 207-32.
Yago, Glen, Betsy Zeidman, and Bill Schmidt, 2002, "Creating Capital, Jobs and Wealth in Emerging Domestic Markets," The Ford Foundation.
 |
 |
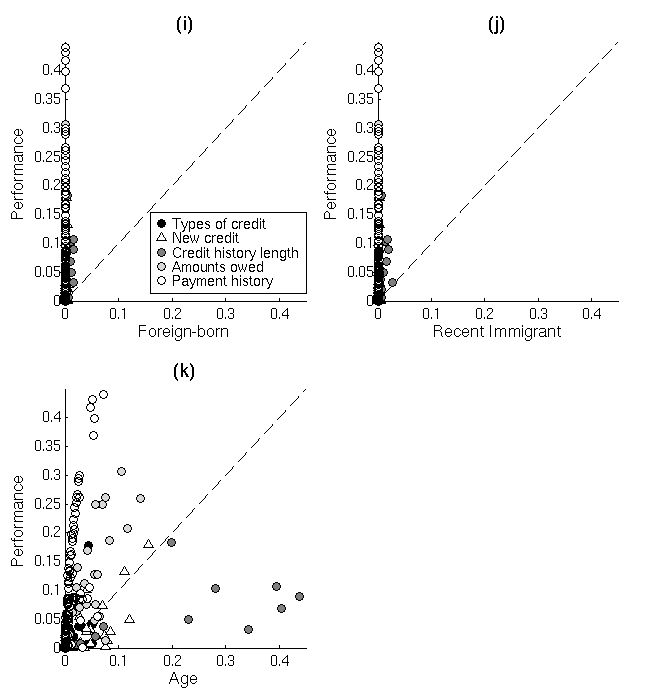 |
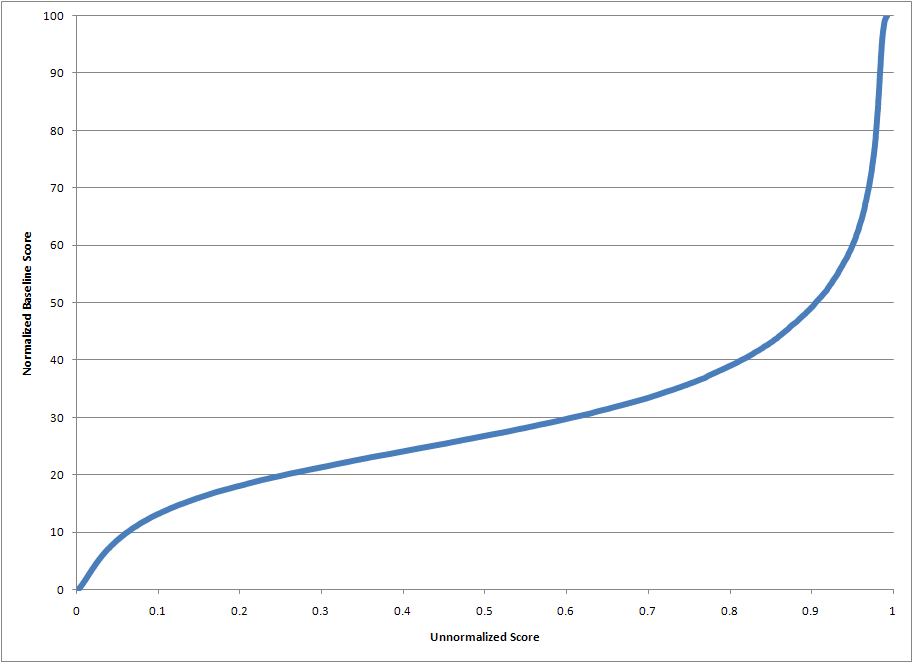
Table 1: Baseline Model Specification
(A) Thin Scorecard
S059: Total number of public records and derogatory accounts with an amount owed greater than $100
| 0 | 0.00 |
| 1 | -1.31 |
| 2-3 | -1.85 |
| 4 | -2.33 |
| 5 or more | -2.92 |
Table 1: Baseline Model Specification
(A) Thin Scorecard
AT36: Total number of months since the most recent account delinquency
| Not applicable | 2.54 |
| 0-1 | 0.00 |
| 2 | 0.51 |
| 3 or more | 1.36 |
Table 1: Baseline Model Specification
(A) Thin Scorecard
AT34: Percentage of total remaining balance to total maximum credit for all open accounts reported in the past 12 months
| Not applicable | -0.58 |
| 0-9 | 0.00 |
| 10-15 | -0.40 |
| 16-30 | -0.60 |
| 31-63 | -0.83 |
| 64-95 | -1.09 |
| 96-99 | -1.10 |
| 100-105 | -1.81 |
| 106-181 | -2.12 |
| 182 or more | -3.72 |
Table 1: Baseline Model Specification
(A) Thin Scorecard
AT24: Total number of accounts in good standing, opened 6 or more months ago
| 0 | 0.00 |
| 1 | 0.70 |
| 2 or more | 0.70 |
Table 1: Baseline Model Specification
(A) Thin Scorecard
G096: Total number of inquiries for credit
| 0 | 0.00 |
| 1 | -0.17 |
| 2 | -0.39 |
| 3 | -0.42 |
| 4 | -0.66 |
| 5-12 | -0.66 |
| 13 or more | -1.26 |
Table 1: Baseline Model Specification
(A) Thin Scorecard
AT28: Total maximum credit issued on open accounts reported in the past 12 months
| 0 - 499 | 0.00 |
| 500-1,499 | 0.42 |
| 1,500 - 134,699 | 0.70 |
| 134,700 - 249,599 | 1.52 |
| 249,600 or more | 3.27 |
Table 1: Baseline Model Specification
(A) Thin Scorecard
RE20: Total number of months since the oldest revolving account was opened
| Not applicable | 1.42 |
| 0 | 0.00 |
| 1-67 | 1.54 |
| 68-91 | 1.94 |
| 92-124 | 1.99 |
| 125-217 | |
| 218-342 | 2.34 |
| 343 or more | 2.73 |
Table 1: Baseline Model Specification
(A) Thin Scorecard
G103: Total number of months since the most recent update on an account
| 0 | 0.00 |
| 1 | -0.20 |
| 2-3 | -0.52 |
| 4-12 | -0.83 |
| 13-15 | -0.83 |
| 16 or more | -0.83 |
Table 1: Baseline Model Specification
(A) Thin Scorecard
G002: Total number of times in payment history where payments were 60 days past due
| 0 | 0.00 |
| 1 or more | -0.64 |
| Constant | -2.14 |
Table 1: Baseline Model Specification
(A) Thin Scorecard
Memo: Scorecard Statistics
| Scorable Sample | |
| Number in scorecard | 29,656 |
| Percent in Scorecard | 12.8 |
Table 1: Baseline Model Specification
(A) Thin Scorecard
Memo: Scorecard Statistics
| Estimation Sample | |
| Number in scorecard | 19,847 |
| Percent in scorecard | 9.9 |
| Scorecard percent bad | 34.8 |
| Scorecard KS statistic | 0.73 |
Table 1: Baseline Model Specification
(B) Clean Scorecard
AT36: Total number of months since the most recent account delinquency
| Characteristic And Code |
Credit Points |
| Not applicable | 2.70 |
| 0 | 0.00 |
| 1 | 0.61 |
| 2 | 0.89 |
| 3 - 4 | 1.22 |
| 5 | 1.43 |
| 6 - 9 | 1.70 |
| 10 - 12 | 1.84 |
| 13 - 18 | 2.07 |
| 19 - 31 | 2.31 |
| 32 - 43 | 2.51 |
| 44 or more | 2.68 |
Table 1: Baseline Model Specification
(B) Clean Scorecard
RE34: Percentage of total remaining balance to total maximum credit for all open revolving accounts reported in the past 12 months
| Not applicable | -0.71 |
| 0 - 5 | 0.00 |
| 6 - 10 | -0.10 |
| 11 - 14 | -0.20 |
| 15 - 20 | -0.25 |
| 21 - 25 | -0.27 |
| 26 - 34 | -0.39 |
| 35 - 43 | -0.42 |
| 44 - 53 | -0.42 |
| 54 - 61 | -0.63 |
| 62 - 72 | -0.72 |
| 73 - 78 | -0.72 |
| 79 - 90 | -0.88 |
| 91 - 99 | -1.04 |
| 100 or more | -1.51 |
Table 1: Baseline Model Specification
(B) Clean Scorecard
RE28: Total maximum credit on open revolving accounts reported in the past 12 months
| 0 - 2,499 | 0.00 |
| 2,500 - 4,499 | 0.36 |
| 4,500 - 6,499 | 0.40 |
| 6,500 - 11,499 | 0.56 |
| 11,500 - '14,499 | 0.56 |
| 14,500 - 23,499 | 0.68 |
| 23,500 - 32,499 | 0.72 |
| 32,500 - 132,499 | 0.74 |
| 132,500 or more | 0.99 |
Table 1: Baseline Model Specification
(B) Clean Scorecard
S004: Average age of accounts on credit report
| 0 - 9 | 0.00 |
| 10 - 15 | 0.44 |
| 16 - 33 | 0.77 |
| 34 - 44 | 0.89 |
| 45 - 55 | 0.98 |
| 56 - 61 | 1.15 |
| 62 - 70 | 1.15 |
| 71 - 75 | 1.27 |
| 76 - 84 | 1.34 |
| 85 - 103 | 1.40 |
| 104 - 109 | 1.48 |
| 110 - 152 | 1.49 |
| 153 - 224 | 1.57 |
| 225 or more | 1.69 |
Table 1: Baseline Model Specification
(B) Clean Scorecard
S043: Total number of open non-installment accounts with a remaining balance to maximum credit issued ratio greater than 50% reported in the past 12 months
| 0 | 0.00 |
| 1 | -0.21 |
| 2 | -0.44 |
| 3 | -0.70 |
| 4 | -0.76 |
| 5 | -0.87 |
| 6 - 7 | -1.02 |
| 8 or more | -1.29 |
Table 1: Baseline Model Specification
(B) Clean Scorecard
AT28: Total maximum credit issued on open accounts reported in the past 12 months
| 0 - 2,499 | 0.00 |
| 2,500 - 5,499 | 0.11 |
| 5,500 - '14,499 | 0.11 |
| 14,500 - '23,499 | 0.11 |
| 24,500 - '44,499 | 0.14 |
| 44,500 - 92,499 | 0.21 |
| 92,500 - '172,499 | 0.45 |
| 172,500 - 327,499 | 0.68 |
| 327,500 or more | 0.91 |
Table 1: Baseline Model Specification
(B) Clean Scorecard
G096: Total number of inquiries for credit
| 0 | 0.00 |
| 1 | -0.13 |
| 2 | -0.17 |
| 3 | -0.24 |
| 4 - 5 | -0.26 |
| 6 - 7 | -0.36 |
| 8 | -0.47 |
| 9 - 11 | -0.50 |
| 12 - 13 | -0.58 |
| 14 - 16 | -0.69 |
| 17 - 24 | -0.77 |
| 25 or more | -0.80 |
Table 1: Baseline Model Specification
(B) Clean Scorecard
G089: Greatest amount of time a payment was ever late on an account
| Not applicable | 0.16 |
| 0 - 2 | 0.00 |
| 3 - 7 | -0.48 |
| 8 or more | -0.87 |
Table 1: Baseline Model Specification
(B) Clean Scorecard
BC29: Total number of open bankcard accounts reported in the past 12 months with remaining balance larger than zero
| 0 - 1 | 0.00 |
| 2 | -0.04 |
| 3 | -0.14 |
| 4 | -0.28 |
| 5 | -0.31 |
| 6 | -0.55 |
| 7 - 8 | -0.61 |
| 9 or more | -0.89 |
| Constant | -1.03 |
Table 1: Baseline Model Specification
(B) Clean Scorecard
Memo: Scorecard Statistics
| Scorable Sample | |
|---|---|
| Number in scorecard | 129,289 |
| Percent in Scorecard | 55.6 |
Table 1: Baseline Model Specification
(B) Clean Scorecard
Memo: Scorecard Statistics
| Estimation Sample | |
|---|---|
| Number in scorecard | 118,061 |
| Percent in scorecard | 58.9 |
| Scorecard percent bad | 7.4 |
| Scorecard KS statistic | 0.54 |
Table 1: Baseline Model Specification
(C) Dirty Scorecard
G051: Percentage of accounts with no late payments reported
| Not applicable | 0.95 |
| 0 - 9 | 0.00 |
| 10 - 15 | 0.18 |
| 16 - 24 | 0.36 |
| 25 - 32 | 0.36 |
| 33 - 38 | 0.36 |
| 39 - 41 | 0.39 |
| 42 - 47 | 0.51 |
| 48 - 52 | 0.51 |
| 53 - 59 | 0.60 |
| 60 - 61 | 0.60 |
| 62 - 65 | 0.68 |
| 66 - 70 | 0.70 |
| 71 - 74 | 0.73 |
| 75 - 79 | 0.83 |
| 80 - 83 | 0.83 |
| 84 - 87 | 0.91 |
| 88 - 90 | 0.91 |
| 91 | 0.97 |
| 92 - 93 | 1.09 |
| 94 or more | 1.09 |
Table 1: Baseline Model Specification
(C) Dirty Scorecard
AT36: Total number of months since the most recent account delinquency
| Not applicable | 2.20 |
| 0 | 0.00 |
| 1 | 0.61 |
| 2 | 1.14 |
| 3 - 4 | 1.30 |
| 5 | 1.47 |
| 6 - 8 | 1.65 |
| 9 - 12 | 1.72 |
| 13 - 16 | 1.81 |
| 17 - 31 | 1.97 |
| 32 - 39 | 2.12 |
| 40 - 53 | 2.24 |
| 54 - 70 | 2.33 |
| 71 or more | 2.40 |
Table 1: Baseline Model Specification
(C) Dirty Scorecard
AT35: Average balance of all open accounts reported in the past 12 months
| Not applicable | -0.85 |
| 0 - 10,499 | 0.00 |
| 10,500 - 19,499 | 0.08 |
| 19,500 - 189,582 | 0.21 |
| 189,583 or more | 1.12 |
Table 1: Baseline Model Specification
(C) Dirty Scorecard
S059: Total number of public records and derogatory accounts with an amount owed greater than $100
| 0 | 0.00 |
| 1 | -0.44 |
| 2 | -0.80 |
| 3 | -1.08 |
| 4 | -1.28 |
| 5 | -1.45 |
| 6 | -1.46 |
| 7 | -1.76 |
| 8 | -1.76 |
| 9 | -1.91 |
| 10 - 16 | -2.18 |
| 17 or more | -3.09 |
Table 1: Baseline Model Specification
(C) Dirty Scorecard
G095: Total number of months since the most recent occurrence of a derogatory public record
| Not applicable | -0.28 |
| 0 - 4 | 0.00 |
| 5 - 10 | 0.00 |
| 11 - 23 | 0.00 |
| 24 - 26 | 0.17 |
| 27 - 47 | 0.29 |
| 48 - 64 | 0.31 |
| 65 - 82 | 0.43 |
| 83 or more | 0.43 |
Table 1: Baseline Model Specification
(C) Dirty Scorecard
S004: Average age of accounts on credit report
| Not applicable | 5.02 |
| 0 - 45 | 0.00 |
| 46 - 54 | 0.23 |
| 55 - 64 | 0.36 |
| 65 - 69 | 0.41 |
| 70 - 73 | 0.48 |
| 74 - 82 | 0.49 |
| 83 - 88 | 0.49 |
| 89 - 97 | 0.60 |
| 98 - 101 | 0.67 |
| 102 - 114 | 0.79 |
| 115 - 146 | 0.79 |
| 147 - 326 | 0.88 |
| 327 or more | 2.24 |
Table 1: Baseline Model Specification
(C) Dirty Scorecard
S019: Total number of open personal finance installment accounts reported in the past 12 months
| 0 | 0.00 |
| 1 | -0.24 |
| 2 | -0.44 |
| 3 | -0.74 |
| 4 or more | -1.10 |
Table 1: Baseline Model Specification
(C) Dirty Scorecard
G059: Number of accounts that have payments that are currently or previously 30 or more days past due within the past 12 months
| 0 | 0.00 |
| 1 | 0.00 |
| 2 | -0.37 |
| 3 | -0.56 |
| 4 - 5 | -0.82 |
| 6 - 7 | -1.00 |
| 8 or more | -1.09 |
Table 1: Baseline Model Specification
(C) Dirty Scorecard
BC34: Percentage of total remaining balance to total maximum credit for all open backcard accounts reported in the past 12 months
| Not applicable | -0.60 |
| 0 - 27 | 0.00 |
| 42 - 52 | -0.21 |
| 53 - 70 | -0.35 |
| 71 - 84 | -0.51 |
| 85 - 95 | -0.67 |
| 96 - 98 | -0.88 |
| 99 - 100 | -1.01 |
| 101 - 104 | -1.19 |
| 105 or more | -1.43 |
Table 1: Baseline Model Specification
(C) Dirty Scorecard
AT03: Total number of open accounts in good standing
| 0 | 0.00 |
| 1 | 0.70 |
| 2 | 0.86 |
| 3 | 0.96 |
| 4 | 0.96 |
| 5 | 0.96 |
| 6 - 7 | 0.96 |
| 8 | 0.96 |
| 9 - 11 | 0.96 |
| 12 - 15 | 0.96 |
| 16 or more | 0.96 |
Table 1: Baseline Model Specification
(C) Dirty Scorecard
AT03: Total number of open accounts in good standing
| Constant | -2.30 |
Table 1: Baseline Model Specification
(C) Dirty Scorecard
Memo: Scorecard Statistics
| Scorable Sample | |
|---|---|
| Number in scorecard | 73,522 |
| Percent in Scorecard | 31.6 |
Table 1: Baseline Model Specification
(C) Dirty Scorecard
Memo: Scorecard Statistics
| Estimation Sample | |
|---|---|
| Number in scorecard | 62,529 |
| Percent in scorecard | 31.2 |
| Scorecard percent bad | 64.7 |
| Scorecard KS statistic | 0.62 |
| Demographic Group | Number Of Observations |
Baseline: Mean |
Baseline: Median | Baseline: 1st Quartile | Baseline: 2nd Quartile | Baseline: 3rd Quartile | Baseline: 4th Quartile | TransRisk: Mean | TransRisk: Median | TransRisk: 1st Quartile | TransRisk: 2nd Quartile | TransRisk: 3rd Quartile | TransRisk: 4th Quartile | Vantage Score: Mean |
Vantage Score: Median |
Vantage Score: 1st Quartile |
Vantage Score: 2nd Quartile |
Vantage Score: 3rd Quartile |
Vantage Score: 4th Quartile |
|
| Race or Ethnicity: Non-Hispanic White | 146,328 | 54.2 | 56.0 | 20.3 | 23.9 | 25.7 | 30.1 | 54.0 | 55.2 | 20.4 | 24.5 | 24.8 | 30.3 | 54.7 | 56.8 | 20.2 | 23.6 | 25.2 | 31.0 | |
| Race or Ethnicity: Black | 21,114 | 25.6 | 18.8 | 61.3 | 23.9 | 9.6 | 5.2 | 25.7 | 19.4 | 61.2 | 24.1 | 9.3 | 5.4 | 26.2 | 19.2 | 60.2 | 24.0 | 10.2 | 5.6 | |
| Race or Ethnicity: Hispanic | 15,488 | 37.9 | 33.2 | 38.1 | 31.2 | 19.4 | 11.3 | 38.3 | 33.8 | 37.4 | 31.5 | 19.3 | 11.8 | 38.7 | 34.2 | 37.4 | 30.9 | 19.7 | 12.0 | |
| Race or Ethnicity: Asian | 8,002 | 54.5 | 55.8 | 15.3 | 27.1 | 33.4 | 24.3 | 54.8 | 55.6 | 15.5 | 26.4 | 31.9 | 26.2 | 55.9 | 56.6 | 15.5 | 26.8 | 29.5 | 28.3 | |
| Race or Ethnicity: American Indian | 50 | 58.0 | 62.6 | 17.5 | 21.4 | 24.7 | 36.4 | 57.7 | 60.6 | 17.6 | 22.9 | 23.2 | 36.3 | 58.4 | 63.0 | 16.8 | 21.2 | 26.5 | 35.5 | |
| Race or Ethnicity: Missing Race | 36,352 | 51.6 | 52.8 | 19.8 | 26.8 | 31.8 | 21.6 | 52.8 | 56.0 | 19.4 | 23.7 | 37.0 | 19.9 | 49.4 | 50.8 | 20.5 | 28.4 | 34.4 | 16.8 | |
| Gender: Male | 102,061 | 49.2 | 48.2 | 26.5 | 25.3 | 23.6 | 24.6 | 48.8 | 47.6 | 26.3 | 26.1 | 23.2 | 24.4 | 49.9 | 49.2 | 26.2 | 24.7 | 23.4 | 25.8 | |
| Gender: Female | 105,347 | 50.2 | 50.4 | 25.6 | 24.2 | 23.9 | 26.3 | 50.5 | 50.2 | 25.6 | 24.3 | 22.8 | 27.3 | 50.7 | 50.6 | 25.4 | 24.1 | 23.4 | 27.2 | |
| Gender: Unknown | 25,059 | 52.2 | 53.6 | 17.6 | 27.3 | 35.1 | 20.0 | 53.9 | 57.8 | 17.2 | 22.4 | 43.2 | 17.2 | 48.5 | 50.8 | 18.8 | 30.0 | 38.9 | 12.3 | |
| Marital Status: Married | 118,089 | 57.3 | 60.4 | 17.0 | 22.7 | 26.9 | 33.5 | 56.8 | 59.2 | 17.2 | 23.2 | 26.6 | 32.9 | 57.8 | 60.8 | 16.5 | 22.6 | 27.1 | 33.8 | |
| Marital Status: Single | 68,207 | 44.7 | 42.2 | 31.1 | 26.7 | 23.2 | 19.0 | 45.0 | 42.2 | 31.1 | 26.7 | 22.6 | 19.6 | 44.8 | 42.2 | 31.2 | 26.4 | 23.2 | 19.2 | |
| Marital Status: Unknown | 46,171 | 39.2 | 36.2 | 37.0 | 28.4 | 22.9 | 11.7 | 40.7 | 37.2 | 36.0 | 26.6 | 25.3 | 12.1 | 38.4 | 35.6 | 37.6 | 29.2 | 22.4 | 10.8 | |
| Marital Status and Gender: Single Female | 32,788 | 44.4 | 41.4 | 32.1 | 26.0 | 22.1 | 19.8 | 44.8 | 41.4 | 32.3 | 26.1 | 20.4 | 21.2 | 44.9 | 41.4 | 32.4 | 25.6 | 21.1 | 21.0 | |
| Marital Status and Gender: Single Male | 29,048 | 43.5 | 40.2 | 32.4 | 27.6 | 22.2 | 17.7 | 43.4 | 39.8 | 32.4 | 28.1 | 21.1 | 18.4 | 44.0 | 40.2 | 32.3 | 27.1 | 22.0 | 18.7 | |
| Marital Status and Gender: Married Female | 55,126 | 57.7 | 61.4 | 17.0 | 22.2 | 26.1 | 34.7 | 57.5 | 60.6 | 17.2 | 22.6 | 24.9 | 35.2 | 58.3 | 62.2 | 16.4 | 22.2 | 26.0 | 35.4 | |
| Marital Status and Gender: Married Male | 54,506 | 56.7 | 59.2 | 17.8 | 23.1 | 26.1 | 33.0 | 55.8 | 57.6 | 18.0 | 24.2 | 25.8 | 32.0 | 57.7 | 60.8 | 17.2 | 22.5 | 25.8 | 34.6 | |
| Marital Status and Gender: Unknown | 60,999 | 43.2 | 42.0 | 31.7 | 27.4 | 26.0 | 14.9 | 44.4 | 43.6 | 31.0 | 25.4 | 29.3 | 14.4 | 41.7 | 41.0 | 32.3 | 28.6 | 27.1 | 12.0 | |
| Age: Under 30 | 33,011 | 32.5 | 31.8 | 40.8 | 35.9 | 21.9 | 1.4 | 34.3 | 32.8 | 38.9 | 33.5 | 24.5 | 3.0 | 31.2 | 28.8 | 43.9 | 35.4 | 18.2 | 2.4 | |
| Age: 30 - 39 | 40,485 | 40.3 | 36.4 | 36.8 | 26.3 | 23.7 | 13.2 | 39.8 | 36.2 | 36.7 | 27.0 | 22.7 | 13.6 | 40.7 | 37.0 | 36.3 | 27.2 | 22.2 | 14.2 | |
| Age: 40 to 49 | 46,407 | 47.9 | 46.2 | 28.4 | 25.1 | 23.5 | 23.0 | 47.0 | 45.0 | 28.7 | 26.3 | 22.6 | 22.4 | 49.2 | 48.0 | 27.1 | 25.1 | 23.1 | 24.7 | |
| Age: 50 to 61 | 43,474 | 55.5 | 57.4 | 19.5 | 23.6 | 24.8 | 32.1 | 54.6 | 55.4 | 19.9 | 25.1 | 23.1 | 31.9 | 57.2 | 60.0 | 18.4 | 22.7 | 24.5 | 34.4 | |
| Age: 62 and over | 44,075 | 67.7 | 75.8 | 9.0 | 15.5 | 24.6 | 50.9 | 68.2 | 76.8 | 9.6 | 16.4 | 22.4 | 51.7 | 67.9 | 75.0 | 8.2 | 14.6 | 27.4 | 49.8 | |
| Age: Unknown Age | 25,015 | 52.2 | 53.6 | 17.6 | 27.3 | 35.1 | 20.0 | 53.9 | 57.8 | 17.2 | 22.4 | 43.2 | 17.2 | 48.5 | 50.8 | 18.8 | 30.0 | 38.9 | 12.2 | |
| Immigration Status: Native Born | 206,870 | 50.2 | 50.4 | 25.4 | 24.3 | 24.6 | 25.6 | 50.3 | 50.4 | 25.4 | 24.2 | 24.9 | 25.5 | 50.2 | 50.2 | 25.3 | 24.5 | 24.8 | 25.4 | |
| Immigration Status: Foreign Born | 25,597 | 48.4 | 47.6 | 22.4 | 30.7 | 28.0 | 19.0 | 48.8 | 47.8 | 22.2 | 30.4 | 27.0 | 20.4 | 49.7 | 48.4 | 22.3 | 29.5 | 26.6 | 21.5 | |
| Immigration Status: Recent Immigrant | 4,261 | 43.8 | 45.4 | 20.1 | 37.3 | 37.7 | 4.9 | 45.5 | 47.0 | 19.1 | 35.4 | 36.6 | 9.0 | 44.0 | 44.4 | 22.5 | 36.6 | 32.4 | 8.5 | |
| Total | 232,467 | 50.0 | 50.0 | 25.1 | 25.0 | 25.0 | 24.9 | 50.1 | 50.2 | 25.0 | 24.9 | 25.2 | 24.9 | 50.1 | 50.0 | 25.0 | 25.0 | 25.0 | 24.9 | |
Table 3: Definitions of Selected Credit Characteristics
(A) Characteristics Appearing in the Baseline Model
| Name | Definition |
| AT03 | Total Number of open accounts in good standing |
| AT24 | Total number of accounts in good standing, opened 6 or more months ago |
| AT28 | Total maximum credit issued on open accounts reported in the last 12 months |
| AT34 | Percentage of total remaining balance to total maximum credit for all open accounts reported in the past 12 months |
| AT35 | Average balance of all open accounts reported in the last 12 months |
| AT36 | Total number of months since the most recent account delinquency |
| BC29 | Total number of open bankcard accounts reported in the past 12 months with remaining balance larger than zero |
| BC34 | Percentage of total remaining balance to total maximum credit for all open bankcard accounts reported in the past 12 months |
| G002 | Total number of times in payment history where payments were 60 days past due |
| G051 | Percentage of accounts with no late payment reported |
| G059 | Number of accounts that have payments that are currently or previously 30 or more days past due within the past 12 months |
| G089 | Greatest amount of time a payment was late ever on an account |
| G095 | Total number of months since the most recent occurrence of a derogatory public record |
| G096 | Total number of inquiries for credit |
| G103 | Total number of months since the most recent update on an account |
| RE20 | Total number of months since the oldest revolving account was opened |
| RE28 | Total maximum credit on open revolving accounts reported in the past 12 months |
| RE34 | Percentage of total remaining balance to total maximum credit for all open revolving accounts reported in the past 12 months |
| S004 | Average age of accounts on credit report |
| S019 | Total number of open personal finance installment accounts reported in the past 12 months |
| S043 | Total number of open non-installment accounts with a remaining balance to maximum credit issued ratio greater than 50 percent reported in the past 12 months |
| S059 | Total number of public records and derogatory accounts with an amount owed greater than $100 |
Table 3: Definitions of Selected Credit Characteristics
(B) Characteristics Used to Define Scorecards
| Name | Definition |
| AT01 | Total number of accounts |
| G071 | Number of accounts that have payments that are currently or previously 90 or more days past due within the past 24 months |
| G093 | Total number of derogatory public records |
| S064 | Total amount ever owed for all accounts sent to collection |
Table 3: Definitions of Selected Credit Characteristics
(C) Other Characteristics Appearing in Models Estimated in Demographically Neutral Environments
| Name | Definition |
| AT10 | Total number of open accounts with information confirmed in the past 3 months |
| AT11 | Total number of open accounts with information confirmed in the past 6 months |
| AT14 | Total number of open accounts with information confirmed in the past 24 months |
| AT20 | Total number of months since the oldest account was opened |
| AT27 | Total number of accounts in good standing, opened 24 or more months ago |
| BC13 | Total number of open bankcard accounts with information confirmed in the past 18 months |
| BC30 | Percentage of bankcard accounts with a remaining balance to maximum credit ratio greater than 50 percent |
| BC31 | Percentage of bankcard accounts with a remaining balance to maximum credit issued ratio greater than 75 percent |
| BC98 | Total available credit remaining on all bankcard accounts reported in the past 12 months |
| DS33 | Total remaining balance on all department store accounts reported in the past 12 months |
| G007 | Total number of times in payment history where payments were 30 days past due or more |
| G041 | Total number of accounts that have payments that were ever 30 or more days past due |
| G047 | Total number of accounts that have payments that were never 60 or more days past due |
| G058 | Number of accounts that have payments that are currently or previously 30 or more days past due within the past 6 months |
| G060 | Number of accounts that have payments that are currently or previously 30 or more days past due within the past 18 months |
| G061 | Number of accounts htat have payments that are currently or previously 30 or more days past due within the past 24 months |
| G065 | Number of accounts that have payments that are currently or previously 60 or more days past due wihtin the past 18 months |
| G091 | Total past due balances reported in the past 12 months |
| IN06 | Total number of installment accounts opened in the past 6 months |
| IN34 | Percentage of total remaining balance to total maximum credit for all open installment accounts reported in the past 12 months |
| MT22 | Total number of months since the newest open mortgage account was reported |
| MT36 | Total number of months sicne the most recent mortgage account delinquency |
| PB07 | Total number of revolving bank accounts with maximum credit greater than $7,500 opened in the past 12 months |
| PB33 | Total remaining balance from all open bankcard accounts with maximum credit greater than $7,500 reported in the past 12 months |
| PB35 | Average remaining balances on all open bankcard accounts with maximum credit greater than $7,500 reported in the past 12 months |
| PF09 | Total number of personal loan accounts opened in the past 24 months |
| PF34 | Percentage of total remaining balance to total maximum credit for all open personal loan accounts reported in the past 12 months |
| RE12 | Total number of open revolving accounts with information confirmed in the past 12 months |
| RE33 | Total remaining balances from all open revolving accounts reported in the past 12 months |
| RE35 | Average balance on all open revolving accounts reported in the past 12 months |
| RT33 | Total remaining balance from all open retail store accounts reported in the past 12 months |
| RT34 | Percentage of total remaining balance to total maximum credit for all open retail store accounts reported in the past 12 months |
| S040 | Largest maximum credit amount on all open retail store accounts reported in the past 12 months |
| S046 | Percentage of accounts that are open and active with a remaining balance greater than $0 reported in the past 12 months |
Table 4: Score Changes from Removal of Individual Credit Characteristics by Scorecard
(A) Thin Scorecard
| Demographic Group | Omitted Variable S059: Mean | Omitted Variable S059: Median | Omitted Variable AT36: Mean | Omitted Variable AT36: Median | Omitted Variable AT34: Mean | Omitted Variable AT34: Median | Omitted Variable AT24: Mean | Omitted Variable AT24: Median | Omitted Variable G096: Mean | Omitted Variable G096: Median | Omitted Variable AT28: Mean | Omitted Variable AT28: Median | Omitted Variable RE20: Mean | Omitted Variable RE20: Median | Omitted Variable G103: Mean | Omitted Variable G103: Median | Omitted Variable G002: Mean | Omitted Variable G002: Median | |
| Race or Ethnicity: Non-Hispanic White | 0.00 | 0.00 | 0.00 | 0.00 | 0.00 | 0.00 | 0.00 | 0.00 | 0.00 | 0.00 | 0.00 | 0.00 | 0.00 | 0.00 | 0.00 | 0.00 | 0.00 | 0.00 | |
| Race or Ethnicity: Black | 0.18 | 1.00 | 1.08 | 1.80 | 1.12 | 0.20 | 0.10 | 0.20 | -0.26 | 0.00 | 1.01 | 0.40 | 0.90 | 0.00 | 0.61 | 0.20 | 0.07 | -0.20 | |
| Race or Ethnicity: Hispanic | -0.99 | -0.80 | 0.34 | 0.00 | 0.73 | 0.20 | 0.00 | 0.00 | -0.04 | 0.00 | 0.72 | 0.20 | 1.05 | 0.00 | 0.54 | 0.20 | 0.11 | 0.00 | |
| Race or Ethnicity: Asian | -1.36 | -1.20 | -0.21 | -0.40 | -0.90 | -0.80 | 0.10 | -0.40 | -0.05 | -0.40 | -0.60 | -1.00 | 1.58 | 0.40 | -0.12 | -0.60 | -0.04 | 0.00 | |
| Race or Ethnicity: American Indian | 2.99 | 2.60 | -0.29 | -0.40 | -1.59 | -1.20 | -0.02 | 0.20 | 0.54 | 0.40 | -1.40 | -1.40 | -2.34 | -1.60 | -0.70 | -0.60 | -0.02 | -0.20 | |
| Race or Ethnicity: Missing Race | -0.44 | -0.20 | -0.10 | -0.40 | -0.69 | -1.60 | -0.42 | -0.60 | -0.43 | -0.60 | 0.20 | 0.00 | -1.16 | -0.20 | 0.23 | -0.20 | 0.00 | 0.00 | |
| Gender: Male | 0.00 | 0.00 | 0.00 | 0.00 | 0.00 | 0.00 | 0.00 | 0.00 | 0.00 | 0.00 | 0.00 | 0.00 | 0.00 | 0.00 | 0.00 | 0.00 | 0.00 | 0.00 | |
| Gender: Female | 0.38 | 0.40 | -0.23 | -0.20 | -0.20 | 0.00 | -0.03 | 0.00 | -0.20 | 0.00 | 0.10 | 0.00 | 0.27 | 0.00 | 0.00 | 0.00 | 0.02 | 0.00 | |
| Gender: Unknown | -0.03 | 0.00 | -0.43 | -0.60 | -1.03 | -1.80 | -0.49 | -0.60 | -0.53 | -0.80 | 0.01 | 0.00 | -1.58 | -0.40 | 0.07 | -0.20 | -0.03 | 0.00 | |
| Marital Status: Married | 0.00 | 0.00 | 0.00 | 0.00 | 0.00 | 0.00 | 0.00 | 0.00 | 0.00 | 0.00 | 0.00 | 0.00 | 0.00 | 0.00 | 0.00 | 0.00 | 0.00 | 0.00 | |
| Marital Status: Single | -0.02 | 0.20 | 0.40 | 0.40 | 0.40 | 0.40 | -0.01 | 0.20 | -0.09 | 0.00 | 0.53 | 0.40 | 0.20 | 0.00 | 0.17 | 0.20 | 0.05 | 0.00 | |
| Marital Status: Unknown | -0.62 | -0.40 | 0.49 | 0.60 | 0.69 | 0.60 | -0.08 | 0.00 | -0.64 | -0.60 | 0.90 | 0.60 | 1.27 | 0.40 | 1.02 | 0.60 | 0.08 | 0.00 | |
| Marital Status and Gender: Single Female | 0.00 | 0.00 | 0.00 | 0.00 | 0.00 | 0.00 | 0.00 | 0.00 | 0.00 | 0.00 | 0.00 | 0.00 | 0.00 | 0.00 | 0.00 | 0.00 | 0.00 | 0.00 | |
| Marital Status and Gender: Single Male | -0.31 | -0.20 | 0.13 | 0.20 | 0.22 | 0.00 | 0.04 | 0.00 | 0.17 | 0.00 | -0.10 | -0.20 | -0.19 | 0.20 | 0.01 | 0.00 | 0.00 | 0.00 | |
| Marital Status and Gender: Married Female | -0.40 | -0.80 | -0.47 | -0.40 | -0.21 | -0.20 | 0.01 | -0.40 | -0.19 | -0.20 | -0.49 | -0.40 | 0.00 | 0.20 | -0.16 | -0.20 | -0.02 | 0.20 | |
| Marital Status and Gender: Married Male | -0.64 | -1.20 | -0.19 | -0.40 | -0.18 | -0.20 | -0.02 | -0.20 | 0.25 | 0.20 | -0.69 | -0.40 | -0.49 | 0.20 | -0.29 | -0.20 | -0.07 | 0.20 | |
| Marital Status and Gender: Unknown | -0.51 | -0.40 | -0.16 | -0.40 | -0.35 | -0.80 | -0.27 | -0.40 | -0.38 | -0.40 | -0.01 | 0.00 | -0.88 | 0.20 | 0.19 | 0.00 | -0.02 | 0.20 | |
| Age: Under 30 | 0.00 | 0.00 | 0.00 | 0.00 | 0.00 | 0.00 | 0.00 | 0.00 | 0.00 | 0.00 | 0.00 | 0.00 | 0.00 | 0.00 | 0.00 | 0.00 | 0.00 | 0.00 | |
| Age: 30 - 39 | 1.89 | 2.20 | 0.19 | 1.40 | -0.52 | -0.40 | -0.23 | 0.40 | -0.06 | -0.20 | -0.23 | 0.00 | -0.51 | -0.20 | 0.05 | 0.00 | -0.05 | -0.20 | |
| Age: 40 to 49 | 2.24 | 2.60 | 0.12 | 1.00 | -0.67 | -0.40 | -0.32 | 0.40 | -0.21 | -0.20 | -0.42 | 0.00 | -0.69 | -0.20 | 0.03 | 0.00 | -0.05 | -0.20 | |
| Age: 50 to 61 | 2.27 | 2.00 | -0.07 | 0.20 | -1.26 | -0.80 | -0.47 | 0.20 | 0.02 | -0.20 | -0.98 | -0.20 | -1.30 | -0.20 | -0.37 | -0.40 | -0.05 | -0.20 | |
| Age: 62 and over | 3.97 | 3.60 | -0.80 | -0.40 | -3.31 | -5.00 | -0.53 | 0.00 | 0.64 | 0.60 | -2.35 | -2.80 | -5.31 | -3.40 | -1.91 | -1.80 | -0.25 | -0.20 | |
| Age: Unknown Age | 1.39 | 1.20 | -0.44 | -0.40 | -1.86 | -2.40 | -0.70 | -0.40 | -0.35 | -0.80 | -0.66 | -0.20 | -2.99 | -0.60 | -0.30 | -0.40 | -0.11 | 0.00 | |
| Immigration Status: Native Born | 0.00 | 0.00 | 0.00 | 0.00 | 0.00 | 0.00 | 0.00 | 0.00 | 0.00 | 0.00 | 0.00 | 0.00 | 0.00 | 0.00 | 0.00 | 0.00 | 0.00 | 0.00 | |
| Immigration Status: Foreign Born | -1.18 | -1.60 | -0.22 | -0.40 | -0.12 | 0.20 | 0.20 | -0.20 | 0.45 | 0.20 | -0.25 | -0.20 | 1.84 | 0.40 | -0.13 | -0.40 | 0.04 | 0.00 | |
| Immigration Status: Recent Immigrant | -2.07 | -2.20 | -0.40 | -0.40 | -0.60 | -0.20 | 0.22 | -0.60 | 0.53 | 0.20 | -0.10 | -0.20 | 2.87 | 0.80 | -0.21 | -0.60 | 0.03 | 0.00 | |
| Total | -0.11 | -0.40 | -0.02 | 0.00 | -0.01 | 0.00 | 0.02 | 0.00 | 0.04 | 0.00 | -0.02 | 0.00 | 0.17 | 0.20 | -0.01 | -0.20 | 0.00 | 0.00 | |
Table 4: Score Changes from Removal of Individual Credit Characteristics by Scorecard (continued)
(B) Clean Scorecard
| Demographic Group | Number of Obs. | Omitted Variable AT36: Mean | Omitted Variable AT36: Median | Omitted Variable RE34: Mean | Omitted Variable RE34: Median | Omitted Variable S004: Mean | Omitted Variable S004: Median | Omitted Variable G089: Mean | Omitted Variable G089: Median | Omitted Variable S043: Mean | Omitted Variable S043: Median | Omitted Variable AT28: Mean | Omitted Variable AT28: Median | Omitted Variable G096: Mean | Omitted Variable G096: Median | Omitted Variable RE28: Mean | Omitted Variable RE28: Median | Omitted Variable BC29: Mean | Omitted Variable BC29: Median |
| Race or Ethnicity: Non-Hispanic White | 94,149 | 0.00 | 0.00 | 0.00 | 0.00 | 0.00 | 0.00 | 0.00 | 0.00 | 0.00 | 0.00 | 0.00 | 0.00 | 0.00 | 0.00 | 0.00 | 0.00 | 0.00 | 0.00 |
|---|---|---|---|---|---|---|---|---|---|---|---|---|---|---|---|---|---|---|---|
| Race or Ethnicity: Black | 4,997 | -0.15 | -0.20 | 0.21 | 0.20 | -0.02 | 0.00 | 0.29 | 0.00 | 0.26 | 0.20 | 0.06 | 0.00 | 0.01 | 0.00 | 0.23 | 0.20 | -0.02 | 0.20 |
| Race or Ethnicity: Hispanic | 6,314 | -0.03 | 0.00 | -0.12 | 0.00 | 1.18 | 1.00 | 0.16 | 0.00 | 0.09 | 0.20 | -0.26 | -0.20 | -0.07 | 0.00 | 0.17 | 0.00 | 0.10 | 0.20 |
| Race or Ethnicity: Asian | 5,259 | 0.02 | 0.20 | -0.13 | 0.00 | 2.21 | 1.60 | 0.31 | 0.20 | -0.29 | -0.20 | -0.54 | -0.20 | -0.04 | -0.20 | -0.22 | -0.20 | 0.21 | 0.20 |
| Race or Ethnicity: American Indian | 28 | 0.21 | 0.00 | -0.05 | 0.00 | -1.04 | -0.60 | 0.03 | 0.00 | -0.04 | 0.20 | 0.43 | 0.20 | -0.13 | -0.20 | 0.18 | 0.00 | 0.16 | 0.20 |
| Race or Ethnicity: Missing Race | 14,943 | 0.05 | 0.00 | -0.15 | -0.20 | -0.49 | -0.20 | -0.09 | -0.20 | 0.13 | 0.20 | 0.08 | 0.00 | -0.04 | -0.20 | 0.21 | 0.00 | 0.10 | 0.20 |
| Gender: Male | 58,163 | 0.00 | 0.00 | 0.00 | 0.00 | 0.00 | 0.00 | 0.00 | 0.00 | 0.00 | 0.00 | 0.00 | 0.00 | 0.00 | 0.00 | 0.00 | 0.00 | 0.00 | 0.00 |
| Gender: Female | 62,818 | 0.15 | 0.00 | -0.13 | -0.20 | 0.27 | 0.20 | 0.01 | 0.00 | 0.11 | 0.20 | 0.46 | 0.40 | -0.34 | -0.20 | -0.07 | 0.00 | -0.02 | 0.00 |
| Gender: Unknown | 8,308 | 0.28 | 0.20 | -0.30 | -0.60 | -1.15 | -1.00 | -0.23 | -0.40 | 0.33 | 0.40 | 0.49 | 0.40 | -0.24 | -0.20 | 0.36 | 0.20 | 0.11 | 0.40 |
| Marital Status: Married | 78,696 | 0.00 | 0.00 | 0.00 | 0.00 | 0.00 | 0.00 | 0.00 | 0.00 | 0.00 | 0.00 | 0.00 | 0.00 | 0.00 | 0.00 | 0.00 | 0.00 | 0.00 | 0.00 |
| Marital Status: Single | 33,632 | 0.12 | 0.20 | -0.11 | -0.20 | 0.37 | 0.40 | 0.05 | 0.00 | 0.08 | 0.20 | 0.64 | 0.40 | 0.12 | 0.00 | 0.02 | 0.00 | 0.06 | 0.20 |
| Marital Status: Unknown | 16,961 | 0.20 | 0.20 | 0.04 | -0.20 | 1.16 | 1.00 | 0.07 | 0.00 | 0.03 | 0.00 | 0.31 | 0.20 | 0.05 | 0.00 | 0.08 | 0.00 | 0.01 | 0.20 |
| Marital Status and Gender: Single Female | 17,072 | 0.00 | 0.00 | 0.00 | 0.00 | 0.00 | 0.00 | 0.00 | 0.00 | 0.00 | 0.00 | 0.00 | 0.00 | 0.00 | 0.00 | 0.00 | 0.00 | 0.00 | 0.00 |
| Marital Status and Gender: Single Male | 14,443 | -0.10 | -0.20 | 0.25 | 0.20 | 0.29 | 0.40 | 0.03 | 0.00 | -0.21 | -0.20 | -0.63 | -0.40 | 0.16 | 0.00 | 0.02 | 0.00 | 0.02 | 0.00 |
| Marital Status and Gender: Married Female | 38,427 | -0.10 | -0.20 | 0.19 | 0.20 | -0.01 | 0.00 | -0.02 | 0.00 | -0.16 | -0.20 | -0.77 | -0.40 | -0.27 | -0.20 | -0.05 | 0.00 | -0.07 | -0.20 |
| Marital Status and Gender: Married Male | 36,460 | -0.24 | -0.20 | 0.24 | 0.40 | -0.54 | -0.40 | -0.06 | 0.00 | -0.20 | -0.20 | -1.18 | -0.80 | 0.15 | 0.00 | 0.07 | 0.00 | -0.04 | -0.20 |
| Marital Status and Gender: Unknown | 22,887 | 0.04 | 0.00 | 0.15 | 0.00 | 0.14 | 0.20 | -0.06 | -0.20 | -0.05 | 0.00 | -0.54 | -0.40 | -0.01 | -0.20 | 0.19 | 0.00 | 0.00 | 0.00 |
| Age: Under 30 | 13,661 | 0.00 | 0.00 | 0.00 | 0.00 | 0.00 | 0.00 | 0.00 | 0.00 | 0.00 | 0.00 | 0.00 | 0.00 | 0.00 | 0.00 | 0.00 | 0.00 | 0.00 | 0.00 |
| Age: 30 - 39 | 19,649 | -0.41 | 0.00 | 0.46 | 0.60 | -2.49 | -2.20 | -0.18 | 0.00 | -0.20 | -0.20 | -1.08 | -0.60 | 0.31 | 0.20 | -0.10 | 0.20 | -0.06 | 0.00 |
| Age: 40 to 49 | 26,201 | -0.46 | -0.20 | 0.37 | 0.40 | -3.71 | -3.20 | -0.29 | -0.20 | -0.17 | -0.20 | -1.06 | -0.80 | 0.26 | 0.20 | -0.06 | 0.20 | 0.03 | 0.00 |
| Age: 50 to 61 | 28,255 | -0.75 | -0.60 | 0.16 | 0.40 | -4.49 | -3.60 | -0.30 | -0.20 | -0.06 | 0.00 | -0.25 | 0.00 | 0.23 | 0.20 | -0.08 | 0.20 | 0.12 | 0.00 |
| Age: 62 and over | 33,248 | -0.39 | -0.60 | -0.36 | 0.00 | -6.08 | -5.00 | -0.46 | -0.40 | 0.13 | 0.40 | 1.56 | 1.20 | 0.18 | 0.00 | -0.05 | 0.20 | 0.27 | 0.20 |
| Age: Unknown Age | 8,275 | -0.24 | -0.20 | -0.14 | 0.00 | -5.22 | -4.20 | -0.53 | -0.60 | 0.23 | 0.40 | 0.22 | 0.40 | 0.15 | 0.00 | 0.34 | 0.40 | 0.22 | 0.40 |
| Immigration Status: Native Born | 114,581 | 0.00 | 0.00 | 0.00 | 0.00 | 0.00 | 0.00 | 0.00 | 0.00 | 0.00 | 0.00 | 0.00 | 0.00 | 0.00 | 0.00 | 0.00 | 0.00 | 0.00 | 0.00 |
| Immigration Status: Foreign Born | 14,708 | 0.00 | 0.20 | -0.17 | 0.00 | 2.07 | 1.60 | 0.27 | 0.20 | -0.18 | -0.20 | -0.39 | 0.00 | -0.02 | 0.00 | -0.22 | -0.20 | 0.14 | 0.20 |
| Immigration Status: Recent Immigrant | 2,492 | 0.52 | 0.40 | -0.18 | -0.20 | 5.67 | 4.80 | 0.70 | 0.60 | -0.20 | -0.40 | -0.45 | 0.00 | -0.07 | -0.20 | -0.72 | -0.60 | 0.10 | 0.20 |
| Total | 129,289 | 0.00 | 0.00 | -0.02 | 0.00 | 0.24 | 0.20 | 0.03 | 0.00 | -0.02 | -0.20 | -0.04 | 0.00 | 0.00 | 0.00 | -0.02 | 0.00 | 0.02 | 0.00 |
Table 4: Score Changes from Removal of Individual Credit Characteristics by Scorecard (continued)
(C) Dirty Scorecard
| Demographic Group | Number of Obs. |
Omitted Variable G051: Mean | Omitted Variable G051: Median | Omitted Variable AT36: Mean | Omitted Variable AT36: Median | Omitted Variable S059: Mean | Omitted Variable S059: Median | Omitted Variable G095: Mean | Omitted Variable G095: Median | Omitted Variable S004: Mean | Omitted Variable S004: Median | Omitted Variable AT35: Mean | Omitted Variable AT35: Median | Omitted Variable G059: Mean | Omitted Variable G059: Median | Omitted Variable BC34: Mean | Omitted Variable BC34: Median | Omitted Variable S019: Mean | Omitted Variable S019: Median | Omitted Variable AT03: Mean | Omitted Variable AT03: Median |
| Race or Ethnicity: Non-Hispanic White | 42,004 | 0.00 | 0.00 | 0.00 | 0.00 | 0.00 | 0.00 | 0.00 | 0.00 | 0.00 | 0.00 | 0.00 | 0.00 | 0.00 | 0.00 | 0.00 | 0.00 | 0.00 | 0.00 | 0.00 | 0.00 |
|---|---|---|---|---|---|---|---|---|---|---|---|---|---|---|---|---|---|---|---|---|---|
| Race or Ethnicity: Black | 13,244 | 0.13 | 0.00 | -0.01 | 0.00 | 0.45 | 0.40 | 0.19 | 0.20 | 0.19 | 0.20 | 0.00 | 0.00 | -0.13 | -0.20 | 0.11 | 0.00 | 0.11 | 0.00 | 0.07 | 0.00 |
| Race or Ethnicity: Hispanic | 7,200 | 0.06 | 0.00 | 0.03 | 0.00 | 0.19 | 0.20 | 0.30 | 0.40 | 0.51 | 0.40 | 0.03 | 0.00 | -0.07 | 0.00 | -0.01 | 0.00 | 0.07 | 0.00 | -0.04 | -0.20 |
| Race or Ethnicity: Asian | 1,970 | -0.02 | 0.00 | -0.08 | 0.00 | 0.11 | 0.00 | 0.11 | 0.20 | 0.30 | 0.20 | 0.06 | 0.00 | 0.02 | 0.00 | -0.34 | -0.20 | -0.17 | -0.20 | -0.10 | -0.20 |
| Race or Ethnicity: American Indian | 19 | -0.07 | -0.20 | 0.04 | 0.00 | -0.08 | -0.40 | -0.09 | 0.00 | -0.56 | -0.40 | 0.07 | 0.00 | 0.09 | 0.00 | -0.12 | 0.00 | 0.09 | 0.00 | 0.06 | 0.00 |
| Race or Ethnicity: Missing Race | 7,797 | 0.02 | 0.00 | 0.04 | 0.00 | 0.09 | 0.00 | 0.20 | 0.20 | -0.09 | 0.00 | 0.12 | 0.00 | -0.04 | 0.00 | -0.01 | 0.00 | 0.00 | 0.00 | -0.03 | 0.00 |
| Gender: Male | 34,892 | 0.00 | 0.00 | 0.00 | 0.00 | 0.00 | 0.00 | 0.00 | 0.00 | 0.00 | 0.00 | 0.00 | 0.00 | 0.00 | 0.00 | 0.00 | 0.00 | 0.00 | 0.00 | 0.00 | 0.00 |
| Gender: Female | 34,563 | 0.05 | 0.00 | -0.02 | 0.00 | 0.05 | 0.20 | 0.09 | 0.20 | 0.02 | 0.00 | 0.07 | 0.00 | 0.06 | 0.00 | 0.17 | 0.00 | -0.06 | 0.00 | -0.07 | -0.20 |
| Gender: Unknown | 4,067 | 0.04 | 0.00 | 0.03 | 0.00 | -0.03 | 0.00 | 0.28 | 0.40 | -0.28 | -0.20 | 0.23 | 0.00 | 0.00 | 0.00 | 0.07 | 0.00 | -0.09 | 0.00 | -0.10 | -0.20 |
| Marital Status: Married | 30,637 | 0.00 | 0.00 | 0.00 | 0.00 | 0.00 | 0.00 | 0.00 | 0.00 | 0.00 | 0.00 | 0.00 | 0.00 | 0.00 | 0.00 | 0.00 | 0.00 | 0.00 | 0.00 | 0.00 | 0.00 |
| Marital Status: Single | 25,829 | 0.03 | 0.00 | -0.03 | 0.00 | 0.24 | 0.20 | 0.14 | 0.20 | 0.43 | 0.40 | 0.19 | 0.00 | -0.09 | 0.00 | 0.00 | 0.00 | -0.10 | 0.00 | 0.02 | -0.20 |
| Marital Status: Unknown | 17,056 | 0.07 | 0.00 | -0.07 | 0.00 | 0.23 | 0.20 | 0.18 | 0.20 | 0.70 | 0.60 | 0.21 | 0.00 | -0.16 | -0.20 | 0.02 | 0.00 | -0.07 | 0.00 | 0.05 | -0.20 |
| Marital Status and Gender: Single Female | 12,941 | 0.00 | 0.00 | 0.00 | 0.00 | 0.00 | 0.00 | 0.00 | 0.00 | 0.00 | 0.00 | 0.00 | 0.00 | 0.00 | 0.00 | 0.00 | 0.00 | 0.00 | 0.00 | 0.00 | 0.00 |
| Marital Status and Gender: Single Male | 11,688 | -0.07 | 0.00 | -0.02 | 0.00 | -0.06 | 0.00 | -0.10 | 0.00 | -0.03 | 0.00 | -0.04 | 0.00 | -0.04 | 0.00 | -0.20 | 0.00 | 0.06 | 0.00 | 0.10 | 0.20 |
| Marital Status and Gender: Married Marital Status and Gender: Female |
14,252 | -0.03 | 0.00 | 0.01 | 0.00 | -0.30 | -0.20 | -0.14 | -0.20 | -0.43 | -0.40 | -0.17 | 0.00 | 0.11 | 0.00 | -0.01 | 0.00 | 0.08 | -0.20 | 0.00 | 0.20 |
| Marital Status and Gender: Married Male | 15,065 | -0.08 | 0.00 | 0.03 | 0.00 | -0.24 | -0.20 | -0.22 | -0.20 | -0.45 | -0.20 | -0.26 | 0.00 | 0.03 | 0.00 | -0.19 | 0.00 | 0.18 | 0.00 | 0.05 | 0.20 |
| Marital Status and Gender: Unknown | 19,576 | 0.01 | 0.00 | -0.03 | 0.00 | -0.06 | 0.00 | 0.03 | 0.00 | 0.11 | 0.20 | 0.01 | 0.00 | -0.09 | 0.00 | -0.09 | 0.00 | 0.05 | 0.00 | 0.06 | 0.00 |
| Age: Under 30 | 12,452 | 0.00 | 0.00 | 0.00 | 0.00 | 0.00 | 0.00 | 0.00 | 0.00 | 0.00 | 0.00 | 0.00 | 0.00 | 0.00 | 0.00 | 0.00 | 0.00 | 0.00 | 0.00 | 0.00 | 0.00 |
| Age: 30 - 39 | 17,997 | -0.15 | -0.20 | 0.06 | 0.20 | 0.41 | 0.20 | -0.29 | 0.00 | -1.01 | -1.20 | -0.09 | 0.00 | 0.06 | 0.20 | 0.07 | 0.00 | 0.12 | 0.00 | -0.02 | 0.00 |
| Age: 40 to 49 | 17,827 | -0.21 | -0.20 | 0.17 | 0.20 | 0.43 | 0.20 | -0.44 | -0.20 | -1.46 | -1.40 | -0.16 | 0.00 | 0.12 | 0.20 | -0.02 | 0.00 | 0.16 | 0.00 | 0.01 | 0.20 |
| Age: 50 to 61 | 13,486 | -0.22 | -0.20 | 0.16 | 0.20 | 0.53 | 0.20 | -0.48 | -0.20 | -1.93 | -1.80 | -0.12 | 0.00 | 0.15 | 0.20 | -0.11 | 0.00 | 0.19 | 0.00 | 0.00 | 0.20 |
| Age: 62 and over | 7,701 | -0.40 | -0.40 | 0.19 | 0.20 | 0.36 | 0.00 | -0.29 | 0.20 | -2.80 | -2.60 | 0.05 | 0.00 | 0.18 | 0.40 | -0.18 | 0.00 | 0.15 | 0.00 | 0.04 | 0.20 |
| Age: Unknown Age | 4,059 | -0.16 | -0.20 | 0.15 | 0.20 | 0.30 | 0.00 | -0.08 | 0.20 | -1.61 | -1.40 | 0.11 | 0.00 | 0.06 | 0.20 | -0.04 | 0.00 | 0.06 | 0.00 | -0.06 | 0.00 |
| Immigration Status: Native Born | 65,341 | 0.00 | 0.00 | 0.00 | 0.00 | 0.00 | 0.00 | 0.00 | 0.00 | 0.00 | 0.00 | 0.00 | 0.00 | 0.00 | 0.00 | 0.00 | 0.00 | 0.00 | 0.00 | 0.00 | 0.00 |
| Immigration Status: Foreign Born | 8,181 | -0.04 | 0.00 | 0.03 | 0.00 | 0.09 | 0.20 | 0.13 | 0.00 | 0.38 | 0.20 | -0.01 | 0.00 | 0.01 | 0.00 | -0.26 | 0.00 | -0.11 | -0.20 | -0.08 | -0.20 |
| Immigration Status: Recent Immigrant | 1,020 | -0.02 | 0.00 | 0.06 | 0.00 | 0.00 | 0.20 | 0.40 | 0.00 | 1.67 | 1.40 | 0.09 | 0.20 | -0.03 | 0.00 | -0.41 | -0.20 | -0.18 | -0.20 | -0.11 | -0.20 |
| Total | 73,522 | 0.00 | 0.00 | 0.00 | 0.00 | 0.01 | 0.00 | 0.01 | 0.00 | 0.04 | 0.00 | 0.00 | 0.00 | 0.00 | 0.00 | -0.03 | 0.00 | -0.01 | 0.00 | -0.01 | 0.00 |
| Environment Name | Type of Environment | Estimation Sample | Indicator Variables |
| White Only | Race Neutral | Non-Hispanic Whites | None |
| Race Dummies | Race Neutral | All | Non-Hispanic white, Black, Hispanic, Asian, American Indian, Missing Race |
| Middle Age Only | Age Neutral | Ages 32 to 61 | Variable for each age between 32 and 61 |
| Seniors Only | Age Neutral | Ages 40 and above | Variable for each age between 40 and 74, 75 to 79, 80 to 84, 85 to 89, 90 and above |
| Age Dummies | Age Neutral | All | Variable for each age between 17 and 74, 16 and under, 75 to 79, 80 to 84, 85 to 89, 90 and above |
| Male Only | Gender Neutral | Males | None |
| Female Only | Gender Neutral | Females | None |
| Gender Dummies | Gender Neutral | All | Male, Female, Unknown gender |
Table 6: Score Changes Resulting from Reestimating the Baseline Model in Demographically Neutral Environments
Panel A: Race Neutral Environments
| Baseline Model Scores: Number |
Baseline Model Scores: Mean |
Baseline Model Scores: Median |
Racial Dummies: Mean | Racial Dummies: Median |
White Only: Mean |
White Only: Median |
|
| Race or Ethnicity: Non-Hispanic White | 146,328 | 54.2 | 56.0 | 0.15 | 0.00 | 0.13 | 0.00 |
|---|---|---|---|---|---|---|---|
| Race or Ethnicity: Black | 21,114 | 25.7 | 19.0 | 0.07 | 0.00 | 0.10 | 0.00 |
| Race or Ethnicity: Hispanic | 15,488 | 37.9 | 33.2 | 0.12 | 0.00 | 0.15 | 0.00 |
| Race or Ethnicity: Asian | 8,002 | 54.5 | 55.8 | 0.12 | 0.00 | 0.12 | 0.20 |
| Race or Ethnicity: American Indian | 50 | 58.1 | 62.6 | 0.13 | 0.20 | 0.03 | 0.60 |
| Race or Ethnicity: Missing Race | 36,352 | 51.6 | 52.8 | -0.76 | -0.60 | -0.67 | 0.00 |
Table 6: Score Changes Resulting from Reestimating the Baseline Model in Demographically Neutral Environments
Panel B: Gender Neutral Environments
| Baseline Model Scores: Number |
Baseline Model Scores: Mean |
Baseline Model Scores: Median |
Gender Dummies: Mean |
Gender Dummies: Median |
Male Only: Mean | Male Only: Median |
Female Only: Mean |
Female Only: Median |
|
| Gender: Male | 102,061 | 49.2 | 48.4 | 0.0 | 0.0 | 0.06 | 0.00 | -0.05 | -0.20 |
|---|---|---|---|---|---|---|---|---|---|
| Gender: Female | 105,347 | 50.2 | 50.4 | 0.0 | 0.0 | 0.01 | 0.00 | -0.04 | 0.00 |
| Gender: Unknown | 25,059 | 52.1 | 53.6 | -0.1 | 0.0 | -0.27 | 0.00 | 0.44 | 0.00 |
| Marital Status: Married | 118,089 | 57.3 | 60.4 | 0.0 | 0.0 | 0.02 | 0.00 | -0.06 | -0.20 |
| Marital Status: Single | 68,207 | 44.7 | 42.2 | 0.0 | 0.0 | 0.01 | 0.00 | 0.04 | 0.00 |
| Marital Status: Unknown | 46,171 | 39.2 | 36.2 | 0.0 | 0.0 | -0.05 | 0.00 | 0.13 | 0.00 |
| Marital Status and Gender: Single Female | 32,788 | 44.4 | 41.4 | 0.0 | 0.0 | 0.04 | 0.20 | -0.03 | 0.00 |
| Marital Status and Gender: Single Male | 29,048 | 43.5 | 40.2 | 0.0 | 0.0 | 0.03 | 0.20 | 0.00 | 0.00 |
| Marital Status and Gender: Married Female | 55,126 | 57.7 | 61.4 | 0.0 | 0.0 | 0.00 | 0.20 | -0.08 | -0.20 |
| Marital Status and Gender: Married Male | 54,506 | 56.8 | 59.2 | 0.0 | 0.0 | 0.07 | 0.20 | -0.11 | 0.00 |
| Marital Status and Gender: Unknown | 60,999 | 43.1 | 42.0 | 0.0 | 0.0 | -0.08 | -0.60 | 0.21 | -0.20 |
Table 6: Score Changes Resulting from Reestimating the Baseline Model in Demographically Neutral Environments
Panel C: Age Neutral Environments
| Baseline Model Scores: Number |
Baseline Model Scores: Mean |
Baseline Model Scores: Median |
Age Dummies: Mean |
Age Dummies: Median |
Middle Age: Mean |
Middle Age: Median |
Seniors Only: Mean |
Seniors Only: Median |
|
| Age: Under 30 | 33,011 | 32.4 | 31.6 | -0.34 | 0.00 | -0.39 | 0.20 | -0.45 | -0.20 |
| Age: 30 - 39 | 40,485 | 40.3 | 36.4 | -0.30 | -0.20 | -0.32 | 0.00 | -0.80 | 0.00 |
| Age: 40 to 49 | 46,407 | 47.9 | 46.4 | -0.12 | 0.20 | 0.03 | 0.60 | -0.82 | 0.00 |
| Age: 50 to 61 | 43,474 | 55.5 | 57.4 | 0.30 | 1.20 | 0.61 | 2.00 | -0.47 | 0.40 |
| Age: 62 and over | 44,075 | 67.7 | 75.8 | 1.28 | 1.20 | 1.21 | 0.80 | 1.39 | 1.80 |
| Age: Unknown Age | 25,015 | 52.1 | 53.6 | -1.62 | -0.80 | -2.18 | -2.40 | 1.80 | 0.20 |
| Immigration Status: Native Born | 206,870 | 50.2 | 50.4 | 0.01 | 0.00 | 0.02 | 0.00 | 0.05 | 0.00 |
|---|---|---|---|---|---|---|---|---|---|
| Immigration Status: Foreign Born | 25,597 | 48.3 | 47.6 | -0.11 | -0.40 | -0.13 | 0.00 | -0.41 | -0.40 |
| Immigration Status: Recent Immigrant | 4,261 | 43.7 | 45.4 | -0.63 | -0.60 | -0.73 | -0.20 | -0.71 | -0.60 |
| Attribute Start Point | Baseline Model | Age Neutral: Middle Age | Age Neutral: Seniors Only | Age Neutral: Age Dummies | Clean Scorecard Distribution: Under 30 | Clean Scorecard Distribution: 30 to 39 | Clean Scorecard Distribution: 40 to 49 | Clean Scorecard Distribution: 50 to 61 | Clean Scorecard Distribution: 62 and Older |
| 0 | 0 | 0 | 0 | 0 | 4.49 | 0.52 | 0.21 | 0.11 | 0.02 |
| 10 | 0.44 | 0.00 | 0.00 | 0.46 | 8.64 | 0.97 | 0.47 | 0.22 | 0.09 |
| 16 | 0.77 | 0.15 | 0.48 | 0.77 | 36.40 | 5.57 | 2.85 | 1.56 | 0.80 |
| 34 | 0.89 | 0.16 | 0.48 | 0.87 | 20.43 | 6.19 | 2.76 | 1.68 | 0.92 |
| 45 | 0.98 | 0.35 | 0.67 | 1.02 | 15.39 | 9.86 | 4.68 | 2.87 | 1.58 |
| 56 | 1.15 | 0.55 | 0.88 | 1.23 | 5.67 | 8.33 | 4.23 | 2.47 | 1.31 |
| 62 | 1.15 | 0.61 | 0.95 | 1.26 | 5.46 | 16.31 | 9.64 | 5.48 | 3.14 |
| 71 | 1.27 | 0.76 | 1.17 | 1.41 | 1.64 | 9.96 | 7.24 | 4.37 | 2.22 |
| 76 | 1.34 | 0.84 | 1.21 | 1.50 | 1.25 | 16.38 | 14.54 | 10.36 | 5.60 |
| 85 | 1.40 | 0.93 | 1.30 | 1.59 | 0.59 | 19.36 | 28.53 | 25.07 | 15.54 |
| 104 | 1.48 | 1.12 | 1.34 | 1.69 | 0.02 | 2.48 | 6.43 | 7.50 | 5.34 |
| 110 | 1.49 | 1.12 | 1.44 | 1.75 | 0.02 | 3.94 | 16.33 | 29.29 | 32.07 |
| 153 | 1.57 | 1.52 | 1.65 | 1.94 | 0.00 | 0.12 | 2.05 | 8.22 | 23.44 |
| 225 | 1.69 | 1.52 | 1.93 | 2.16 | 0.00 | 0.00 | 0.05 | 0.81 | 7.93 |
Table 8: Variables Selected in the Baseline Model and the Models Redeveloped in Demographically Neutral Environments
(A1) Thin Scorecard
| Name | Baseline Model | Race Neutral: White Only | Race Neutral: Race Dummies | Age Neutral: Middle Age | Age Neutral: Seniors Only | Age Neutral: Age Dummies | Gender Neutral: Male Only | Gender Neutral: Female Only | Gender Neutral: Gender Dummies |
| Baseline Credit Characteristics: AT24 | X | X | X | X | X | ||||
| Baseline Credit Characteristics: AT28 | X | X | X | X | X | X | |||
| Baseline Credit Characteristics: AT34 | X | X | X | X | X | X | |||
| Baseline Credit Characteristics: AT36 | X | X | X | X | X | X | X | X | X |
| Baseline Credit Characteristics: G002 | X | X | X | X | |||||
| Baseline Credit Characteristics: G096 | X | X | X | X | X | X | X | X | |
| Baseline Credit Characteristics: G103 | X | X | X | X | X | X | X | ||
| Baseline Credit Characteristics: RE20 | X | X | X | X | |||||
| Baseline Credit Characteristics: S059 | X | X | X | X | X | X | X | X | X |
Table 8: Variables Selected in the Baseline Model and the Models Redeveloped in Demographically Neutral Environments
(A2) Thin Scorecard
| Name | Baseline Model | Race Neutral: White Only | Race Neutral: Race Dummies | Age Neutral: Middle Age | Age Neutral: Seniors Only | Age Neutral: Age Dummies | Gender Neutral: Male Only | Gender Neutral: Female Only | Gender Neutral: Gender Dummies |
| Other Credit Characteristics: AT03 | X | ||||||||
| Other Credit Characteristics: AT20 | X | X | |||||||
| Other Credit Characteristics: AT27 | X | ||||||||
| Other Credit Characteristics: BC34 | X | ||||||||
| Other Credit Characteristics: BC98 | X | X | |||||||
| Other Credit Characteristics: G047 | X | X | |||||||
| Other Credit Characteristics: G058 | X | ||||||||
| Other Credit Characteristics: G065 | X | ||||||||
| Other Credit Characteristics: G091 | X | ||||||||
| Other Credit Characteristics: G095 | X | ||||||||
| Other Credit Characteristics: IN06 | X | ||||||||
| Other Credit Characteristics: IN34 | X | ||||||||
| Other Credit Characteristics: MT22 | X | X | X | X | |||||
| Other Credit Characteristics: MT36 | X | ||||||||
| Other Credit Characteristics: PF09 | X | ||||||||
| Other Credit Characteristics: PF34 | X | ||||||||
| Other Credit Characteristics: RE28 | X | ||||||||
| Other Credit Characteristics: RE34 | X | X | X | X | |||||
| Other Credit Characteristics: RT34 | X | X | X | ||||||
| Other Credit Characteristics: S040 | X |
Table 8: Variables Selected in the Baseline Model and the Models Redeveloped in Demographically Neutral Environments (continued)
(B1) Clean Scorecard
| Name | Baseline Model | Race Neutral: White Only | Race Neutral: Race Dummies | Age Neutral: Middle Age | Age Neutral: Seniors Only | Age Neutral: Age Dummies |
Gender Neutral: Male Only |
Gender Neutral: Female Only |
Gender Neutral: Gender Dummies |
| Baseline Credit Characteristics: AT28 | X | X | X | X | X | X | X | X | |
| Baseline Credit Characteristics: AT36 | X | X | X | X | |||||
| Baseline Credit Characteristics: BC29 | X | X | X | X | X | ||||
| Baseline Credit Characteristics: G089 | X | X | X | X | X | X | X | ||
| Baseline Credit Characteristics: G096 | X | X | X | X | |||||
| Baseline Credit Characteristics: RE28 | X | X | X | X | |||||
| Baseline Credit Characteristics: RE34 | X | X | |||||||
| Baseline Credit Characteristics: S004 | X | X | X | X | X | X | X | X | X |
| Baseline Credit Characteristics: S043 | X | X | X | X |
Table 8: Variables Selected in the Baseline Model and the Models Redeveloped in Demographically Neutral Environments (continued)
(B2) Clean Scorecard
| Name | Baseline Model | Race Neutral: White Only | Race Neutral: Race Dummies | Age Neutral: Middle Age | Age Neutral: Seniors Only | Age Neutral: Age Dummies | Gender Neutral: Male Only | Gender Neutral: Female Only | Gender Neutral: Gender Dummies |
| Other Credit Characteristics: AT10 | X | ||||||||
| Other Credit Characteristics: AT11 | X | ||||||||
| Other Credit Characteristics: AT14 | X | ||||||||
| Other Credit Characteristics: AT34 | X | X | X | X | X | ||||
| Other Credit Characteristics: BC13 | X | ||||||||
| Other Credit Characteristics: BC29 | |||||||||
| Other Credit Characteristics: BC30 | X | X | X | ||||||
| Other Credit Characteristics: BC31 | X | ||||||||
| Other Credit Characteristics: BC98 | X | ||||||||
| Other Credit Characteristics: DS33 | X | ||||||||
| Other Credit Characteristics: G007 | X | X | |||||||
| Other Credit Characteristics: G041 | X | X | |||||||
| Other Credit Characteristics: PB07 | X | ||||||||
| Other Credit Characteristics: PB33 | X | ||||||||
| Other Credit Characteristics: PB35 | X | X | |||||||
| Other Credit Characteristics: PB35 | X | ||||||||
| Other Credit Characteristics: RE12 | X | ||||||||
| Other Credit Characteristics: RE20 | X | X | |||||||
| Other Credit Characteristics: RE33 | X | ||||||||
| Other Credit Characteristics: RE35 | X | ||||||||
| Other Credit Characteristics: RT33 | X | ||||||||
| Other Credit Characteristics: S046 | X |
Table 8: Variables Selected in the Baseline Model and the Models Redeveloped in Demographically Neutral Environments (continued)
(C) Dirty Scorecard
| Name | Baseline Model | Race Neutral: White Only | Race Neutral: Race Dummies | Age Neutral: Middle Age | Age Neutral: Seniors Only | Age Neutral: Age Dummies | Gender Neutral: Male Only | Gender Neutral: Female Only | Gender Neutral: Gender Dummies |
| Baseline Credit Characteristics: AT03 | X | X | X | X | |||||
| Baseline Credit Characteristics: AT35 | X | X | X | X | X | X | X | ||
| Baseline Credit Characteristics: AT36 | X | X | X | X | X | X | X | X | X |
| Baseline Credit Characteristics: BC34 | X | X | X | X | X | X | X | X | X |
| Baseline Credit Characteristics: G051 | X | X | X | X | X | X | X | X | |
| Baseline Credit Characteristics: G059 | X | X | X | X | X | ||||
| Baseline Credit Characteristics: G095 | X | X | X | X | X | X | X | X | X |
| Baseline Credit Characteristics: S004 | X | X | X | X | X | X | X | X | X |
| Baseline Credit Characteristics: S019 | X | X | |||||||
| Baseline Credit Characteristics: S059 | X | X | X | X | X | X | X | X | X |
| Other Credit Characteristics: AT10 | X | ||||||||
| Other Credit Characteristics: AT11 | X | ||||||||
| Other Credit Characteristics: G047 | X | ||||||||
| Other Credit Characteristics: G058 | X | ||||||||
| Other Credit Characteristics: G060 | X | X | X | ||||||
| Other Credit Characteristics: G061 | X | ||||||||
| Other Credit Characteristics: G096 | X | X | X | X | |||||
| Other Credit Characteristics: RE28 | X | ||||||||
| Other Credit Characteristics: RE34 | X | X | X |
(C) Dirty Scorecard
Table 9: Credit Score Changes from Constructing Models in Demographically Neutral Environments
Panel A: Racially Neutral Environments
| Baseline: Number | Baseline: Mean | Baseline: Median | Racial Dummies: Mean | Racial Dummies: Median | White Only: Mean | White Only: Median | |
| Race or Ethnicity: Non-Hispanic White | 146,328 | 54.2 | 56.0 | 0.11 | 0.00 | 0.13 | -0.60 |
|---|---|---|---|---|---|---|---|
| Race or Ethnicity: Black | 21,114 | 25.7 | 19.0 | 0.14 | 0.00 | 0.12 | -0.20 |
| Race or Ethnicity: Hispanic | 15,488 | 37.9 | 33.2 | 0.20 | 0.00 | 0.30 | 0.40 |
| Race or Ethnicity: Asian | 8,002 | 54.5 | 55.8 | 0.37 | 0.00 | -0.15 | -1.00 |
| Race or Ethnicity: American Indian | 50 | 58.1 | 62.6 | 0.14 | 0.80 | 0.30 | 0.80 |
| Race or Ethnicity: Missing Race | 36,352 | 51.6 | 52.8 | -0.72 | -0.60 | -0.47 | 2.00 |
Table 9: Credit Score Changes from Constructing Models in Demographically Neutral Environments
Panel B: Gender Neutral Environments
| Baseline: Number | Baseline: Mean | Baseline: Median | Gender Dummies: Mean | Gender Dummies: Median | Male Only: Mean | Male Only: Median |
Female Only: Mean | Female Only: Median | |
| Gender: Male | 102,061 | 49.2 | 48.4 | -0.1 | 0.0 | 0.44 | 1.20 | 0.01 | 0.20 |
|---|---|---|---|---|---|---|---|---|---|
| Gender: Female | 105,347 | 50.2 | 50.4 | 0.1 | 0.0 | -0.16 | 0.20 | -0.38 | -0.20 |
| Gender: Unknown | 25,059 | 52.1 | 53.6 | 0.0 | 0.0 | -0.86 | -4.60 | 1.90 | 0.00 |
| Marital Status: Married | 118,089 | 57.3 | 60.4 | -0.1 | 0.0 | -0.05 | 0.20 | -0.22 | 0.00 |
| Marital Status: Single | 68,207 | 44.7 | 42.2 | 0.1 | 0.0 | -0.05 | 0.00 | 0.20 | 0.00 |
| Marital Status: Unknown | 46,171 | 39.2 | 36.2 | 0.0 | 0.0 | 0.35 | -0.20 | 0.45 | -0.40 |
| Marital Status and Gender: Single Female | 32,788 | 44.4 | 41.4 | 0.1 | 0.0 | -0.14 | 0.00 | -0.14 | 0.20 |
| Marital Status and Gender: Single Male | 29,048 | 43.5 | 40.2 | 0.1 | 0.0 | 0.43 | 0.80 | 0.20 | 0.20 |
| Marital Status and Gender: Married Female | 55,126 | 57.7 | 61.4 | 0.0 | 0.0 | -0.29 | 0.00 | -0.61 | -0.60 |
| Marital Status and Gender: Married Male | 54,506 | 56.8 | 59.2 | -0.1 | 0.0 | 0.39 | 1.20 | -0.13 | 0.40 |
| Marital Status and Gender: Unknown | 60,999 | 43.1 | 42.0 | 0.0 | 0.0 | -0.10 | -0.80 | 0.80 | -0.80 |
Table 9: Credit Score Changes from Constructing Models in Demographically Neutral Environments
Panel C: Age Neutral Environments
| Baseline: Number | Baseline: Mean | Baseline: Median | Age Dummies: Mean | Age Dummies: Median | Middle Age: Mean | Middle Age: Median | Seniors Only: Mean | Seniors Only: Median | |
| Age: Under 30 | 33,011 | 32.4 | 31.6 | -1.39 | -0.80 | -0.36 | 0.20 | 0.15 | -0.20 |
|---|---|---|---|---|---|---|---|---|---|
| Age: 30 - 39 | 40,485 | 40.3 | 36.4 | -0.56 | -0.40 | -0.52 | -0.20 | -0.85 | -0.40 |
| Age: 40 to 49 | 46,407 | 47.9 | 46.4 | -0.10 | 0.40 | -0.21 | 0.80 | -1.16 | 0.40 |
| Age: 50 to 61 | 43,474 | 55.5 | 57.4 | 0.31 | 1.20 | 0.68 | 3.00 | -0.96 | 0.00 |
| Age: 62 and over | 44,075 | 67.7 | 75.8 | 1.87 | 1.00 | 1.66 | 1.60 | 1.67 | 2.00 |
| Age: Unknown Age | 25,015 | 52.1 | 53.6 | -0.91 | 0.40 | -2.39 | -1.60 | 2.10 | 1.20 |
| Immigration Status: Native Born | 206,870 | 50.2 | 50.4 | 0.05 | 0.00 | 0.04 | 0.00 | 0.04 | 0.00 |
| Immigration Status: Foreign Born | 25,597 | 48.3 | 47.6 | -0.38 | -0.60 | -0.27 | 0.00 | -0.22 | -0.40 |
| Immigration Status: Recent Immigrant | 4,261 | 43.7 | 45.4 | -1.34 | -1.20 | -0.65 | -0.60 | 0.23 | -1.00 |