
Demand for M2 at the Zero Lower Bound: The Recent U.S. Experience1
Keywords: Money demand, M2, zero lower bound, opportunity cost
Abstract:
1 Introduction
Monetary aggregates have been used, at times, as targets of monetary policy.2 Even when money growth is not targeted per se, monitoring and forecasting money demand remains a useful guide in the conduct of monetary policy because the demand for money is thought to be associated with economic activity.
In this paper, we present comparisons of forecast performance for two basic models of money demand that incorporate the observations from the past decade with a focus on the in-sample and out-of-sample performance of the models during the past few years, when opportunity cost has been negative. This reassessment of the relationship between money and key variables contributes to the literature on money demand in two ways: First, using recent data, we document a stable relationship between opportunity cost and M2 from the mid-1990s through 2011 once a small adjustment is made to the specification of opportunity cost when that cost is low. We further show that the relationship broke down over the past several quarters, and we propose some possible explanations for this shift. Although the paucity of the observations now available makes our conclusions necessarily tentative, we fail to find evidence of an increase in interest sensitivity through 2011. Rather, we find that M2 demand has generally conformed to the functional form proposed by (Moore et al., 1990), which allowed for negative opportunity cost even though such an event was nearly unimaginable to the original authors and was certainly outside the observed values in their estimation sample.
In traditional formulations, money demand is a function of a scale variable and the opportunity cost of holding money. If the elasticity of money demand with respect to the opportunity cost is known and if the relationship between money and the scale variable is stable, then the observation of money and interest rate data can help to predict nominal output. At a practical level, money data are typically more quickly and directly observed than income data. In the United States, for example, money data are observed at a weekly frequency with a lag of only a week or two, while GDP data are observed only quarterly with a minimum lag of nearly a month after the end of each quarter. Data on interest rates--our standard measure of the opportunity cost of holding M2 is the spread between the three-month Treasury bill yield and the average return on M2 assets--are also observed at a weekly frequency.
Part of the reason for the decreased role of money in policy discussions is that the relationship of money with other macroeconomic variables has not been stable.3 While money does not currently hold the primary role as a policy tool or a policy target in the United States, for both practical and theoretical reasons, the Federal Reserve Board collects, analyzes, and publishes a broad array of data on M2 and its components. M2 is a broad monetary aggregate that includes currency, savings and checking deposits, money market mutual fund holdings, and small time deposits.4
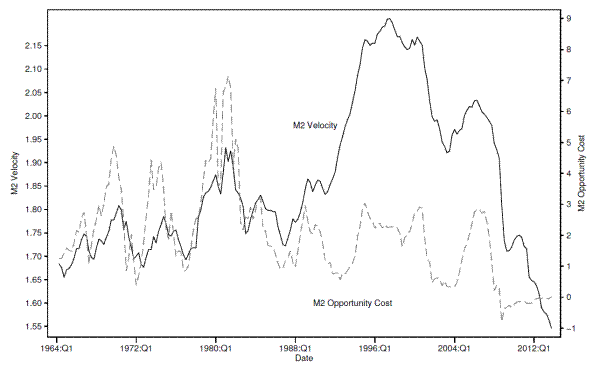
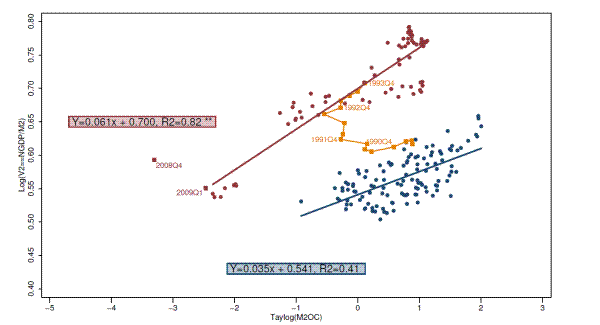
The literature on money demand has been inconclusive about whether or not there has been a stable relationship between money and macroeconomic variables. (Moore et al., 1990) find that the relationship between M2 velocity--the ratio of nominal GDP to M2--and the opportunity cost of M2 was stable over the period 1959 to 1989. Figure 1 illustrates their close linkage during the post-war period until the 1980s. Seemingly, the close relationship broke down temporarily thereafter, as M2 velocity continued to increase while M2 opportunity cost dropped and remained low; put differently, money growth was weaker than predicted by the opportunity cost of holding money. The literature commonly refers to that phenomenon in the early 1990s as the velocity shift (e.g., (Orphanides & Porter, 2000), (Lown et al., 1999), (Duca, 2000), and (Carpenter & Lange, 2003)). As explanations for the velocity shift in previous studies proved unsatisfactory, we take an agnostic approach and treat the velocity shift as an exogenous phenomenon and discard the period from 1990 to 1993 from our estimation sample. In the mid-1990s, a stable relationship between M2 demand, conditional on GDP, and M2 opportunity cost seems to re-emerge, as the series for M2 velocity and M2 opportunity cost in Figure 1 resume similar trends, albeit with a larger intercept than previously. Yet, as of the mid-2000s, empirical studies were still inconclusive about the stability of the parameters of money demand in recent times.
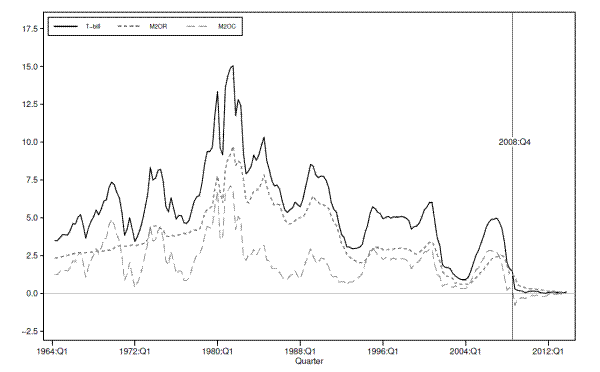
As the financial crisis that began in 2007 intensified in late 2008, M2 opportunity cost fell to negative levels and has remained negative since as short-term market rates dropped substantially while the own rate on M2 declined only slowly (see Figure 2). In such cases, standard money-demand theory suggests that the interest sensitivity of money demand should rise.5 In the extreme case, the money demand curve is horizontal, which, in turn, renders monetary policy ineffective as an increase in money supply has no interest rate effects and hence no effect on output and prices.6
The remainder of the paper proceeds as follows: Section 2 briefly reviews the evolution of the relationship between money, income, and interest rates. Section 3 specifies the econometric models used in this study. Section 4 presents the estimation results. Section 5 concludes.7
2 Evolution of the Relationship between Money, Income, and Interest Rates
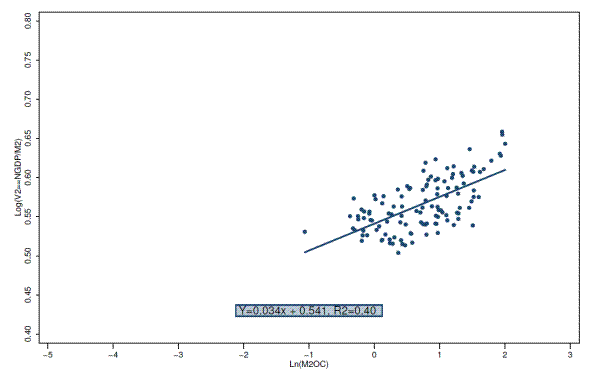
Over the past decade or so, we have been questioning whether or not there has been a relatively stable relationship between M2 velocity, the ratio of nominal GDP to M2, and the opportunity cost of M2. As demonstrated in (Moore et al., 1990), a relatively stable relationship existed between M2 velocity and the opportunity cost of M2 from 1959 to 1989 (Figure 3). Beginning around 1990, however, this relationship appeared to break down, as the velocity of M2 increased beyond the range that changes in opportunity cost would explain (Figure 4), or, equivalently, M2 seemed to be lower than the existing statistical relationship would have indicated. Several possible explanations for this change have been proposed, but none has proved fully satisfactory.8 Our goal in this paper is not to model this phenomenon, but to understand and describe the more recent behavior of money. As a result, we remain agnostic as to the underlying causes and take the velocity shift episode of the early 1990s to be exogenous.
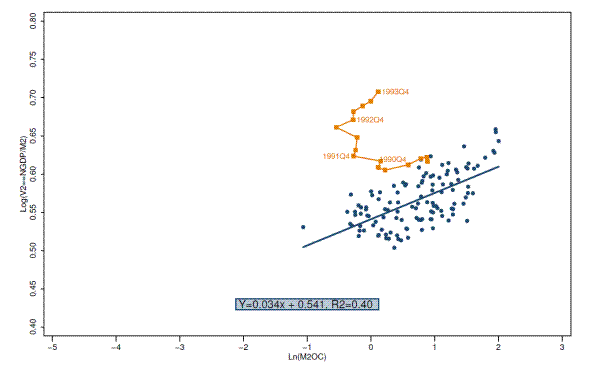
Starting in the mid-1990s, it seemed that a stable relationship between M2 velocity and opportunity cost could have returned, albeit with a significantly higher intercept and possibly a higher slope as well (Figure 5). That is, it appeared that velocity had shifted up, and the period from about 1990 to about 1994 came to be referred to as the velocity-shift period. The larger estimated slope suggested that money demand had become more sensitive to changes in interest rates. The next few years seemed to solidify the impression that velocity had shifted up (Figures 6, 7, and 8), and as of about 2002, the slope estimated with available data was about double that of the 1959-1989 period. Additional data accumulated over the next several years continued to suggest a velocity shift (Figure 9) and, with the recent easing cycle, provided data points over a wide range of values for opportunity cost. It now appears that about half of the velocity-shift period from 1990 to 1994 has, at least in this view of the data, become part of the post velocity-shift period.9
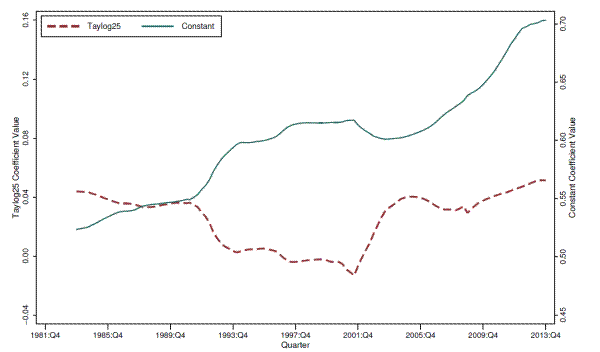
The figures presented are quite suggestive, but in no way conclusive. An effort to re-estimate the models in 2006 was considered but deferred when even the simplest regression estimates yielded results that were extremely sensitive to small changes in the sample period ((Carpenter & Judson, 2006)). As additional data accumulated, the stability of estimates improved, but remained problematic, as can be seen from a simple plot of coefficient estimates extending through 2012 (Figure 10).10 As of now, however, the estimates are somewhat more stable: we now conclude that the post velocity-shift period has a somewhat larger elasticity than the three decades ending in 1990.11 Nevertheless, the coefficient estimates are still sufficiently sensitive to the sample period chosen that we are reluctant to consider the estimates presented later in this paper "set in stone" just yet, and results discussed in later sections will confirm the prudence of this approach.
3 Econometric Models
In this paper, we explore two standard models of M2 demand: (1) the conference aggregate model, which is based on an error-correction specification, building in considerable lag effects, and (2) the static model, which assumes that nominal GDP and M2 opportunity cost affect money demand only contemporaneously.12
3.1 The Static Model
The static model is the most basic model, and is based on the assumption that M2 velocity--the ratio of income to M2--moves with changes in the opportunity cost of money. Stated differently, money demand has a unitary elasticity with respect to nominal income, conditional on the level of the opportunity cost. The specification is
where ![]() is nominal GDP,
is nominal GDP, ![]() is M2,
is M2, ![]() is the opportunity cost of M2, and
is the opportunity cost of M2, and ![]() is a dummy variable that equals 1 after 1994:Q2 and zero otherwise. The
velocity-shift period 1990:Q1 to 1994:Q2 is excluded from the estimation.
is a dummy variable that equals 1 after 1994:Q2 and zero otherwise. The
velocity-shift period 1990:Q1 to 1994:Q2 is excluded from the estimation.
3.2 The Conference Aggregate Model
The conference aggregate (CA) model is based on an error-correction (EC) model, which can be thought of as a variant of a co-integrated or unit root model, although it developed somewhat independently.13 In an EC model, trending variables are tied together in a fundamental relationship, described by an equilibrium equation. In the case of the CA model, velocity is assumed to have a long-run equilibrium relationship with the natural log of the opportunity cost of holding M2, with stationary errors:
where ![]() is the two-quarter moving average of nominal GDP,
is the two-quarter moving average of nominal GDP, ![]() is M2,
is M2,
![]() is the opportunity cost of M2, and
is the opportunity cost of M2, and ![]() is a time-trend variable with
increments of 1 in each quarter (equals 1 in 1946:1). The use of velocity as the dependent variable in the equilibrium equation imposes a unitary elasticity of money with respect to income, a restriction not rejected in the original (Moore et al., 1990) estimation.
The taylog is a transformation set equal to the natural log when opportunity cost is greater than some small critical value and equal to the linear Taylor approximation of the log function for smaller values. (Moore et al., 1990) chose a cutoff value of 50 basis
points; as will be discussed later, we find that a cutoff value of 25 basis points fits the data better and is more akin to a "zero lower bound".
is a time-trend variable with
increments of 1 in each quarter (equals 1 in 1946:1). The use of velocity as the dependent variable in the equilibrium equation imposes a unitary elasticity of money with respect to income, a restriction not rejected in the original (Moore et al., 1990) estimation.
The taylog is a transformation set equal to the natural log when opportunity cost is greater than some small critical value and equal to the linear Taylor approximation of the log function for smaller values. (Moore et al., 1990) chose a cutoff value of 50 basis
points; as will be discussed later, we find that a cutoff value of 25 basis points fits the data better and is more akin to a "zero lower bound".
Out of equilibrium, changes in M2 are assumed to be a function of the deviation from the equilibrium condition in the previous period, changes in opportunity cost, changes in lagged M2, changes in lagged income, and two indicator variables:
where ![]() denotes nominal personal consumption expenditure, which is used as a measure for output in place of nominal GDP, as suggested by (Moore et al.,
1990) to improve the fit of the model. The dummy variable
denotes nominal personal consumption expenditure, which is used as a measure for output in place of nominal GDP, as suggested by (Moore et al.,
1990) to improve the fit of the model. The dummy variable
![]() is an indicator for the introduction of Money Market Demand Accounts and is set to 1 in 1983:Q1 and zero otherwise. The variable
is an indicator for the introduction of Money Market Demand Accounts and is set to 1 in 1983:Q1 and zero otherwise. The variable
![]() indicates the implementation and removal of credit controls in the year 1980; the dummy variable equals 1 in 1980:Q2, -1 in 1980:Q3, and zero otherwise. Each of these phenomena
were ex post identified as having had a discrete effect on the growth of money around the events, but, by construction, are assumed to have had only transitory effects.
indicates the implementation and removal of credit controls in the year 1980; the dummy variable equals 1 in 1980:Q2, -1 in 1980:Q3, and zero otherwise. Each of these phenomena
were ex post identified as having had a discrete effect on the growth of money around the events, but, by construction, are assumed to have had only transitory effects.
For ease in estimation, these equations can be combined into one linear equation by substituting for the lagged error term:14
The sample estimation period for the coefficients now used is from 1959 to 1989 for the conference aggregate model and from 1964 to 1996 excluding 1990 to 1994 for the static model. The coefficients on
![]() and
and
![]() terms in the short-run dynamics are restricted to sum to one, a restriction not rejected by an F-test for the estimation period used in the original model. This restriction
makes the unitary elasticity assumption from the equilibrium equation hold in the dynamic equation.
terms in the short-run dynamics are restricted to sum to one, a restriction not rejected by an F-test for the estimation period used in the original model. This restriction
makes the unitary elasticity assumption from the equilibrium equation hold in the dynamic equation.
4.1 Data
We use quarterly U.S. data over the period from 1960 through 2013:Q1. All data are available on the Federal Reserve Economic Data web page maintained by the Federal Reserve Bank of St. Louis.
Following (Moore et al., 1990) and (Carpenter & Lange, 2003), among others, we rely on the spread between the three-month Treasury bill yield and the rate on M2 assets, rather than the three-month Treasury bill yield per se, in order to eliminate a potential identification bias as the interest rate is possibly influenced by money demand. The rate on M2 assets (hereafter referred to as M2 own rate) is defined as the share-weighted average rate on M2 components, with yields on currency and demand deposits equal to zero (refer to the appendix for more details on the construction of the M2 rate).15
4.2.1 Overview
We compare forecast performance for the two primary models, the static and conference aggregate, using three specifications for the calculation of negative M2 opportunity cost, for two estimation periods and three forecast sample periods. Based on those comparisons, we then examine the forecast performance of the best-performing models under a few alternate specifications. In general, we find that the best forecast performance is obtained by using the conference aggregate model with updated coefficients and a slightly different Taylor approximation from that used in the conference aggregate model, around 25 basis points for low levels of M2 opportunity cost. We further find that improved forecast performance might be obtained by redefining M2 opportunity cost to be the spread between the 10-year bond rate and the M2 own rate, and by using GDP rather than PCE in parts of the specification. So far, we find no evidence of an increase in the interest elasticity of money.
4.2.2 Estimation Periods and Data Adjustments
We estimate two sets of coefficients for each model: a sample very similar to that originally specified, the "original" coefficients; and an updated sample from 1994 to 2008:Q3, the "updated" coefficients. We examine the forecast performance of each model over three periods: First, the years immediately preceding the crisis, 2001-2007; second, from 2009:Q2 through 2011:Q1; third, from 2009:Q2 through 2013:Q1. The conference aggregate model forecasts are dynamic simulations: that is, after an initial date chosen to be relatively far in the past, they use only forecasted values of M2 to generate later forecasts.
Although we would generally not focus separately on the second sample period (ending in 2011:Q1), we consider this comparison useful in this case because M2 growth in the subsequent quarters was affected by factors that are likely to be transitory in growth rate terms and unrelated to the fundamental relationship between money demand and opportunity cost: in April 2011, FDIC deposit insurance rate assessments shifted to a different framework that among many other features, reduced institutions' incentives to keep deposits offshore. As a result of this change, such deposits, which are not part of M2, declined dramatically and M2 deposits increased at an unusually rapid pace. The estimated magnitude of these deposit shifts was about $300 billion over the second and third quarters of 2011. As will be discussed later, we conjecture that there might have been additional shifts due to the FDIC policy change later. Moreover, we believe that another policy change that occurred at about the same time, allowing for payment of interest on demand deposit accounts, might likewise have generated shifts from non-M2 assets into M2. Finally, the Federal Reserve's quantitative easing programs have likely contributed indirectly to M2 growth. Estimating the magnitude of these factors is beyond the scope of this paper for now. We therefore present forecast performance comparisons for the period that ended just before this policy began as well as comparisons that include this period with both adjusted and unadjusted M2 data.
4.2.3 Opportunity Cost Specifications
We present estimates using three specifications for low values of M2 opportunity cost. Both models generally use the log of M2 opportunity cost, but an alternative must be used when these values are negative. First, we use the original conference aggregate specification, which calls for the Taylor approximation of the log of M2 opportunity cost when that cost is below 50 basis points; we refer to this calculation of M2 opportunity cost as Taylog50. Second, we use a modification of this Taylor approximation, around 25 basis points rather than 50 basis points. This lower level has an intuitive appeal because it is closer to what we would consider "zero"; indeed, the current target range for the federal funds rate is zero to 25 basis points. Moreover, a simple grid search based on the fit of the static model from 1994 to 2012 indicated that the optimal value for the Taylor approximation is 22 basis points. We refer to this M2 opportunity cost specification as Taylog25. Finally, we use a specification that sets M2 opportunity cost to the log of 1 basis point when M2 opportunity cost is at or below zero, an approach developed late in 2008 when opportunity cost plummeted. We refer to this specification as Taylog00.
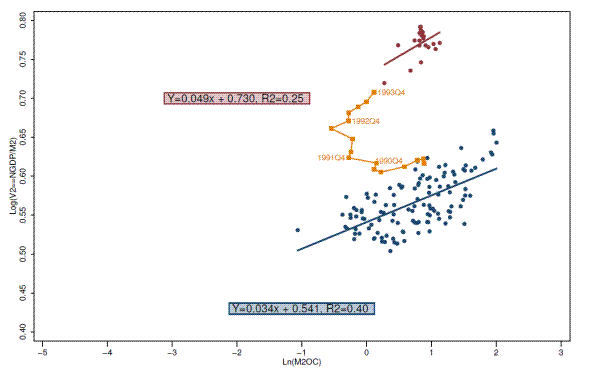
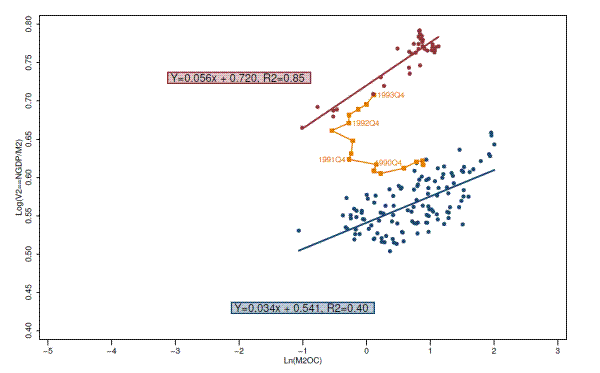
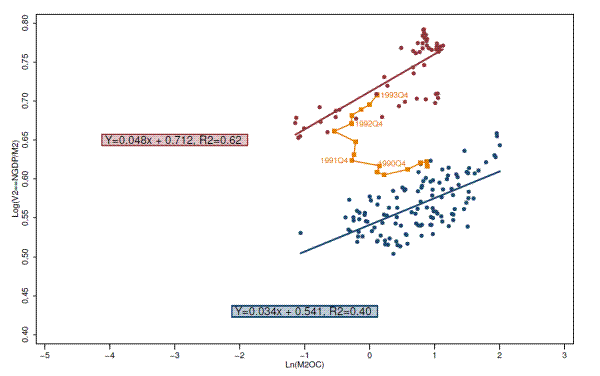
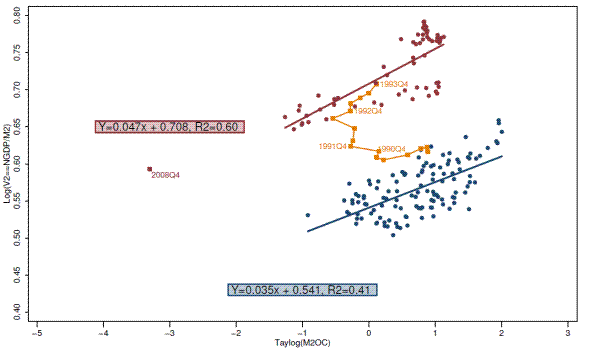
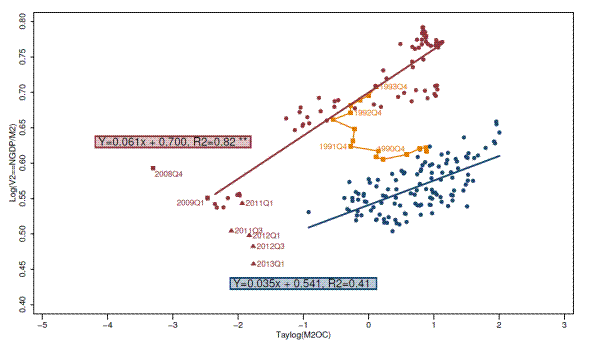
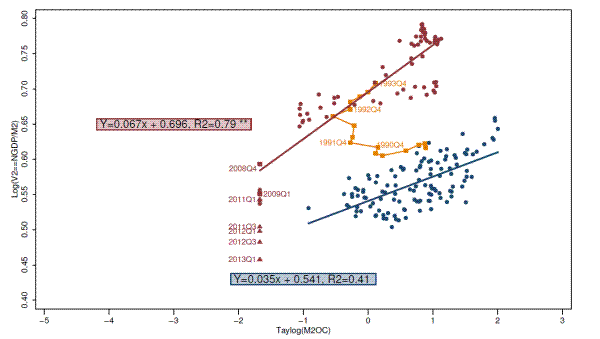
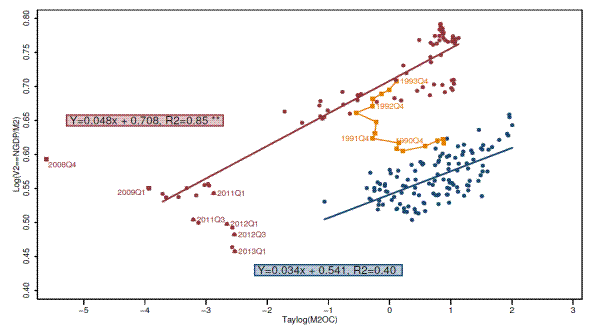
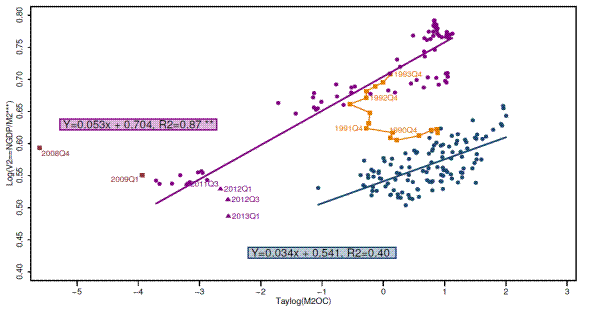
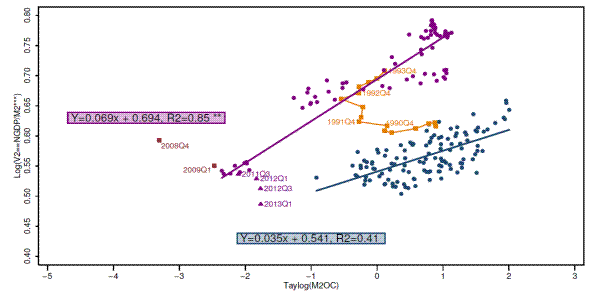
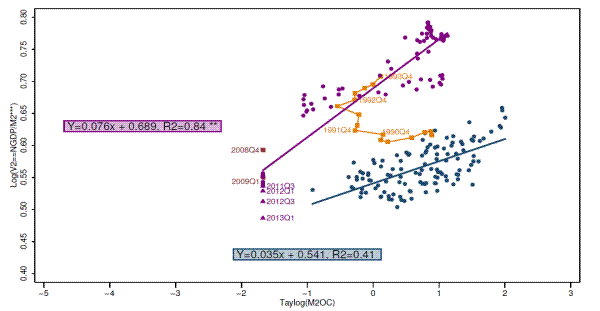
Figures 11 through 16 present the data using the various specifications of M2 opportunity cost and the adjustment to M2 related to the FDIC policy change. It is evident from Figure 8 as well as the subsequent figures that the observation for 2008:Q4 is an outlier; it was at this point that Taylog00 was introduced. Figure 11 displays the data using Taylog50 and unadjusted M2. As can be seen, it seems that the set of recent points has shifted lower and is more vertical. Figure 12 displays the data with the "constrained" Taylog00; this adjustment seems to move the data away from the relationships in place earlier. However, the observations from 2009 to 2011 seem much more consistent with earlier relationships with two adjustments: calculating M2 opportunity cost as Taylog25 and reducing M2 by the estimated magnitude of the movements associated with the FDIC policy shift. Figure 13 incorporates the first adjustment, the use of Taylog25 for low opportunity cost. In this figure, the most recent observations still seem to lie below recent observations, which might indicate a change in the functional form for money demand. However, once the adjustment to M2 is incorporated, as in Figure 14, the longer-term relationship seems to re-emerge. For reference, Figures 15 and 16 display Taylog50 and Taylog00 with adjusted M2; even for Taylog50, the relationship seems to be generally in line with historical data.
4.2.4 Forecast Performance
Table I presents baseline in-sample forecast performance statistics for two models and two estimation periods. Based on this comparison, the best model is the conference aggregate model with updated coefficients. This result should not be surprising: The conference aggregate model is designed to more accurately capture the slow adjustment of M2 to interest rate movements, and the relationship between velocity and opportunity cost likely did change from the early sample (1964-1989) to the more recent sample, as is evident from the blue and red or purple scatter dots in the earlier figures.
Table II presents a summary of in-sample forecast performance from 2009:Q2 to 2011:Q1, the upper panel, and from 2009:Q2 to 2013:Q1, the lower panel. For the sample through 2011, the performance of the baseline Taylog50 specification, the first two rows, is about in line with the performance of the two models over the pre-crisis years (Table I) when updated coefficients are used, but model performance is weaker overall for the sample that extends through 2013.16 Over both forecast samples, the lowest mean absolute errors (MAE) and root mean squared errors (RMSE) are obtained with the Taylog25 opportunity cost specification, the conference aggregate model, and updated coefficients.
To be sure, the largest gains come from the richer dynamic model; holding these factors constant, the various opportunity cost specifications are relatively close.
Table III presents statistics on out-of-sample model performance over the same forecast periods as in Table II, and for two estimation periods: the "original" period, 1964 - 1989, and the "updated" period, 1994 - 2008:Q3. The latter period was chosen to begin at the end of the velocity shift as understood in earlier years; as noted above, current data suggest that the velocity shift might have ended somewhat earlier. The best results are obtained from the conference aggregate model and the original Taylog50 specification for M2 opportunity cost. Interestingly, for Taylog00, the original coefficients yield better results than the updated coefficients.17
4.2.5 Forecast Performance: Alternate Specifications
Table IV summarizes the results of some experimentation with alternate specifications. In particular, we examine nine adjustments to the conference aggregate model presented above, as indicated by the nine columns of the table. First, we test the performance of a specification that uses nominal GDP rather than nominal personal consumption expenditure (PCE) in the model's dynamic equation. This modification generates model improvements for all three specifications. Next, we test the reverse: using nominal PCE as the scale variable in the equilibrium equation. This modification never yields an improvement in performance. The third and fourth modifications are adjustments to the lag length of the adjustment equation. A shorter lag length yields a modest improvement in some cases. Fifth, we test a relaxation of the constraint that imposes unit elasticity on the relationship between money and income. Relaxing this constraint produces improved in-sample results. Next, we examine an alternative specification of opportunity cost that measures M2OC as the gap between the 10-year bond rate and the M2 own rate. This adjustment yields significant improvements in forecast performance over the recent period, perhaps because this measurement results in an M2OC that is strictly positive over the forecast period. Adding the yield curve separately, the seventh adjustment, provides weaker results. The last two adjustments are meant to capture uncertainty: theory and experience suggest that demand for the safety of M2 assets increases with market volatility. Generally in line with the earlier results of (Carpenter & Judson, 2006), we do not find any noticeable improvement with either the VIX or expected inflation except for the Taylog00 specification. These results suggest the directions in which a comprehensive respecification might move: use of GDP as the sole scale variable and an alternative specification of M2OC.
4.2.6 Evidence of a Change in the Interest Sensitivity of Money
As mentioned above, visual examination of the data does not provide strong evidence of a rise in the interest sensitivity of money in the past three years. Figure 17 presents a somewhat more formal test. We estimate spline regressions with knots at three different values: 5.67 basis points, 10 basis points, and 25 basis points. The first knot value, 5.67 basis points, was chosen on the basis of a grid search. In these regressions, we would take a significant difference between the slopes of the two segments as an indication of a change in the interest sensitivity of money. As can be seen, the slopes of the segments are never much different visually, and the t-statistics are correspondingly low, as seen in Table V. We conclude that, at least for now, there is no evidence of a change in the demand curve for M2 through the early period of negative M2 opportunity cost.
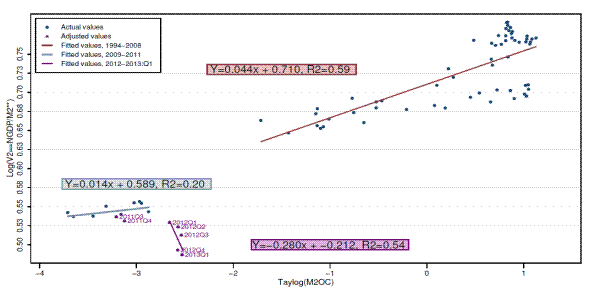
Figure 18 includes the most recent observations, estimates separate slope coefficients without constraining the overall regression line to be continuous, and estimates a coefficient for the most recent period, from 2012:Q1 through 2013:Q1. As can be seen, the slope of the second period is considerably flatter, and the slope for the most recent period is considerably steeper and negative. We have several conjectures about factors that might be driving these results, and so we consider it too early to make any definitive conclusions.
The factors worth further investigation are as follows. First, as can be seen in Figure 2, the M2 own rate adjusted only slowly to market rates following the latter's steep decline in 2008, and have only recently reached a level consistent with interest rates near zero. This slow adjustment is not unusual, as documented in (Driscoll & Judson, 2013). However, in thinking about the behavior of money at the zero lower bound, it is possible that the most recent period is the most relevant. The second factor, as mentioned above, is that policy changes and the indirect effects of quantitative easing might be generating M2 expansion that is unrelated to the zero lower bound. In Figure 18, the distance between the 2013:Q1 data point, log velocity of about 0.49, and a "normal" velocity of about 0.55 or 0.56 is equivalent to about $600 billion to $700 billion in M2 terms. We cannot rule out that policy shifts and the indirect effects of about $1 trillion in quantitative easing could have generated such growth in M2. For comparison, demand deposits (on which interest rate restrictions were lifted in mid-2011), rose by over $400 billion from early 2011 to mid-2013. It is not known how much of this increase came from within M2 and how much came from outside M2. Similarly, quantitative easing has generated substantial increases in banks' cash holdings, an asset, and banks might have raised deposits, including those that are part of M2, to fund these assets. U.S. banks' holdings of Federal Reserve balances increased on the order of $500 billion over 2012 and 2013 to date. Again, it is not known how much of the increase in Federal Reserve balances might have been associated with higher M2 deposits. Further investigation is needed to determine whether and how much these factors might have contributed to M2 deposits; if the magnitudes are large, analyses of the relationship between M2 and opportunity cost would need to take these shifts into account, similar to the level-shift adjustment we were able to make on the mid-2011 and later data based on shifts in M2 that were known to be related to regulatory changes rather than other macroeconomic factors. We consider it entirely possible that, once increases in M2 driven by regulatory changes and the indirect effects of quantitative easing are controlled for, the relationship between M2 and opportunity cost will remain.
5 Conclusion
In sum, our examination of the performance of standard models of M2 demand during recent years, when the opportunity cost of M2 dropped below zero, indicates that these models can still provide useful forecasts of M2, albeit with somewhat larger forecast errors than in the pre-crisis years. We further find that these models, which rely on the relationship between M2 velocity, or the ratio of nominal income to M2, and opportunity cost, or the difference between the 3-month Treasury bill yield (or some other market rate) and the return on M2 assets, can be adjusted to recent circumstances and, with those adjustments, can provide forecast performance that is nearly as good as it was earlier. Specifically, in-sample model performance improves with a refinement of the treatment of negative values of opportunity cost, with updated coefficients.18 We further find that, once the data are adjusted for the immediate impact of a mid-2011 regulatory change, there was no identifiable evidence for a change in the demand curve for M2 as of early 2011. However, a distinct change emerged in late 2011 and over the most recent quarters. This change might signal a fundamental shift in the relationship between M2 and opportunity cost, or it might be the by-product of regulatory changes and quantitative easing; more research is needed on this question.
Looking forward, tests of alternative specifications indicate some of the more promising directions for superior forecasting models. Such models would, of course, also benefit from more precise measurement or modeling of the impact of the change in the FDIC assessment structure and, possibly, the extreme swings in opportunity cost observed in late 2008 and early 2009.
Bibliography
Journal of Money, Credit and Banking 38(6):1659-1667.
Working Paper, Board of Governors of the Federal Reserve System (U.S.) .
Board of Governors of the Federal Reserve System (U.S.), Finance and Economics Discussion Series 2003-3 .
Board of Governors of the Federal Reserve System (U.S.), Finance and Economics Discussion Series 2013-80 .
Journal of Money, Credit and Banking 32:820-839.
Econometrica 55(2):251-76.
Oxford Bulletin of Economics and Statistics 52(2):169-210.
Journal of Economic Literature 20(3):993-1023.
Board of Governors of the Federal Reserve System (U.S.), International Finance Discussion Papers 2012-1058 .
Federal Reserve Bank of Dallas Financial Industry Studies Working Paper.
Financial sectors in Open Economies: Empirical analysis and policy issues, Federal Reserve System, Board of Governors pp. 21-105.
Macroeconomic Dynamics 13(5):553-579.
Journal of Economics and Business 52(1-2):87-100.
Appendix: Construction of M2 Opportunity Cost and the M2 Own Rate
In these models, M2 opportunity cost is estimated as the 3-month Treasury bill yield less the M2 own rate, which is calculated as the weighted average of rates paid on each of the four major components of M2: currency, small time deposits, money market mutual funds, and liquid deposits. The primary data sources for these estimates are displayed in Table VI and include the FR2042 deposit rate survey, which was discontinued in 1997; bank and thrift Call Report data; aggregate data from Bank Rate Monitor, a commercial firm; and data from iMoneyNet's Money Fund Report. Table VII reports characteristics of the source datasets by type of institution. Construction of rates for the first three of these items, each of which accounts for approximately ten percent of M2, is fairly simple. The construction of the rate on liquid deposits, which account for the remaining two-thirds of M2, is more complex. The construction of the rate for each component is described in turn. Notably, although the FR2042 survey was discontinued in 1997, the newer calculation methods are used beginning in 1995 in order to have the longest possible consistent time series. Comparisons of the data for the period over which all data sources were available indicated that the FR2042-based methods and the methods used later generally produced similar rate estimates.
Appendix A Currency
The rate for currency is zero: holding currency is assumed to have no monetary benefits or costs. It should be noted that the currency component of M2 includes all U.S. currency held outside banks, including the sizable portion of U.S. currency estimated to be in circulating outside the United States.
Appendix B Small Time Deposits
The average rate paid on small time deposits is estimated differently before and after 1997, the end of the FR2042 deposit rate survey. Prior to 1997, the commercial bank small time rate was constructed as the deposit-weighted average of the 6-month small-time rate as reported on the FR2042 survey. For thrifts, deposit-weighted 6-month small time rate data from the thrift Call Report were used.
Beginning in 1997, thrift and commercial bank small time rates were estimated using the six-month small time rate as reported by Bank Rate Monitor. This source provides an estimate of rates offered on new deposits. We construct the average small time rate paid at all institutions as the deposit-weighted average of Bank Rate Monitor's average rates paid at banks and thrifts. These rates are constructed as the simple average of rates offered at the top five banks and top five thrifts in each of the ten largest U.S. metropolitan markets.
Appendix C Money Market Mutual Funds (MMMF)
The rate for money market mutual funds (MMMF) is the tax-free rate as reported by iMoneyNet.
Appendix D Liquid Deposits
Liquid deposits, which account for about two-thirds of M2, comprise demand deposit accounts, savings accounts, and other checkable deposits. In our rate calculations, we divide liquid deposits into three components: demand deposit accounts, commercial bank savings and checking deposits, and thrift savings and checking deposits. Savings and checking deposits are known collectively as OMS, an abbreviation for Other Checkable Deposits (OCDs), Money Market Demand Accounts (MMDAs), and Passbook Savings.
Appendix D.1 Demand Deposit Accounts
The rate on demand deposit accounts is zero, consistent with the Regulation Q prohibition on paying interest on such accounts that was in place over the full sample used in this paper. Regulation Q was repealed as part of the Dodd-Frank Act, and the prohibition on paying interest on demand deposit accounts ended on July 21, 2011, but data on interest rates for demand deposits are not yet incorporated. Given the relatively small share of demand deposits in M2, it is unlikely that this omission in recent observations generates a serious distortion to the M2 own rate for the data range used in this analysis.19
Appendix D.2 Commercial Bank Savings and Checking (OMS) Rate
The quarterly OMS rate for commercial banks is constructed using data from either the FR2042 (prior to 1995) or the Board's merger-adjusted dataset based on the commercial bank Call Report, a quarterly report of balance sheet and income data that commercial banks must file. In both cases, rates on commercial bank deposits are calculated as deposit-weighted averages. The commercial bank Call Report provides quarterly data on interest expenses. To derive an aggregate OMS rate for commercial banks, the interest expenses for OCDs and for Total Savings (MMDAs and passbook savings) are summed for each bank, yielding the OMS interest expense over a given quarter.20
This interest expense is then summed over all banks in the Call Report database. This sum of OMS expenses is then divided by sum of quarter-average OMS deposits at those banks, yielding an aggregate quarter-average OMS rate for commercial banks. The resulting aggregate commercial bank OMS rate is thus a deposit-weighted average of the OMS rates of the individual banks. In constructing the OMS rate at commercial banks, we delete some banks in order to eliminate clearly erroneous entries. We delete a bank if the change in that bank's OMS rate from the previous quarter is greater than 125 basis points in absolute value. Changes of this magnitude are quite unusual and probably are a result of reporting errors, even in times of rapid interest rate changes. We perform this check on each quarter of data independently of past observations.
Appendix D.3 Thrift Savings and Checking (OMS) Rate
When the FR2042 was available, it provided rate information for OCDs and MMDAs; the thrift passbook was estimated as the the total savings rate reported on the FR2042 for BIF-insured mutual savings banks. Since the expiration of the FR2042, the primary source of rate information for thrift savings rates has been the thrift Call Report, collected by the Office of Thrift Supervision (OTS). This quarterly report provides deposit rates for all three components of thrift OMS balances: OCDs, MMDAs, and passbook savings accounts.
Appendix D.4 Two Measures of the OCD Rate at Thrifts
For OCD rates at thrifts, two different measures are available in the OTS dataset. The rate for "interest-bearing" OCDs is the rate actually paid on OCD accounts. For example, if we want to compare how thrifts set their interest-bearing OCDs relative to how banks set their OCD rates, then we should use the interest-bearing OCD rate at thrifts. However, in defining thrift OCDs as part of M2, the Federal Reserve includes both interest-bearing OCD balances and non-interest bearing balances at thrifts--the latter of which would be classified as demand deposits if they were located at a commercial bank. Therefore, in calculating an OMS rate for thrifts, we use the rate reported for `interest-bearing and noninterest-bearing OCDs' at thrifts. The deposit-weighted average OMS rate for thrifts is then calculated as a deposit-weighted average of the estimated passbook savings rate, the reported MMDA rate, and the rate on interest-bearing plus non-interest-bearing OCDs. The deposit balances used to construct the weights are available as part of the thrift Call Report dataset.21
Appendix D.5 Editing the Thrift Data
As with the data on commercial bank rates, we delete micro thrift deposit rate observations that appear to be erroneous. We delete an individual thrift if either (1) the change in the OCD or OMS rate exceeds 125 basis points or (2) the OCD rate exceeds the MMDA rate by more than 200 basis points and the MMDA rate equals zero. The first criterion was determined by trial and error: The 125 basis point cutoff seems to screen out obviously erroneous entries while still allowing for extreme (and correct) observations. The second criterion is an attempt to address the problem that the OTS overwrites missing values with zeros. Thus, an MMDA rate that is reported as zero may be either a valid quoted rate or may be a missing value that has been overwritten by the OTS. When the MMDA rate is zero and the OCD rate is at least 2.0, we delete that thrift on the assumption that the MMDA rate was originally reported as a missing value--typically MMDA rates are higher than OCD rates.
Appendix D.6 OMS Rates Paid by BIF-Insured Savings Banks Reporting on the Bank Income and Call Reports
We implicitly assume that these savings banks pay an average rate on OMS deposits equal to the average rate paid by thrifts reporting in the OTS dataset.22 For the period over which we have FR2042 data, the OCD rates paid by BIF-insured savings banks that reported on the FR2042 and OTS thrifts moved relatively closely.
Appendix D.7 No Data on OMS Rates paid by Credit Unions
We are implicitly assuming that credit unions also pay the same OMS rates as do OTS thrifts. We do not have data for credit unions with which to justify this assumption. However, the share of deposits held by credit unions is quite small: OMS deposits in credit unions amount to only $500 billion versus over $6 trillion in commercial banks and thrifts.
Appendix D.8 No Data on OMS Rates Paid by Branches and Agencies of Foreign Banks
We are assuming that branches and agencies of foreign banks pay the same OMS rate as do commercial banks. Again, we do not have data with which to justify this assumption. However, as for credit unions, the share of M2 deposits held by these institutions is quite small.
**The fitted line includes values from 1994:Q1-2011:Q1, excluding 2008:Q4 and 2009:Q1.
**The fitted line includes values from 1994:Q1-2011:Q1, excluding 2008:Q4 and 2009:Q1.
**The fitted line includes values from 1994:Q1-2011:Q1, excluding 2008:Q4 and 2009:Q1.
**The fitted line includes values from 1994:Q1-2011:Q1, excluding 2008:Q4 and 2009:Q1.
Figure 14: M2 Velocity and Opportunity Cost (Taylog25) with M2 Adjusted for Shifts Related to FDIC Policy Change: 1960:Q1-2013:Q1.
**The fitted line includes values from 1994:Q1-2011:Q1, excluding 2008:Q4 and 2009:Q1.
***For M2 values in 2011:Q3 and after, levels are reduced by $300 billion, the estimated amount of increase in M2 due to repatriation of offshore M2 depositis after the FDIC assessment rate structure changed on April 1, 2011.
Figure 15: M2 Velocity and Opportunity Cost (Taylog50) with M2 Adjusted for Shifts Related to FDIC Policy Change: 1960:Q1-2013:Q1.
**The fitted line includes values from 1994:Q1-2011:Q1, excluding 2008:Q4 and 2009:Q1.
***For M2 values in 2011:Q3 and after, levels are reduced by $300 billion, the estimated amount of increase in M2 due to repatriation of offshore M2 depositis after the FDIC assessment rate structure changed on April 1, 2011.
Figure 16: M2 Velocity and Opportunity Cost (Taylog00) with M2 Adjusted for Shifts Related to FDIC Policy Change: 1960:Q1-2013:Q1.
**The fitted line includes values from 1994:Q1-2013:Q1, excluding 2008:Q4 and 2009:Q1.
***For M2 values in 2011:Q3 and after, levels are reduced by $300 billion, the estimated amount of increase in M2 due to repatriation of offshore M2 depositis after the FDIC assessment rate structure changed on April 1, 2011.
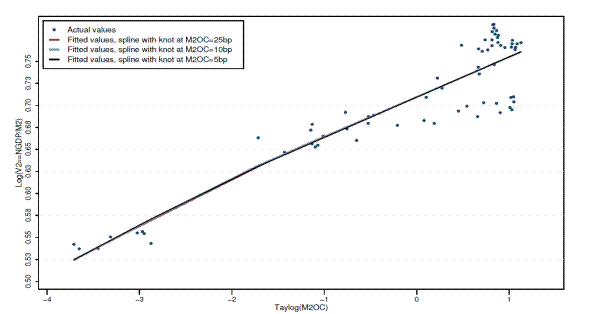
Figure 18: Separate Regressions Over Three Sub-periods in 1994:Q1-2013:Q1, Excluding 2008:Q4 and 2009:Q1.
**For M2 values in 2011:Q3 and after, levels are reduced by $300 billion, the estimated amount of increase in M2 due to repatriation of offshore M2 depositis after the FDIC assessment rate structure changed on April 1, 2011.
Note: The spline regression here incorporates the adjusted M2 values.
| Static Model: Original Sample | Static Model: Updated Sample | Conference Aggregate Model: Original Sample | Conference Aggregate Model: Updated Sample | |
|---|---|---|---|---|
| MAE Sample | 3.16 | 3.71 | 2.91 | 1.93 |
| RMSE Sample | 4.03 | 4.80 | 3.38 | 2.54 |
Shading indicates lowest MAE and RMSE.
| Taylog Specification: Statistic | Static | Conference Aggregate |
|---|---|---|
| Taylog50: MAE | 3.27 | 1.72 |
| Taylog50: RMSE | 4.27 | 2.31 |
| Taylog00: MAE | 2.34 | 2.12 |
| Taylog00: RMSE | 2.93 | 2.58 |
| Taylog25: MAE | 4.65 | 1.57 |
| Taylog25: RMSE | 5.57 | 2.08 |
| Taylog Specification: Statistic | Static | Conference Aggregate |
|---|---|---|
| Taylog50: MAE | 3.87 | 1.78 |
| Taylog50: RMSE | 4.62 | 2.47 |
| Taylog00: MAE | 2.60 | 1.83 |
| Taylog00: RMSE | 3.27 | 2.47 |
| Taylog25: MAE | 5.03 | 1.81 |
| Taylog25: RMSE | 5.88 | 2.49 |
Estimation period beginning 1994:Q1, excluding 2008:Q4 and 2009:Q1. Shading indicates lowest MAE and RMSE for earlier period. For later period, conference aggregate results are very similar to one another.
| Taylog Specification: Statistic | Original Est. Period: Static | Original Est. Period: Conference Aggregate | Updated Est. Period: Static | Updated Est. Period: Conference Aggregate |
|---|---|---|---|---|
| Taylog50: MAE | 2.50 | 1.68 | 2.75 | 1.50 |
| Taylog50: RMSE | 3.56 | 1.83 | 3.82 | 2.09 |
| Taylog00: MAE | 2.34 | 1.45 | 2.34 | 1.67 |
| Taylog00: RMSE | 2.93 | 2.08 | 2.93 | 2.34 |
| Taylog25: MAE | 3.84 | 3.21 | 4.33 | 1.61 |
| Taylog25: RMSE | 4.78 | 3.53 | 5.26 | 2.04 |
Original estimation period: 1964:Q1-1989:Q4; updated estimation period: 1994:Q1-2008:Q3. Shading indicates lowest MAE and RMSE for each estimation period.
| All GDP | All PCE | One more lag | One less lag | No unit elasticity | M2OC using 10-yr bond rate | Yield curve | Volatility index | Expected inflation | Memo: current model | |
|---|---|---|---|---|---|---|---|---|---|---|
| Taylog50: In-Sample: MAE | 1.09 | 1.92 | 2.18 | 1.70 | 1.36 | 1.36 | 1.75 | 1.68 | 1.63 | 1.72 |
| Taylog50: In-Sample: RMSE | 1.49 | 2.53 | 2.77 | 2.29 | 1.70 | 2.16 | 2.31 | 2.20 | 2.00 | 2.31 |
| Taylog50: Out-of-Sample: MAE | 1.55 | 1.56 | 1.93 | 1.47 | 2.55 | 1.41 | 1.72 | 1.58 | 1.78 | 1.50 |
| Taylog50: Out-of-Sample: RMSE | 1.89 | 2.42 | 2.71 | 2.09 | 2.92 | 2.00 | 2.28 | 2.03 | 2.13 | 2.09 |
| Taylog00: In-Sample: MAE | 1.49 | 2.25 | 2.68 | 2.03 | 1.23 | 1.36 | 2.17 | 1.95 | 1.68 | 2.12 |
| Taylog00: In-Sample: RMSE | 1.87 | 2.76 | 3.16 | 2.55 | 1.74 | 2.16 | 2.59 | 2.39 | 2.20 | 2.58 |
| Taylog00: Out-of-Sample: MAE | 1.54 | 1.82 | 2.55 | 1.64 | 2.16 | 1.41 | 1.87 | 1.62 | 1.66 | 1.67 |
| Taylog00: Out-of-Sample: RMSE | 2.19 | 2.69 | 3.27 | 2.36 | 2.54 | 2.00 | 2.41 | 2.15 | 2.07 | 2.34 |
| Taylog25: In-Sample: MAE | 1.05 | 1.73 | 1.66 | 1.60 | 1.48 | 1.36 | 1.59 | 1.59 | 1.64 | 1.57 |
| Taylog25: In-Sample: RMSE | 1.14 | 2.30 | 2.33 | 2.10 | 1.71 | 2.16 | 2.11 | 2.04 | 1.94 | 2.08 |
| Taylog25: Out-of-Sample: MAE | 1.28 | 1.62 | 1.64 | 1.55 | 3.22 | 1.41 | 2.12 | 1.64 | 2.30 | 1.61 |
| Taylog25: Out-of-Sample: RMSE | 1.33 | 2.09 | 2.17 | 1.98 | 3.68 | 2.00 | 2.99 | 2.18 | 2.76 | 2.04 |
Shading indicates MAE or RMSE lower than current model.
| Knot (basis points) | Taylog25 | T | Taylog25 Increment | T |
|---|---|---|---|---|
| 5.67 | 0.048 | 14.2 | -0.007 | -0.2 |
| 10 | 0.046 | 10.6 | 0.009 | 0.5 |
| 25 | 0.045 | 9.4 | 0.008 | 0.7 |
| Knot (basis points) | Taylog25 | T | Taylog25 Increment | T |
|---|---|---|---|---|
| 5.67 | 0.058 | 19.3 | -0.064 | -2.2 |
| 10 | 0.058 | 14.0 | -0.025 | -1.4 |
| 25 | 0.050 | 9.5 | 0.008 | 0.7 |
Dependent Variable: Log(V2) == Log(Nominal GDP / M2)
| Type of institution: Time period | Type of account: OMS: Other Checkable Deposits | Type of account: OMS: Total Savings Rate: Money Market Deposit Accounts | Type of account: OMS: Total Savings Rate: Savings (passbook) | Type of account: Small Time Deposits | Type of account: Money Market Mutual Funds (MMMF) |
| Commercial Banks: Post-1997 | TINY | TINY | TINY | BRM |
Not applicable |
| Commercial Banks: Pre-1997 | FR2042 | FR2042 | FR2042 | FR2042 | Not applicable |
| Thrifts: Post-1997 | OTS | OTS | NA | BRM | Not applicable |
| Thrifts: Pre-1997 | OTS | FR 2042 |
FR 2042 |
OTS | Not applicable |
| Credit Unions: All | Not available | Not available | Not available | Not available | Not applicable |
| Foreign Banks: All | Not available | Not available | Not available | Not available | Not applicable |
| Mutual Funds: All | Not applicable | Not applicable | Not applicable | Not applicable | iMoneyNet |
Note: This table shows (in bold type) the three main changes made in 1997 to the construction of deposit rates:
(1) For commercial banks, only an overall OMS rate is calculated currently;
(2) For commercial banks, the OMS rate now uses data from TINY rather than the FR2042;
(3) Data on small time rates are now obtained from Bank Rate Monitor rather than from the FR2042 and OTS.
| (1) Dataset | (2) Type of Depository Institution | (3) Type of Data | (4) Distorted by Tiering? | (5) Distorted by Sweeps? | (6) Account Types | (7) Aggregation | (8) Frequency |
| BRM | Commercial banks | Quoted rates | Yes | No | Small time (OCD, MMDA) |
Simple average | Weekly |
| OTS-SVGL | Savings banks, S&Ls | Quoted rates | Yes | No | OCD, MMDA (Small time) | Deposit-weighted | Quarterly |
| TINY | Domestically chartered commercial banks | Interest expenses | No | Yes | OCD, MMDA+ Savings (Small time) |
Deposit-weighted | Quarterly |
| FR 2042 | Commercial banks and BIF-insured banks | Quoted rates (1994 and earlier) | Yes | No | Small time, MMDA, Savings, OCD | Deposit-weighted | Monthly |
| FR 2042 | Commercial banks and BIF-insured banks | Interest expenses (1994-1997) | No | Yes | Small time, MMDA+ Savings, OCD | Deposit-weighted | Monthly |
| iMoneyNet | Mutual Funds | Realized rates | NA | MMMF | NA | Monthly |