
Board of Governors of the Federal Reserve System
International Finance Discussion Papers
Number 822, November 2004, revised June 2008 --- Screen Reader
Version*
Growth-Led Exports: Implications for the Cross-Country Effects of Shocks to Potential Output
NOTE: International Finance Discussion Papers are preliminary materials circulated to stimulate discussion and critical comment. References in publications to International Finance Discussion Papers (other than an acknowledgment that the writer has had access to unpublished material) should be cleared with the author or authors. Recent IFDPs are available on the Web at http://www.federalreserve.gov/pubs/ifdp/. This paper can be downloaded without charge from the Social Science Research Network electronic library at http://www.ssrn.com/.
Abstract:
Fast-growing countries tend to experience rapid export growth with little secular change in their terms of trade. This contradicts most international macroeconomic models, which predict that productivity and labor supply shocks can affect exports only through changes in the terms of trade. This paper generalizes the monopolistic competition trade model of Helpman and Krugman (1985), providing a basis for growth-led exports without declining terms of trade. The key mechanism behind this result is that fast-growing countries are able to develop new varieties of products that can be exported without pushing down the prices of existing products. There is strong support for the new model in long-run export growth of many countries in the post-war era. These results have major implications for the analysis of supply shocks in international macroeconomic models.
Keywords: Export demand, international trade, product differentiation
JEL classification: F1, F4
I Introduction
Few people would be surprised to learn that there is a strong positive correlation between the growth rate of a country's exports and the growth rate of its economy. Indeed, there is an extensive body of theoretical and empirical research on the phenomenon of "export-led growth," which focuses on the benefits for long-run economic growth of encouraging exports and openness to trade.2 However, in most international macroeconomic models, a permanent increase in demand for a country's exports has no long-run effect on its output and a permanent increase in a country's output increases its exports only through a permanent decline in its terms of trade, which reduces the welfare gains from growth. This paper shows empirically that there is a long-run effect of economic growth on exports and that there is not a long-run effect of growth on the terms of trade. It proposes an alternative macro trade specification that can explain these empirical results.
Figure 1 shows the positive correlation between long-run export growth and long-run economic growth in a sample of 58 countries over the period 1960-2004.3 Figure 2 shows essentially no correlation between changes in the terms of trade and long-run economic growth for these countries. Regression analysis presented in this paper demonstrates that these relationships are not affected by simultaneity bias and are unlikely to reflect omitted factors.
To explain these empirical findings, this paper develops a new model of export demand based on the theoretical work of Helpman and Krugman (1985). The new model significantly and robustly outperforms the standard model. Unlike the standard assumption of one good per country, the alternative model allows for multiple varieties of goods to be produced in each country. In this model, economic growth allows a country to produce more varieties, and demand for a country's exports is directly tied to the number of varieties it produces. Thus, fast-growing countries can have fast-growing exports without a decline in the terms of trade.
This finding carries important implications for empirical international macroeconomics. In most models of international macroeconomic linkages, permanently higher output tends to lower a country's trade balance through higher imports that are not matched by higher exports, at least not without a permanent decline in the terms of trade. For example, in the Federal Reserve Board staff's multi-country dynamic general equilibrium (DGE) model, SIGMA, a permanent productivity increase reduces a country's trade balance in the short run and lowers its terms of trade (causing a real exchange rate depreciation) in the long run.4 This result derives from the standard assumption that each country's goods are imperfect substitutes for goods produced in other countries. Higher income raises import demand directly, but, holding foreign income constant, the only way to export more is through a lower price. Most models enforce balanced trade in the long run, and thus permanent shocks to potential output have permanent effects on a country's terms of trade.5
The "growth-led exports" view of this paper is complementary to the traditional view of export-led growth. Deregulating, opening up the economy, and otherwise encouraging exports may indeed spur growth through technological transfer and more competitive producers. The model developed here helps to explain why such growth is all the more beneficial for a country's welfare because it is not offset by declining terms of trade. The evidence presented in this paper provides some support for a connection between changes in openness to foreign trade and economic growth. But even for countries with a relatively stable share of exports in GDP, faster economic growth tends to be associated with faster export growth.
The next section of the paper demonstrates that there is no significant link between long-run rates of economic growth and the terms of trade; in particular, exogenous forces driving growth do not have significantly adverse implications for a country's terms of trade. Section III develops a theoretical model to explain this empirical regularity. Section IV estimates the model and explores the robustness of the key parameter. Section V is a brief conclusion.
II Terms of Trade and Economic Growth
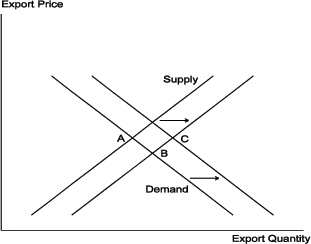
Figures 1 and 2 display a strong link between export growth and economic growth in the long run and essentially no link between changes in the terms of trade and long-run economic growth. The latter finding is not consistent with the standard Armington (1969) model of export supply and demand under the assumption that economic growth is exogenous with respect to the terms of trade. As shown in Figure 3, faster economic growth shifts out the export supply curve and the economy moves down the export demand curve from point A to a new lower price of exports at point B.6 Under Armington demand, we would expect to find a negative correlation between growth and the terms of trade. The lack of such a correlation implies that there is a systematic positive correlation between economic growth and export demand. The next section of this paper develops a model of export demand that includes a positive effect of economic growth, as displayed in Figure 4.
An alternative explanation for the lack of correlation in Figure 2 is that long-run economic growth may not be exogenous with respect to the terms of trade. In particular, positive export demand shocks might raise both economic growth and the terms of trade. It seems unlikely that export demand shocks could have an effect on economic growth that lasts for the entire 44-year period shown in Figure 2, as a country's long-run economic growth is mainly determined by factors that are exogenous to export demand, such as population growth and institutional characteristics that encourage or discourage the accumulation of human and physical capital. Nevertheless, the following regression analysis shows that long-run changes in the terms of trade are not correlated with instruments for economic growth that are clearly exogenous with respect to changes in export demand.
Table 1 presents cross-country instrumental-variables regressions of long-run changes in the terms of trade on long-run economic growth rates and other variables. (Data are described in the Data Appendix.) Following a recent paper by Acemoglu and Ventura (2002), long-run economic growth is instrumented by the levels of three variables that are observed at the beginning of the sample: real per capita income adjusted for purchasing power parity (PPP), the average years of schooling of the labor force, and the average life expectancy. All of these instruments are predetermined and thus exogenous with respect to subsequent changes in the terms of trade. Because the focus here is on total economic growth rather than per capita growth (as in Acemoglu and Ventura) population growth is added as a fourth instrument, under the assumption that population growth is exogenous to the terms of trade. However, the results are not sensitive to dropping the population growth rate.
Acemoglu and Ventura argue that the human capital variables (years of schooling and life expectancy) may have independent effects on the terms of trade, so they are included in the second-stage regression here, though the results are not sensitive to excluding them. The regressions also include a dummy variable for countries that produced more than twice as much oil as they consumed in 1985.7 From the point of view of many oil exporting countries, changes in the price of oil represent major exogenous shocks to the terms of trade that may have had lasting effects on economic growth.
Column (1) of Table 1 presents results of a regression of the
change in the terms of trade between 1960 and 2004 on the growth of
real GDP over the same period and on the oil exporter dummy. The
coefficient on GDP growth is essentially zero and the equation
R![]() is very low, despite a respectable fit
of the first-stage regression. Column (2) adds the human capital
variables. It is difficult to understand why schooling should have
an (insignificant) negative effect on the terms of trade and life
expectancy should have a (significant) positive effect. But there
is no significant effect on the GDP growth coefficient.
is very low, despite a respectable fit
of the first-stage regression. Column (2) adds the human capital
variables. It is difficult to understand why schooling should have
an (insignificant) negative effect on the terms of trade and life
expectancy should have a (significant) positive effect. But there
is no significant effect on the GDP growth coefficient.
Columns (3) and (4) break the sample into two sub-periods.8 The oil dummy is significantly positive in the first sub-period, when oil prices were rising, and (insignificantly) negative in the second period, when oil prices were falling in real terms. The coefficient on GDP growth is near zero in the first subsample, but takes on the wrong sign in the second subsample. Both the first- and second-stage R2's are quite low in the second subsample, probably reflecting the inclusion of many more countries with noisy data.9
Column (5) replaces total GDP growth with per capita GDP growth and drops population growth from the instruments. This is the specification in Acemoglu and Ventura.10 Here the results are almost identical to those for total GDP growth in column (2). Column (6) focuses on countries whose exports are primarily composed of manufactured goods and services, in order to minimize the effect of volatile commodity prices on the regression.11 Column (7) restricts the sample to industrial countries, for which the data quality is generally highest. In neither column (6) nor column (7) is there a significant coefficient on GDP growth.
Altogether, the results shown in Table 1 support the conclusion that there is no long-run negative effect of economic growth on a country's terms of trade.
III Theoretical Model
This section derives a two-country model of export demand and supply based on tastes, technology, and labor in a setting with endogenous varieties of goods.12 Under plausible assumptions, the number of varieties grows in proportion to a country's total output.13 A key contribution of this paper is to show that allowing for endogenous varieties leads to an export demand equation that can be approximated by augmenting the standard Armington demand equation with a term for the relative size of the exporting country in the world economy.14 In this model, as shown in Figure 4, long-run economic growth in output shifts both the export supply and export demand curves out simultaneously, moving from point A to point C with minimal effect on the price of exports.
III.1 Demand
The demand side of the model is taken from Helpman and Krugman
(1985) who, in turn, based their work on the "love of variety"
utility function proposed by Dixit and Stiglitz (1977).15 The utility of the representative
household is displayed in equation (1). The budget constraint is
equation (2). Here D represents domestic consumption of
domestically produced goods and X* represents imports (exports from
the rest of the world). Asterisks denote foreign variables. The
subscripts denote individual varieties. There are N domestic
varieties and N* varieties of imports. Prices of domestic goods are
denoted by P![]() . Import prices (in foreign currency)
are denoted by P
. Import prices (in foreign currency)
are denoted by P![]() * and the exchange rate is R.
Total expenditure is E. "A" is an exogenous variable that
reflects taste for imports. Consumers are biased towards domestic
goods if A is less than unity. The elasticity of substitution,
* and the exchange rate is R.
Total expenditure is E. "A" is an exogenous variable that
reflects taste for imports. Consumers are biased towards domestic
goods if A is less than unity. The elasticity of substitution,
![]() , is assumed to be equal across all
goods in order to obtain a closed-form solution for demand.
, is assumed to be equal across all
goods in order to obtain a closed-form solution for demand.
![\begin{displaymath} \begin{array}
[c]{l}
(1)\,\,U\,=\,\left[ {\sum\limits_{i=1}^{N} {D_{i}^{\textstyle{\frac
{{\sigma-1} }{\sigma}}} \,+\,\sum\limits_{i=1}^{N\ast} {A\,X\ast
_{i}^{\textstyle{\frac{{\sigma-1} }{\sigma}}} } } } \right] ^{\textstyle{\frac
{\sigma}{{\sigma-1}}}}\\end{array}\end{displaymath}](eqn1.gif)
|
(1) |
![\begin{displaymath} \begin{array}
[c]{l}(2)\,\,E\,=\,\sum\limits_{i=1}^{N} {P_{i}^{D} } D_{i} \,+\,\sum\limits_{i=1}
^{N\ast} {R\,P_{i}^{X\ast} \,X\ast_{i} }\\
\end{array}\end{displaymath}](eqn2.gif)
|
(2) |
The representative household chooses consumption of each variety
to maximize (1) subject to (2) and taking prices, available
varieties, and total expenditure as given.16 All domestic firms face the same
production technology, which leads to equal prices of all domestic
varieties, P![]() , and thus equal quantities sold, D.
Similarly, all foreign varieties sell at the common price
P
, and thus equal quantities sold, D.
Similarly, all foreign varieties sell at the common price
P![]() * with equal quantities X*. Aggregate
demand for each type of good equals the number of varieties times
the quantity demanded of each variety. The resulting aggregate
demand system is given by equations (3)-(4).
* with equal quantities X*. Aggregate
demand for each type of good equals the number of varieties times
the quantity demanded of each variety. The resulting aggregate
demand system is given by equations (3)-(4).
![\begin{displaymath} \begin{array}
[c]{l}
(3)\,\,N\,D\,\,=\,\,\frac{N\,\left( {P^{D}} \right) ^{-\sigma}\,E}{N\,\left(
{P^{D}} \right) ^{1-\sigma}\,+\,N\ast\,\left(
{\raise0.7ex\hbox{${R\,P^{X\ast
}}$}
\!\mathord{\left/ {\vphantom {{R\,P^{X\ast }} A}}\right.\kern-\nulldelimiterspace}\!\lower0.7ex\hbox{$A$}}
\right) ^{1-\sigma}}\\
\end{array}\end{displaymath}](eqn3.gif)
|
(3) |
![\begin{displaymath} \begin{array}
[c]{l}
(4)\,\,N\ast\,X\ast\,\,=\,\,\,\,\frac{N\ast\,\left(
{\raise0.7ex\hbox{${R\,P^{X\ast }}$}
\!\mathord{\left/ {\vphantom {{R\,P^{X\ast }} A}}\right.\kern-\nulldelimiterspace}\!\lower0.7ex\hbox{$A$}}
\right) ^{-\sigma}\,\raise0.7ex\hbox{$E$}
\!\mathord{\left/ {\vphantom {E A}}\right.\kern-\nulldelimiterspace}\!\lower0.7ex\hbox{$A$}}
{N\,\left( {P^{D}} \right) ^{1-\sigma}\,+\,N\ast\,\left(
{\raise0.7ex\hbox{${R\,P^{X\ast }}$}
\!\mathord{\left/ {\vphantom {{R\,P^{X\ast }} A}}\right.\kern-\nulldelimiterspace}\!\lower0.7ex\hbox{$A$}}
\right) ^{1-\sigma}}\\
\end{array}\end{displaymath}](eqn4.gif)
|
(4) |
Solving the analogous system for the rest of the world, yields equations (5)-(6).17
![\begin{displaymath} \begin{array}
[c]{l}
(5)\,\,N\ast\,D\ast\,\,=\,\,\frac{N\ast\,\left( {P^{D\ast}} \right)
^{-\sigma\ast}\,E\ast}{N\ast\,\left( {P^{D\ast}} \right) ^{1-\sigma\ast
}\,+\,N\,\left( {\raise0.7ex\hbox{${P^X}$}
\!\mathord{\left/ {\vphantom {{P^X} {R\,A\ast }}}\right.\kern-\nulldelimiterspace}\!\lower0.7ex\hbox{${R\,A\ast }$}}
\right) ^{1-\sigma\ast}}\\
\end{array}\end{displaymath}](eqn5.gif)
|
(5) |
![\begin{displaymath} \begin{array}
[c]{l}
(6)\,\,N\,X\,\,=\,\,\,\,\frac{N\,\left( {\raise0.7ex\hbox{${P^X}$}
\!\mathord{\left/ {\vphantom {{P^X} {R\,A\ast }}}\right.\kern-\nulldelimiterspace}\!\lower0.7ex\hbox{${R\,A\ast }$}}
\right) ^{-\sigma\ast}\,\raise0.7ex\hbox{${E\ast }$}
\!\mathord{\left/ {\vphantom {{E\ast } {A\ast }}}\right.\kern-\nulldelimiterspace}\!\lower0.7ex\hbox{${A\ast }$}}
{N\ast\,\left( {P^{D\ast}} \right) ^{1-\sigma\ast}\,+\,N\,\left(
{\raise0.7ex\hbox{${P^X}$}
\!\mathord{\left/ {\vphantom {{P^X} {R\,A\ast }}}\right.\kern-\nulldelimiterspace}\!\lower0.7ex\hbox{${R\,A\ast }$}}
\right) ^{1-\sigma\ast}}\\
\end{array}\end{displaymath}](eqn6.gif)
|
(6) |
Expenditure equals revenue from domestic production plus an exogenous transfer, T, from the rest of the world: equation (7). Foreign expenditure equals foreign production minus the transfer converted into foreign currency: equation (8). The transfer allows for unbalanced trade. T is assumed to be driven by macroeconomic factors such as fiscal and monetary policy that affect national saving and investment.
| (7) | |
| (8) |
III.2 Supply
Now turn to the firms' decisions and aggregate supply. There are a potentially unlimited number of varieties within each class of good, but a firm must pay a fixed cost for each new variety as well as a marginal cost for each unit of output. All costs and prices are expressed in terms of units of labor. Equations (9) and (10) are the total cost functions for each variety of domestic and foreign good, respectively.18 Note that each variety is both consumed at home (D) and exported (X). F is the fixed cost and G is the marginal cost. Technological progress tends to lower costs, and can thus be modeled as an exogenous decline in F and G.
| (9) | |
| (10) |
The profit-maximizing prices depend on the elasticity of substitution and the marginal cost, as shown in equations (11)-(14).19 These are standard markup equations.
| (11) | (13) | ||
| (12) | (14) |
Total production in each country exhausts the available pool of labor, shown in equations (15)-(16), thereby determining the number of varieties of goods produced. Aggregate labor supply, L, is exogenous in each region. Free entry ensures that firm profits are zero, driving revenue equal to cost for each variety: equations (17)-(18). By Walras' Law, one of the last two equations or one of the two expenditure equations can be dropped.
| (15) |
| (16) |
| (17) |
| (18) |
III.3 Implications for Empirical Export Demand
This sub-section derives an estimable demand function for aggregate exports. The first step is to show that the (unobserved) number of varieties produced by a country is a function of the country's (observed) total output. Total output is defined as the number of varieties produced times the quantity of each variety, shown in equation (19). Inserting equations (11) and (12) into (17) yields equation (20) for domestic output of each variety. Substituting (20) into (19) and rearranging terms shows that the number of varieties is a function of total output and the ratio of marginal to fixed cost, equation (21).
| (19) |
| (20) |
| (21) |
The second step is to define the foreign expenditure price as the
weighted average of foreign and domestic output prices, shown in
equation (22). Inserting (21) into (6), dividing the numerator and
denominator by P![]() *, and making use of (22) yields
equation (23), where Z=G/[(
*, and making use of (22) yields
equation (23), where Z=G/[(![]() -1)F] for
notational simplicity. Note that our use of the property in
equation (21) that the number of varieties is proportional to total
output does not imply that we have inserted the supply curve into
the demand curve, rather it simply allows us to express the demand
curve in terms of observable variables.20
-1)F] for
notational simplicity. Note that our use of the property in
equation (21) that the number of varieties is proportional to total
output does not imply that we have inserted the supply curve into
the demand curve, rather it simply allows us to express the demand
curve in terms of observable variables.20
| (22) |
| (23) | |
![\begin{displaymath} \begin{array}
[c]{l}
(23)\,\,N\,X\,\,=\,\,\left( {\frac{P^{X}}{R\,P^{E\ast}}} \right) ^{-\sigma
}\left( {\frac{E\ast}{P^{E\ast}}} \right) \,\,\left( {\frac{1}{\alpha\ast}}
\right) ^{1-\sigma\ast}\\\end{array}\end{displaymath}](eqn23b.gif)
|
To obtain a linear equation in growth rates, take the logarithm of equation (23) and totally differentiate. An appendix (available upon request) uses a Taylor expansion to derive equation (24), in which the logarithmic change in exports is expressed in terms of the log changes in the other variables.
![\begin{displaymath} \begin{array}
[c]{l}
(24)\,\,\Delta\,\log\left( {N\,X} \right) \,\,=\,\,-\sigma\,\Delta
\,\log\left( {\frac{P^{X}}{R\,P^{E\ast}}} \right) \,+\,\Delta\,\log\left(
{\frac{E\ast}{P^{E\ast}}} \right) \,+\,\Delta\,\log\left( {\frac
{Y}{Y\,+\,Y\ast}} \right) \,\\
\,\,\,\,\,\,\,\,\,\,\,\,\,\,\,\,\,\,+\,(\sigma-1)\,\left( {\frac{Y\ast
}{Y+Y\ast}} \right) \,\Delta\,\log\,A\ast\,+\,\left( {\frac{Y\ast}{Y+Y\ast}}
\right) \,\left( {\Delta\,\log\,Z\,-\,\Delta\,\log\,Z\ast} \right) \\\end{array}\end{displaymath}](eqn24.gif)
|
(24) |
The first term on the right hand side of equation (24) is the change in the price of exports relative to the price of total foreign expenditures converted into domestic currency; the coefficient on this term is the negative of the elasticity of substitution. The second term is the change in real expenditure in the rest of the world, with a coefficient of unity. The first two terms together comprise the standard Armington demand equation. The third term is the change in the ratio of domestic output to world output, also with a coefficient of unity. This term represents the main contribution of this paper, and its coefficient is the parameter of interest. The fourth and fifth terms are functions of changes in unobservable tastes (A*) and technology (Z, Z*).
For identification, it is necessary that the unobservable
disturbances (the last two terms) are not correlated with the
regressors (the first three terms). Within the system developed
here, taste shocks (![]() log A*) are not
correlated with prices, output, or expenditures.21 The underlying technology variables
(F, G, F*, G*) are correlated with prices, output, and expenditure.
However, they enter the demand equation directly only through a
function of their ratio (Z=G/[(
log A*) are not
correlated with prices, output, or expenditures.21 The underlying technology variables
(F, G, F*, G*) are correlated with prices, output, and expenditure.
However, they enter the demand equation directly only through a
function of their ratio (Z=G/[(![]() -1)F]). Thus,
identification requires only the assumption that technological
progress lowers both fixed and marginal costs proportionally. Under
this assumption,
-1)F]). Thus,
identification requires only the assumption that technological
progress lowers both fixed and marginal costs proportionally. Under
this assumption, ![]() log Z=
log Z=![]() log Z*=0, and the fifth term of equation (24)
drops out; technological progress then affects exports only through
its effect on output, Y.
log Z*=0, and the fifth term of equation (24)
drops out; technological progress then affects exports only through
its effect on output, Y.
In the more general case that technological progress lowers fixed and marginal costs at different rates, then the coefficients in equation (24) will be biased. It is possible to show that the coefficient on the third term, which is the key parameter being tested here, will be zero only in the extreme case that labor supply is constant and technological progress operates only on marginal costs; in this case, Z is perfectly negatively correlated with Y, Z* is perfectly negatively correlated with Y*, and varieties (N, N*) are fixed. This coefficient will be positive whenever labor supply or falling fixed costs contribute at least some part of growth in output, in which case changes in Z will not fully offset changes in Y. Thus, a significant positive coefficient on the third term can be viewed as a rejection of Armington demand and as evidence of a growing number of varieties.
III.4 Comparative Statics
What are the implications of economic growth for exports and the terms of trade under equation (24) and how do they differ from those of the standard Armington model?
The Armington model includes only the first two terms of equation (24). For a small country, an increase in output has no effect on foreign variables. Thus the second term of equation (24) is constant and the demand curve is fixed and downward-sloping, as in Figure 3. Through general equilibrium effects, the increase in output shifts export supply outward, resulting in a decline in export prices in terms of foreign currency and an increase in export volume from point A to point B.22 As the price of imports is fixed in terms of foreign currency, the terms of trade fall.
The Helpman-Krugman model includes the first three terms of
equation (24). For a small country (Y*![]() Y) an
increase in output raises log[Y/(Y+Y*)] roughly as much as it
raises log[Y] but it has no effect on the analogous term in import
demand, log[Y*/(Y*+Y)]. As shown in Figure 4, export demand shifts
out owing to this effect. Import demand, on the other hand, is
identical to the Armington model in a small country, and thus the
general equilibrium effects on export supply are similar to those
in Figure 3. Export volumes grow and the terms of trade are roughly
unchanged, moving from point A to point C.
Y) an
increase in output raises log[Y/(Y+Y*)] roughly as much as it
raises log[Y] but it has no effect on the analogous term in import
demand, log[Y*/(Y*+Y)]. As shown in Figure 4, export demand shifts
out owing to this effect. Import demand, on the other hand, is
identical to the Armington model in a small country, and thus the
general equilibrium effects on export supply are similar to those
in Figure 3. Export volumes grow and the terms of trade are roughly
unchanged, moving from point A to point C.
IV Empirical Results
This section presents estimates of the coefficients of equation (24).23 A critical test of the growth-led exports model is that the coefficient on the change in the ratio of exporter GDP to world GDP should be significantly greater than zero.
Table 2 presents estimates of equation (24) across countries using one long-run growth rate for each country.24 Using long-run growth rates eliminates the need to model short-run adjustment dynamics. In addition, the relationship between output and the number of varieties is likely to be strongest over long time-horizons, as the number of varieties may not move in proportion with output over the business cycle. The first three columns of Table 2 display ordinary least squares (OLS) regressions. Column (1) is based on growth rates over the period from 1960 through 2004.25Columns (2) and (3) are based on growth rates over the first half and second half, respectively, of these 44 years. In all three samples, the ratio of exporter GDP to world GDP is highly significant in explaining export growth, lending support to the importance of product varieties and growth-led exports. Column (4) shows that these results are not sensitive to outliers in the data, as estimates from minimum absolute deviation (MAD) regressions are very close to the OLS results.26
The coefficient on the relative export price is the negative of
the substitution elasticity (![]() . The estimate
of this coefficient has the correct sign but is rather close to
zero in these regressions, suggesting the possibility of
simultaneity bias. Simultaneity bias could also be present if
exporter GDP growth responds positively to shocks in the growth
rate of exports in the long run. Columns (5) and (6) explore these
issues. Column (5) presents results of an instrumental-variables
regression in which the ratio of the domestic to the foreign GDP
deflator is used as an instrument for the relative export price and
the instruments of Table 1 (except the oil dummy) are used for the
ratio of exporter GDP to world GDP.27
Column (6) presents a regression in which only initial conditions
and population growth are used as instruments, to guard against
potential endogeneity of the real exchange rate. In both
regressions, the first-stage fit for relative export prices is
somewhat poor and the instruments do not improve the estimated
elasticity of substitution. Indeed, the substitution elasticity now
has the wrong sign. Nevertheless, the coefficient on the ratio of
exporter GDP is still highly significant. Constraining the
coefficient on relative export prices to equal -1 (using the same
instruments) results in a coefficient on the ratio of exporter GDP
of 1.00 that is significant at the 5 percent level.28
. The estimate
of this coefficient has the correct sign but is rather close to
zero in these regressions, suggesting the possibility of
simultaneity bias. Simultaneity bias could also be present if
exporter GDP growth responds positively to shocks in the growth
rate of exports in the long run. Columns (5) and (6) explore these
issues. Column (5) presents results of an instrumental-variables
regression in which the ratio of the domestic to the foreign GDP
deflator is used as an instrument for the relative export price and
the instruments of Table 1 (except the oil dummy) are used for the
ratio of exporter GDP to world GDP.27
Column (6) presents a regression in which only initial conditions
and population growth are used as instruments, to guard against
potential endogeneity of the real exchange rate. In both
regressions, the first-stage fit for relative export prices is
somewhat poor and the instruments do not improve the estimated
elasticity of substitution. Indeed, the substitution elasticity now
has the wrong sign. Nevertheless, the coefficient on the ratio of
exporter GDP is still highly significant. Constraining the
coefficient on relative export prices to equal -1 (using the same
instruments) results in a coefficient on the ratio of exporter GDP
of 1.00 that is significant at the 5 percent level.28
Column (7) displays estimates over a sub-sample of countries for which manufactured goods and services comprised more than 75 percent of exports in 2004. This sample is examined because the Helpman-Krugman model was designed for differentiated manufactures and services, and thus it may not be appropriate for trade in undifferentiated primary commodities. Small countries that specialize in the export of a particular primary commodity may experience growth in both GDP and exports with little change in relative prices if their production of the commodity is small relative to world consumption. This phenomenon would lead to a positive coefficient on the exporter GDP ratio for reasons other than those embodied in the Helpman-Krugman model. Table A1 indicates which countries are in this sub-sample. As seen in column (7) of Table 2, the coefficient on the ratio of exporter to world GDP remains highly significant in this smaller sample.29
Columns (8) and (9) explore the interaction between export-led growth and growth-led exports. The sample of column (1) is split into two equal-sized groups: those for which the share of exports in GDP moved closely in line with the sample median between 1960 and 2004-column (8)-and those for which the share of exports in GDP rose either more or less quickly than the median-column (9).30 If export-led growth were entirely responsible for the results of this paper, one would expect that the coefficient on the ratio of exporter GDP to world GDP would be strongly affected by this sample split, as nearly all the identifying information would be in the sample of column (9)-these are the countries for which exports grew especially strongly or weakly. Indeed, the coefficient on the ratio of exporter GDP is larger in column (9) than in column (8), but the coefficient in column (8) remains highly statistically significant. Thus, it appears that economic growth spurs exports even in countries that are not aggressively pursuing a strategy of export-led growth.
Table 3 presents alternative estimates of equation (24) in log levels using the full panel of annual data and the Arellano-Bond one-step estimator with random effects across countries and robust standard errors.31 The regressions include one lag of the dependent variable and the contemporaneous value and one lag of each independent variable. Serial correlation of the residuals is marginally significant (8 percent level) in column (3) and not significant in any of the other regressions. Foreign expenditure and the exporter GDP ratio are treated as exogenous regressors. The relative price of exports and the lagged endogenous variable are instrumented using their second and third lags; the Sargan test of instrument restrictions is never significant. All regressions include only those countries for which data are available over the entire time period indicated (balanced panel).
Because the proliferation of product varieties is more likely to be linked with long-term trends in output rather than short-term fluctuations, the first three columns of Table 3 present results using the trend ratio of exporter GDP to world GDP.32 Using a trend value should also avoid simultaneity bias from the effect of export demand shocks on exporter GDP. Column (1) presents results over the entire 44-year sample. The lag coefficient of 0.72 implies a half-life of shocks of about two years. The remaining coefficients are the estimated long-run effects of each variable. The long-run effect of the ratio of exporter GDP to world GDP is 1.09 and is significant at the 1 percent level. Columns (2) and (3) show that the coefficient on the exporter GDP ratio is significant in each half of the sample period. The value is somewhat lower in the second period, but it is not significantly different from 1.
Columns (4)-(6) use the actual rather than the trend ratio of exporter GDP to world GDP and consider alternative assumptions about endogeneity. In column (4) the relative price of exports is treated as endogenous whereas the exporter GDP ratio is treated as exogenous. In column (5) all the independent variables are treated as exogenous and instruments are used only for the lagged dependent variable. In column (6) both the relative price of exports and the exporter GDP ratio are treated as endogenous and are instrumented with their second and third lags. In columns (4) and (5), the coefficient on the exporter GDP ratio is slightly above 1 and highly significant. In column (6), the coefficient on the exporter GDP ratio is even larger, but it has a large standard error. The very high coefficient on the lagged dependent variable in column (6) indicates a poor overall fit of this specification.
Overall, Tables 2 and 3 provide strong support for growth-led exports and the role of product varieties in trade. The effect on exports of growth in the exporting country is highly statistically significant and robust to a range of samples, specifications, and instruments.
V Conclusion
This paper shows how the Helpman-Krugman (1985) trade model can be implemented empirically by augmenting the standard Armington export demand equation with a term for the ratio of the exporting country's output relative to world output. The augmented equation is estimated using data on real exports between 1960 and 2004 for up to 96 countries. The effect of the exporter output ratio is highly significant and robust to alternative samples and specifications.
The results presented here show that positive productivity shocks need not lead to growing trade deficits or to secular declines in the terms of trade, as would be implied by most extant international macroeconomic models. These results suggest that macro models should switch from Armington to Helpman-Krugman specifications for trade flows. More broadly, these results lend support to public policies that pursue export-led growth by allaying concerns about immiserizing effects on a country's terms of trade.
Table 1: Change in Terms of Trade and Economic Growth, 1960-2004 (instrumental-variables estimates, robust standard errors)
| Variable | Benchmark (1) | Human Capital (2) | 1960-1980 (3) | 1980-2004 (4) | Per Capita Growth1 (5) | Manuf. & Services2 (6) | Industrial Countries (7) |
|---|---|---|---|---|---|---|---|
| Real GDP Growth | 0.006
(.184) |
0.044
(.150) |
0.063
(.229) |
0.249**
(.124) |
0.045
(.146) |
0.094
(.169) |
0.003
(.256) |
| Initial Years of Schooling3 | - |
-0.097
(.068) |
-0.130
(.118) |
-0.022
(.085) |
-0.097
(.068) |
-0.168*
(.083) |
-0.084
(.063) |
| Initial Life Expectancy3 | - |
0.059***
(.020) |
0.024
(.031) |
0.063**
(.025) |
0.056***
(.018) |
0.105**
(.038) |
-0.011
(.052) |
| Oil Exporter | 0.010*
(.006) |
0.009
(.006) |
0.038***
(.013) |
-0.006
(.006) |
0.009
(.006) |
n.a. |
n.a. |
| R2 | .10 |
.36 |
.39 |
.12 |
.36 |
.39 |
.15 |
| No. Obs. | 45 |
45 |
45 |
77 |
45 |
20 |
19 |
| First-Stage R2 | .53 |
.53 |
.58 |
.29 |
.63 |
.78 |
.83 |
***,
**, and * denote significance at the 1, 5, and 10 percent levels,
respectively. Average annual logarithmic change in terms of trade
regressed on log growth rate of real GDP, initial years of
schooling and life expectancy, and oil dummy. First stage
regression for real GDP growth includes initial years of schooling,
initial life expectancy, oil exporter dummy, initial per capita PPP
GDP, and population growth.
1 Real GDP growth replaced by real per
capita GDP growth. Population growth dropped from first stage
regression.
2 Sample includes countries for which
manufactured goods and services comprised more than 75 percent of
exports in 2004.
3 Coefficient and standard error scaled up
by factor of 100.
Table 2: Growth of Real Exports of Goods and Services, Equation (24), 1960-2004 (robust standard errors)
| Variable | Benchmark (1) | 1960-1982 (2) | 1982-2004 (3) | MAD1 (4) | IV PY/RPY2 (5) | IV Initial3 (6) | Manuf. & Services4 (7) | (X/Y) Stable5 (8) | (X/Y) Changing6 (9) |
|---|---|---|---|---|---|---|---|---|---|
-0.32 (.26) | -0.36 (.29) | -0.35*** (.10) | -0.41** (.18) | 1.55*** (.54) | 1.37* (.80) | 0.05 (.67) | -0.16 (.25) | -0.29 (.30) | |
1.46*** (.07) | 1.28*** (.08) | 1.56*** (.09) | 1.49*** (.07) | 1.92*** (.17) | 1.88*** (.18) | 1.73*** (.08) | 1.52*** (.08) | 1.33*** (.11) | |
1.50*** (.27) | 1.50*** (.28) | 1.10*** (.13) | 1.26*** (.16) | 1.94*** (.51) | 1.85*** (.54) | 1.61*** (.35) | 1.02*** (.31) | 1.99*** (.36) | |
| R2 | .56 | .48 | .45 | .56 | .28 | .30 | .59 | .39 | .68 |
| No. Obs. | 58 | 60 | 96 | 58 | 45 | 45 | 23 | 29 | 29 |
***,
**, and * denote significance at the 1, 5, and 10 percent levels,
respectively.
1 Minimum absolute deviation regression.
Foreign expenditure term replaced by a constant equal to average
growth of foreign expenditure over the sample.
2 Instruments are the same as in Table 1
(except oil dummy) plus the ratio of exporter to foreign GDP
deflator. First-stage R![]() = .27 for the relative
price of exports and .59 for the ratio of exporter GDP to world
GDP.
= .27 for the relative
price of exports and .59 for the ratio of exporter GDP to world
GDP.
3 Instruments are the same as in Table 1
(except oil dummy). First-stage R![]() = .20 for the
relative price and .53 for the exporter GDP ratio.
= .20 for the
relative price and .53 for the exporter GDP ratio.
4 Sample includes countries for which
manufactured goods and services comprised more than 75 percent of
exports in 2004.
5 Sample includes countries for which the
change in the share of exports in GDP lies between the
25![]() and 75
and 75![]() percentile of all available countries.
percentile of all available countries.
6 Sample includes countries for which the
change in the share of exports in GDP is either less than the
25![]() percentile or greater than the
75
percentile or greater than the
75![]() percentile.
percentile.
Table 3: Arellano-Bond Dynamic Panel Estimates of Equation (24) in Log Levels, 1960-2004 (robust standard errors)
| Variable | Trend Ratio of Exporter GDP1: Benchmark (1) | Trend Ratio of Exporter GDP1: 1960-1982 (2) | Trend Ratio of Exporter GDP1: 1982-2004 (3) | Actual Ratio of Exporter GDP: Benchmark (4) | Actual Ratio of Exporter GDP: PX Exog.2 (5) | Actual Ratio of Exporter GDP RY Endog.3 (6) |
|---|---|---|---|---|---|---|
| Lagged Dep. Var. | 0.72*** (.05) | 0.12 (.13) | 0.75*** (.08) | 0.74*** (.05) | 0.83*** (.06) | 0.92*** (.03) |
| Rel. Price Exports4 | -0.13 (.09) | -0.19 (.12) | -0.16 (.12) | -0.26** (.11) | -0.21 (.19) | -0.18 (.32) |
| Foreign Expenditure4 | 1.04*** (.30) | 1.19*** (.31) | 1.17 (.76) | 1.17*** (.29) | 1.28*** (.35) | 1.57** (.61) |
| Ratio of Exporter GDP to World GDP4 | 1.09*** (.27) | 1.15*** (.37) | 0.61** (.26) | 1.10*** (.36) | 1.11** (.55) | 1.77 (1.19) |
| No. Countries | 56 | 60 | 93 | 56 | 56 | 56 |
| No. Observations | 2408 | 1260 | 2139 | 2408 | 2408 | 2408 |
***,
**, and * denote significance at the 1, 5, and 10 percent levels,
respectively. Contemporaneous value and one lag of each regressor
are included in regression. Foreign expenditure and ratio of
exporter GDP to world GDP are treated as exogenous regressors. The
relative price of exports is instrumented by its second and third
lags. Regression includes only countries with complete data for
specified time periods. Estimation includes random country
effects.
1 Quadratic time trend for log ratio of
exporter GDP to world GDP estimated over available data for each
country independently.
2 The relative price of exports is treated
as an exogenous regressor.
3 The ratio of exporter GDP to world GDP
is instrumented by its second and third lags.
4 Reported coefficient is the long-run
effect of the independent variable.
Figure 1: Export Growth and Output Growth, 1960-2004
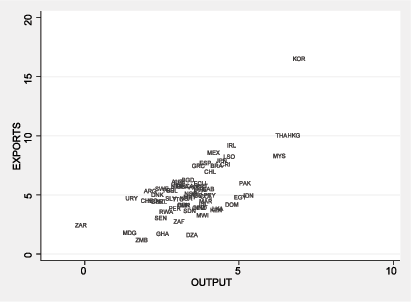
Figure 2: Change in Terms of Trade and Output Growth, 1960-2004
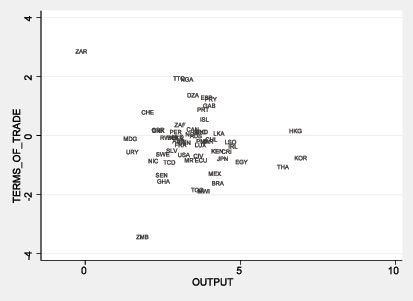
Figure 3: Economic Growth with Armington Export Demand
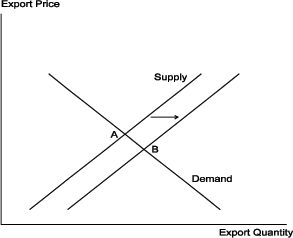
Figure 4: Economic Growth with Helpman-Krugman Export Demand
References
Acemoglu, Daron, and Jaume Ventura (2002) "The World Income Distribution," The Quarterly Journal of Economics 117, 659-694.
Anderson, James E., and Eric van Wincoop (2003) "Gravity with Gravitas: A Solution to the Border Puzzle," American Economic Review 93, 170-92.
Arellano, Manuel, and Stephen Bond (1991) "Some Tests of Specification for Panel Data: Monte Carlo Evidence and an Application to Employment Equations," The Review of Economic Studies 58, 277-97.
Armington, Paul S. (1969) "A Theory of Demand for Products Distinguished by Place of Production," IMF Staff Papers 16, 159-76.
Baier, Scott L., and Jeffrey H. Bergstrand (2001) "The Growth of World Trade: Tariffs, Transport Costs, and Income Similarity," Journal of International Economics 53, 1-27.
Barro, Robert, and Jong-Wha Lee (1993) "International Comparisons of Educational Attainment," Journal of Monetary Economics 32, 363-94.
Chari, V.V., Patrick J. Kehoe, and Ellen R. McGrattan (2002) "Can Sticky Price Models Generate Volatile and Persistent Real Exchange Rates?" Staff Report No. 277, Federal Reserve Bank of Minneapolis.
Dixit, Avinash, and Joseph Stiglitz (1977) "Monopolistic Competition and Optimum Product Diversity," American Economic Review 67, 297-308.
Erceg, Christopher, Luca Guerrieri, and Christopher Gust (2005) "SIGMA: A New Open-Economy Model for Policy Analysis," International Finance Discussion Paper No. 835, Board of Governors of the Federal Reserve System.
Gagnon, Joseph E. (2007) "Productive Capacity, Product Varieties, and the Elasticities Approach to the Trade Balance," Review of International Economics 15, 639-59.
Goldstein, Morris, and Mohsin Khan (1985) "Income and Price Elasticities in Trade," in Jones and Kenen (eds.) Handbook of International Economics, Volume II, North-Holland, Amsterdam.
Grossman, Gene, and Elhanan Helpman (1991) Innovation and Growth in the Global Economy, The MIT Press, Cambridge, MA.
Helpman, Elhanan, and Paul R. Krugman (1985) Market Structure and Foreign Trade: Increasing Returns, Imperfect Competition, and the International Economy, The MIT Press, Cambridge, MA.
Krugman, Paul (1989) "Differences in Income Elasticities and Trends in Real Exchange Rates," European Economic Review 33, 1055-85.
Laxton, Douglas, Peter Isard, Hamid Faruqee, Eswar Prasad, and Bart Turtelboom (1998) "MULTIMOD Mark III: The Core Dynamic and Steady-State Models," IMF Occasional Paper No. 164, International Monetary Fund.
Le Fouler, Laurence, Wim Suyker, and Dave Turner (2001) "Trade Linkages and the Trade Matrices in the OECD Interlink Model," Economics Department Working Papers No. 310, Organisation for Economic Cooperation and Development.
Levin, Andrew, John Rogers, and Ralph Tryon (1997) "Evaluating International Economic Policy with the Federal Reserve's Global Model," Federal Reserve Bulletin 83, 798-817.
Marquez, Jaime (2002) Estimating Trade Elasticities, Kluwer Academic Publishers, Boston.
McKinnon, Ronald (1964) "Foreign Exchange Constraint in Economic Development and Efficient Aid Allocation," Economic Journal 74, 388-409.
Pereira, Alfredo, and Zhenhui Xu (2000) "Export Growth and Domestic Performance," Review of International Economics 8, 60-73.
Roeger, Werner, and Jan in't Veld (1997) "QUEST II: A Multi Country Business Cycle and Growth Model," Economic Papers No. 123, European Commission.
Senhadji, Abdelhak, and Claudio Montenegro (1999) "Time Series Analysis of Export Demand Equations: A Cross-Country Analysis," IMF Staff Papers 46, 259-73.
Wyplosz, Charles (1991) "On the Real Exchange Rate Effect of German Unification," Weltwirtschaftliches Archiv 127, 1-17.
Data Appendix
Most of the data are obtained from the World Bank's World Development Indicators 2007 database. Expenditures are calculated as GDP plus imports minus exports. Initial per capita PPP GDP and population are obtained from the Penn World Tables version 6.2.33 Initial human capital data are obtained from the Barro-Lee dataset.34 Terms of trade is defined as the ratio of the export deflator for goods and services to the corresponding import deflator. In Tables 2 and 3, foreign data for each exporter are calculated as world minus exporter data. Data definitions for equation (24) are as follows:35
NX: Real exports of goods and services P![]() :
Export deflator
:
Export deflator
E: Nominal gross national expenditures P![]() :
Expenditures deflator
:
Expenditures deflator
Y: Real gross output (GDP) P![]() : GDP
deflator
: GDP
deflator
Country coverage is described in the following table.
Table A1: Data Availability by Country
| Country | Symbol | Trade Prices and Volumes: 1960 | Trade Prices and Volumes: 1982 | Trade Prices and Volumes: 2004 | Human Capital: 1960 | Man. & Serv.1: 2004 | Industrial2 |
|---|---|---|---|---|---|---|---|
| Algeria | DZA | x | x | x | x | -- | -- |
| Argentina | ARG | -- | x | x | x | -- | -- |
| Australia | AUS | x | x | x | x | -- | x |
| Austria | AUT | x | x | x | x | x | x |
| Belgium | BEL | x | x | x | x | x | x |
| Belize | BLZ | -- | x | x | -- | -- | -- |
| Benin | BEN | x | x | x | -- | -- | -- |
| Bolivia | BOL | -- | x | x | x | -- | -- |
| Botswana | BWA | -- | x | x | x | -- | -- |
| Brazil | BRA | x | x | x | x | -- | -- |
| Cameroon | CMR | -- | x | x | x | -- | -- |
| Canada | CAN | x | x | x | x | -- | x |
| Chad | TCD | x | x | x | -- | -- | -- |
| Chile | CHL | x | x | x | x | -- | -- |
| China | CHN | -- | x | x | -- | x | -- |
| Colombia | COL | -- | x | x | x | -- | -- |
| Comoros | COM | -- | x | x | -- | -- | -- |
| Congo (Zaire) | ZAR | x | x | x | x | -- | -- |
| Costa Rica | CRI | x | x | x | x | -- | -- |
| Cote d'Ivoire | CIV | x | x | x | -- | -- | -- |
| Denmark | DNK | x | x | x | x | x | x |
| Dominica | DMA | -- | x | x | -- | x | -- |
| Dominican Republic | DOM | -- | x | x | x | -- | -- |
| Ecuador | ECU | x | x | x | x | -- | -- |
| Egypt | EGY | x | x | x | -- | x | -- |
| El Salvador | SLV | x | x | x | x | -- | -- |
| Ethiopia | ETH | -- | x | x | -- | -- | -- |
| Finland | FIN | x | x | x | x | x | x |
| France | FRA | x | x | x | x | x | x |
| Gabon | GAB | x | x | x | -- | -- | -- |
| Gambia | GMB | -- | x | x | -- | x | -- |
| Germany | DEU | -- | x | x | x | x | x |
| Ghana | GHA | x | x | x | x | -- | -- |
| Greece | GRC | x | x | x | x | x | x |
| Grenada | GRD | -- | x | x | -- | x | -- |
| Guatemala | GTM | -- | x | x | x | -- | -- |
| Guinea-Bissau | GNB | -- | x | x | -- | -- | -- |
| Guyana | GUY | x | x | -- | x | -- | -- |
| Honduras | HND | x | x | x | x | -- | -- |
| Hong Kong | HKG | x | x | x | x | x | -- |
| Hungary | HUN | -- | x | x | x | x | -- |
| Iceland | ISL | x | x | x | -- | -- | x |
| India | IND | -- | x | x | x | -- | -- |
| Indonesia | IDN | -- | x | x | x | -- | -- |
| Iran | IRN | -- | x | x | x | -- | -- |
| Ireland | IRL | x | x | x | x | x | x |
| Italy | ITA | x | x | x | x | x | x |
| Japan | JPN | x | x | x | x | x | x |
| Jordan | JOR | -- | x | x | x | x | -- |
| Kenya | KEN | x | x | x | x | -- | -- |
| Korea | KOR | x | x | x | x | x | -- |
| Lesotho | LSO | x | x | x | x | -- | -- |
| Luxembourg | LUX | x | x | x | -- | x | x |
| Macao | MAC | -- | x | x | -- | x | -- |
| Madagascar | MDG | x | x | x | -- | -- | -- |
| Malawi | MWI | x | x | x | x | -- | -- |
| Malaysia | MYS | -- | x | x | x | x | -- |
| Mali | MLI | -- | x | x | x | -- | -- |
| Mauritania | MRT | x | x | x | -- | -- | -- |
| Mauritius | MUS | -- | x | x | x | x | -- |
| Mexico | MEX | x | x | x | x | x | -- |
| Morocco | MAR | x | x | x | -- | x | -- |
| Mozambique | MOZ | -- | x | x | x | -- | -- |
| Namibia | NAM | -- | x | x | -- | -- | -- |
| Netherlands | NLD | x | x | x | x | -- | x |
| New Zealand | NZL | -- | x | x | x | -- | x |
| Nicaragua | NIC | x | x | x | x | -- | -- |
| Nigeria | NGA | x | x | x | -- | -- | -- |
| Norway | NOR | x | x | x | x | -- | x |
| Pakistan | PAK | -- | x | x | x | x | -- |
| Panama | PAN | -- | x | x | x | x | -- |
| Paraguay | PRY | x | x | x | x | -- | -- |
| Peru | PER | x | x | x | x | -- | -- |
| Philippines | PHL | x | x | x | x | -- | -- |
| Portugal | PRT | x | x | x | x | x | x |
| Rwanda | RWA | x | x | x | -- | -- | -- |
| Senegal | SEN | x | x | x | x | -- | -- |
| South Africa | ZAF | x | x | x | x | -- | -- |
| Spain | ESP | x | x | x | x | x | x |
| Sri Lanka | LKA | x | x | x | x | x | -- |
| Sudan | SDN | x | x | -- | x | -- | -- |
| Swaziland | SWZ | -- | x | x | x | -- | -- |
| Sweden | SWE | x | x | x | x | x | x |
| Switzerland | CHE | x | x | x | x | x | x |
| Syria | SYR | -- | x | x | x | -- | -- |
| Thailand | THA | x | x | x | x | x | -- |
| Togo | TGO | x | x | x | x | -- | -- |
| Trinidad and Tobago | TTO | x | x | x | x | -- | -- |
| Tunisia | TUN | -- | x | x | x | x | -- |
| Uganda | UGA | -- | x | x | x | -- | -- |
| United Kingdom | GBR | x | x | x | x | x | x |
| United States | USA | x | x | x | x | x | x |
| Uruguay | URY | x | x | x | x | -- | -- |
| Venezuela | VEN | -- | x | x | x | -- | -- |
| Zambia | ZMB | x | x | x | x | -- | -- |
| Zimbabwe | ZWE | -- | x | x | x | -- | -- |
1 Countries for which manufactured goods
and services comprised more than 75 percent of exports in 2004.
Source: World Development Indicators 2007.
2 IMF definition.
Footnotes
1. Associate Director, Division of International Finance, Board of Governors of the Federal Reserve System. (Mail Stop 19, 2000 C Street NW, Washington, DC 20551; email: [email protected]) I would like to thank Jane Haltmaier, Jaime Marquez, Andrew Rose, and Robert Vigfusson for helpful comments. The views expressed here are my own and should not be interpreted as reflecting the views of the Board of Governors of the Federal Reserve System or of any other person associated with the Federal Reserve System. Return to text
2. This research dates back at least to McKinnon (1964). For subsequent work, see Pereira and Xu (2000) and the references cited therein. Return to text
3. Data sources and country coverage are documented in the Data Appendix. Return to text
4. See Erceg, Guerrieri, and Gust (2005) p. 34. The DGE model of Chari, Kehoe, and McGrattan (2002) has the same property. (Both of these DGE models allow for a continuum of product varieties, but the variety space is constant across countries and over time.) Other models with this property include New Keynesian models with rational expectations and traditional adaptive-expectations models. See, for example, Laxton, et. al. (1998), Le Fouler, Suyker, and Turner (2001), Levin, Rogers, and Tryon (1997), and Roeger and in't Veld (1997). Return to text
5. An extreme example is that of Wyplosz (1991), who predicted that German unification, by increasing long-run marketable German output around 25 percent, would cause a long-run real depreciation of the German exchange rate of around 25 percent. In the event, Germany's real exchange rate as measured by the International Monetary Fund has changed little on balance 16 years after unification. Return to text
6. An alternative model consistent with the lack of long-run correlation between export growth and the terms of trade is that of a small open economy whose exports are perfectly substitutable for foreign products. However, an extensive literature shows that for most countries, exports are far from perfect substitutes with foreign products. See, for example, Goldstein and Khan (1985) and Marquez (2002). Return to text
7. This dummy variable includes all OPEC members plus Cameroon, Rep. Congo, Egypt, Gabon, Malaysia, Norway, Trinidad and Tobago, and Tunisia. Using an OPEC-only dummy, as in Acemoglu and Ventura, does not affect the results. Source: Energy Information Administration, International Energy Annual 2002. Return to text
8. The sample could not be divided into equal halves because the human capital data are available only in years divisible by 5. Return to text
9. The coefficient on GDP growth in the second subsample is close to zero if only industrial countries are included. Return to text
10. Acemoglu and Ventura focus on the effect of growth through capital accumulation on the terms of trade. Their model allows for other sources of growth (population and technology) to increase exports without affecting the terms of trade, through a mechanism similar to that described in the next section. They find a negative and statistically significant effect of per capita growth on the terms of trade using these instruments, which are meant to proxy for the component of growth attributable to capital accumulation. Their results do not carry through to the latest vintage of World Bank data used here, even when the sample is restricted to their 1965-85 period. This may reflect the broader definition of the terms of trade-Acemoglu and Ventura use goods trade only-as well as somewhat different country coverage and possible revisions to the data. Within the original dataset used by Acemoglu and Ventura (from Barro and Lee (1993)) the results are sensitive to the selection of countries in the sample and the use of total versus per capita GDP. Return to text
11. The criterion was a share of manufactured goods and services in total exports of more than 75 percent. Return to text
12. For simplicity there is no capital stock. But labor can be interpreted as representing all factors of production. Return to text
13. Varieties refers both to different types of goods-such as televisions, cars, and toothpaste-and to different brands and models of the same type of goods. Return to text
14. For a review of the theoretical and empirical literature on the Armington export demand equation, see Gagnon (2007). The well-known gravity model of trade is a reduced form based on an Armington demand equation applied to bilateral trade. See, for example, Anderson and van Wincoop (2003). Time-series implementations of the gravity model share the property of the Armington equation that increases in export supply drive down the (unobserved) terms of trade. An important exception is Baier and Bergstrand (2001) who derive an equation for bilateral trade that allows for an endogenous effect of a country's income on export varieties. Rather than estimate the role of importer demand and exporter variety separately, B&B focus on the overall effect of income growth and income convergence. The lack of bilateral trade price data prevent B&B from separately identifying demand and supply parameters. Return to text
15. Grossman and Helpman (1991) employ a similar demand system with a richer supply side. Return to text
16. A well-known property of the Dixit-Stiglitz utility function is that the household purchases a positive amount of every variety available. Thus, it is best considered a representative household rather than an individual household. Return to text
17. Note that the elasticity of substitution is assumed equal across countries. This assumption aids in the derivation of a linear demand equation for estimation and it is also implicit in the cross-country empirical work of the next section, but it is not necessary for the fundamental result that export varieties, and thus export demand, increase with a country's total output. Return to text
18. Krugman (1989) employs a similar cost function and obtains the same pricing equation. Return to text
19. These equations imply that export prices equal domestic prices. Dropping the assumption of equal elasticity of substitution across countries would allow for differences between export and domestic prices. Return to text
20. The simple model used here implies a constant price markup over each firm's constant marginal cost in its own currency. But at the aggregate level, a country's export supply curve will slope downward in terms of the importer's currency through endogenous exchange rate adjustment, as discussed in the next section. Equation (23) is thus a true demand curve as it does not solve out the relative export price. Return to text
21. The empirical section below checks for robustness to the possibility that taste shocks may affect the regressors. Return to text
22. Higher output raises domestic spending and thus increases demand for imports. The balance of payments constraint forces the domestic currency to depreciate, choking off some of the extra import demand and reducing the price of exports in terms of foreign currency. Return to text
23. Gagnon (2007) estimates a related equation using bilateral U.S. imports of manufactures. Gagnon also reviews other empirical tests of the effect of product varieties on trade, most of which focus on direct measures of product variety. Return to text
24. Note that there is no intercept term in the regressions, consistent with the specification of equation (24) in growth rates. Moreover, the data do not permit the addition of an intercept term, as growth of foreign expenditure is nearly identical for all exporters, creating severe collinearity between this term and an intercept. Dropping the intercept introduces a bias in the coefficient on foreign expenditures coming from taste shocks that are common to all exporters. From the point of view of an exporting country, foreign taste shocks include changes in trade barriers and transportation costs. To the extent that trade barriers and transportation costs have fallen for all exporters, the coefficient on foreign expenditure is biased upward. The remaining coefficients are not affected by this bias. Return to text
25. Separating the exporter GDP ratio into a per capita GDP ratio and a population ratio leads to coefficients of 1.5 on the growth of the per capita ratio and 0.6 on the growth of the population ratio, with both coefficients highly significant. The difference between the coefficients is significant, perhaps reflecting some bias from the unobserved ratio of fixed versus marginal costs (Z in equation (24)), as technological progress contributes to per capita growth and not to population growth. Ideally, the contributions to growth from labor and capital should be separated from that of technology, but lack of capital stock and labor hours data prevent a precise test for different effects of factor supplies and technology growth on exports. Return to text
26. Similar results (not shown) obtain for the sub-sample periods. Return to text
27. These results are not sensitive to including the oil dummy in the instruments. Return to text
28. Senhadji and Montenegro (1999) report a median price elasticity of export demand of -0.78 across 53 countries. See, also, Marquez (2002). Return to text
29. Similar results obtain for the industrial countries and over the two subsamples. Return to text
30. As described in
Table 2, the cutoff points for this sample split are the
25![]() and 75
and 75![]() percentiles of growth in export shares. Return to text
percentiles of growth in export shares. Return to text
31. Arellano and Bond (1991) recommend using one-step standard errors for inference, but two-step estimates for the Sargan test of instrument restrictions. The Sargan tests reported here are based on the two-step estimator. Return to text
32. The trend for the log ratio of exporter GDP to world GDP is estimated as a quadratic function of time for each country independently. Return to text
33. Alan Heston, Robert Summers and Bettina Aten, Penn World Table Version 6.2, Center for International Comparisons of Production, Income and Prices at the University of Pennsylvania, September 2006. Return to text
34. See Barro and Lee (1993). A link to their dataset is at http://www.nber.org/data/. Return to text
35. All countries with available data were used in the regressions except for Bulgaria, which had strongly negative export growth in the second sub-sample that is related to its transition from a socialist to a market economy. No transition economy has data over the entire 44-year sample. Bulgaria, China, and Hungary have data over the 1982-2004 sub-sample period. Return to text
This version is optimized for use by screen readers. Descriptions for all mathematical expressions are provided in LaTex format. A printable pdf version is available. Return to text