
Board of Governors of the Federal Reserve System
International Finance Discussion Papers
Number 831, April 2005 --- Screen Reader
Version*
Adjusting Chinese Bilateral Trade Data: How Big is China's Trade Surplus?*
NOTE: International Finance Discussion Papers are preliminary materials circulated to stimulate discussion and critical comment. References in publications to International Finance Discussion Papers (other than an acknowledgment that the writer has had access to unpublished material) should be cleared with the author or authors. Recent IFDPs are available on the Web at http://www.federalreserve.gov/pubs/ifdp/. This paper can be downloaded without charge from the Social Science Research Network electronic library at http://www.ssrn.com/.
Abstract:
Hong Kong plays a prominent role as a re-exporter of a large percentage of trade bound for or coming from China. Current reporting practices in China and its trading partners do not fully reflect this role and therefore provide a misleading picture of the origin or ultimate destination of Chinese exports and imports. We adjust bilateral trade data for both China and its trading partners to correct for this problem. We also correct for differences due to markups in Hong Kong and different standards for reporting trade (c.i.f. versus f.o.b.). For 2003, we estimate that China's overall trade surplus was between $53 billion and $126 billion, larger than that reported in official Chinese data, but smaller than that reported by China's trading partners. We also provide evidence that, in general, the actual origin of a good that is transshipped through Hong Kong is correctly reported by the importing country, but the final destination of such goods is not correctly reported by the exporting country.
Keywords: China, bilateral trade data, exports, imports, re-exports
JEL classification: F10, F14
1 Introduction
Trade data are among the most commonly used economic data, and as with most economic data, its accuracy is generally taken for granted. While many economists are more skeptical about bilateral trade data than total trade figures, they are still taken more or less at face value, as evidenced, for example, by the frequent construction of trade-weighted indexes (e.g., real effective exchange rates or trade-weighted foreign GDP) and the number of papers that model bilateral trade. Chinese bilateral trade data, however, have not been afforded the benefit of the doubt, and some would argue that there is good reason.
In 2003 China reported total trade (the sum of exports and imports) with the United States of $126 billion and a trade surplus of $59 billion. The United States, on the other hand, reported total trade with China of $181 billion, and that China's surplus with the United States was $124 billion. The $65 billion discrepancy between the two reported trade balances is remarkable. In the same year, Hong Kong reported exports to China of over $95 billion, while China reported imports from Hong Kong of just over $11 billion. And most remarkably, in 2003, China and Japan reported trade deficits with one another!
In the current policy debate over China's exchange rate, China's overall trade balance is a frequently cited statistic. In 2003, China reported an overall trade surplus of $25 billion. However, as the numbers in the previous paragraph suggest, using trading partner data to determine China's overall trade balance will yield different results. This fact has not escaped attention. Ruskin (2003) reports that data from thirteen of China's largest trading partners show a collective trade deficit with China of $236 billion in 2002, while China reported a trade surplus with those countries of just $64 billion. Additionally, based on data for 43 of China's trading partners, the Fair Currency Alliance (FCA) (2004) reports that China's trade surplus exceeded $175 billion in 2003, as opposed to the $45 billion China reported for the same countries.1
The primary reason for the discrepancies in the bilateral data is the unique trade relationship that exists between China and Hong Kong. Much of China's international trade is transshipped through Hong Kong. That is, goods are exported to Hong Kong, and then reexported by Hong Kong to a final destination. In 2003, Hong Kong reported $124 billion of reexports that originated in China and $91 billion of re-exports to China that originated in one of China's trading partners. Hong Kong's role as an intermediary makes accurate reporting of bilateral trade difficult, because exporters often do not know if a good shipped to Hong Kong will remain there or be re-exported to another destination. Thus, if a good is exported from the United States to China through Hong Kong, it may mistakenly be reported by the United States as an export to Hong Kong, and/or mistakenly reported by China as an import from Hong Kong. Such misreporting can have a significant distorting effect on reported bilateral trade.
To get an estimate of China's actual overall trade balance, it is necessary to make adjustments to the reported trade figures of both China and its trading partners.2 To make these adjustments we adopt the basic methodologies used by Fung and Lau (1996, 1998, 2001, 2003) and Feenstra, et al (1999) to adjust China's trade balance with the United States. We refine the methodologies and apply them to the bilateral trade data for China and 69 of its trading partners. Our principal finding is that China's "actual" overall trade surplus was between $53 and $126 billion in 2003 (4 to 9 percent of GDP) --larger than the surplus officially reported by China, but much smaller than the combined surplus reported by China's trading partners. As a corollary, we find that the large discrepancies in trade balances stem primarily from Hong Kong's role as an intermediary in Chinese trade and not from deliberate misreporting of trade data as some authors have implied. We also provide evidence that, in general, the actual origin of a good that is transshipped through Hong Kong is correctly reported by the importing country, but the final destination of such goods is not correctly reported by the exporting country.
In the second section of this paper, we will discuss the basic problem and the necessity of adjusting the reported bilateral trade data. The third section of the paper describes the data we use to make the adjustments and the methodology used to make the adjustments. It also discusses the improvements we made to the estimates of previous authors. The fourth section discusses our estimates of the adjusted trade balances of China and its trading partners. The fifth section describes evidence suggesting that most countries can accurately determine the country of origin of imports that are re-exported through Hong Kong but cannot determine the final destination of exports that are re-exported through Hong Kong. In the sixth section of the paper we draw our conclusions.
2 The Basic Problem
Goods can enter or leave mainland China in two ways--they can be shipped directly, or they can travel through an intermediary such as Hong Kong (see Figures 1a and 1b). When goods travel directly from their origin to their final destination (i.e., they do not go through Hong Kong), they are subject to one adjustment in value, the addition of the amount charged for insurance and freight. Most countries include this additional cost in their reported imports, i.e., they report imports on a cost, insurance, and freight (c.i.f.) basis. However, most countries do not include this additional cost in their reported exports, i.e., they report exports on a free on board (f.o.b.) basis (See figures 2a and 2b). To determine actual levels of trade, it is important that we measure both imports and exports on the same basis. We adjust all data to an f.o.b. basis (hereafter referred to as a c.i.f. to f.o.b. adjustment, or simply a c.i.f. adjustment).
When trade is indirect (i.e., goods are re-exported through Hong Kong), the reported value of the goods are subject to three adjustments. The first comes from the cost of insurance and freight incurred traveling from the initial port to Hong Kong. The second comes from a markup applied to the goods while in Hong Kong. And the third comes fromthe additional cost of insurance and freight incurred traveling from Hong Kong to the final destination. As Figures 3a and 3b show, what China and a trading partner report will therefore be different, perhaps significantly so. To determine actual levels of trade, it is important that we remove both instances of additional cost due to the cost of insurance and freight, as well as the markup applied in Hong Kong.
In practice, when trade goes through Hong Kong the exporter and/or importer could incorrectly attribute it as trade with Hong Kong. This could happen, for example, if a Chinese exporter received an order from a company in Hong Kong. The Chinese company ships the goods and reports that they were exported to Hong Kong, which is how the transaction is recorded in Chinese trade statistics. The Hong Kong company receives the goods, adds some value, and then re-exports them to a final destination.3 Because they are defined by Hong Kong as re-exports, China will likely be listed in the documentation as the country of origin, and when the importing country receives the goods, it will record them as imports from China. In the absence of such documentation, the importing country could incorrectly attribute these goods as imports from Hong Kong. We assume that countries generally are unable to determine the final destination of indirect exports, but generally are able to determine the origin of indirect imports. We provide justification for these assumptions in section 5.
The following examples will further illustrate how discrepancies arise in bilateral trade data. For each of these examples, assume the following:
- China exports a single good to a trading partner, with a value of $100 (f.o.b.).
- Imports are recorded on a c.i.f. basis by the trading partner, which adds 5 percent to the value of a good.
- If a good is re-exported through Hong Kong, there is a 30 percent markup added there.
Example 1 - China directly exports the good to the trading partner
In this case, China reports exports of $100 to the trading partner and a bilateral trade surplus of $100. When the trading partner receives the good, however, it is recorded on a c.i.f. basis, meaning it is recorded as $105 of imports from China. Thus the trading partner reports a trade deficit with China of $105, and the trade balance discrepancy between China and the trading partner is $5.4
Example 2 - The same good is first re-exported through Hong Kong
As in the first example, China records exports to the trading partner of $100 and a trade surplus of the same amount. The good arrives in Hong Kong, where it is recorded as a $105 import (c.i.f. basis). Some value is added, and when the good leaves Hong Kong it is reported as a re-export of $136.50 ($105 + 30 percent markup). The good arrives in the trading partner and is recorded as an import from China valued at $143.33 (c.i.f. basis), and the trading partner reports a trade deficit with China of $143.33. The bilateral trade discrepancy in this case is $43.33. Notice that even though both China and the trading partner correctly attribute this trade to the correct partner country, the discrepancy is quite large.
Example 3 - Same as example 2, but the Chinese exporter does not know the final destination of its exported good.
In this case, China reports exports of $100 to Hong Kong and none to the trading partner. China reports a trade balance of $0 with the trading partner. As in Example 2, the good is reported as an import into the trading partner with a value of $143.33. Because the documentation that travels with goods re-exported through Hong Kong indicates the country of origin, the trading partner correctly attributes the import to China. The trading partner reports a trade deficit with China of $143.33, and the trade balance discrepancy is $143.33. The entire transaction shows up in the discrepancy.
3 Data and Methodology
3.1 Data
We collected official bilateral trade data from 69 of China's trading partners from the United Nations COMTRADE Database.5 We also obtained official Chinese data on exports to and imports from each of these 69 trading partners. In 2003, these 69 partners account for 94 percent of total China trade as reported by China. This includes 96 percent of total Chinese exports, and 91 percent of total Chinese imports. They also account for 98 percent of all Hong Kong re-exports to and from China. Our total sample size was limited by the availability of official trading partner data on bilateral trade with China. Table 1 presents a summary of China's 2003 trade with the 69 trading partners included in this study, as reported by China. Throughout the paper we report primarily on data for 2003, the latest year for which we have all of the necessary data.6
Table 2 summarizes the data we used to adjust import data from a c.i.f. basis to an f.o.b. basis. These data come from the Hong Kong Customs Administration, which reports import data on both an f.o.b. and c.i.f. basis for imports from China, the United States, the European Union, Taiwan, Korea, Singapore, Malaysia, and "Other" (the rest of the world). We also have U.S. data on imports by country of origin on both a c.i.f. and an f.o.b. basis.7 This leaves only three cases for which we do not know the value of the necessary adjustment from a c.i.f. basis to an f.o.b. basis: (1) a trading partner imports goods from Hong Kong (as occurs after a re-export leaves Hong Kong for its final destination), (2) China imports goods directly from a trading partner, and (3) a trading partner imports goods directly from China.
For case (1) we assume that the c.i.f. to f.o.b. adjustment for imports into a trading partner from Hong Kong is the same as the c.i.f. to f.o.b. adjustment for imports into Hong Kong from the trading partner. For example, Hong Kong reported that the c.i.f. adjustment adds 2 percent, on average, to the value of its imports from countries in the European Union. Thus, we assume that imports into countries in the European Union from Hong Kong would have a 2 percent c.i.f. markup. For countries for which Hong Kong does not report the c.i.f. adjustment, we use the data for a neighboring country or, in the absence of a reasonable substitute, the "Other" category.
For case (2), we assume that the c.i.f. to f.o.b. adjustment for Chinese direct imports from a trading partner is the same as it is for Hong Kong direct imports from that trading partner. We believe this is a reasonable assumption because the distance to China from most countries will be approximately the same as the distance to Hong Kong, and because the mode of transportation (air, sea, or land) will likely be the same in both cases. For example, we assume that the c.i.f. adjustment for Chinese direct imports from countries in the European Union is 2 percent, just as it is for Hong Kong direct imports from countries in the European Union.
For case (3) we assume that the adjustment will be the same as it is in case (2).8 Thus, since we assume that the c.i.f. adjustment for Chinese direct imports from countries in the European Union is 2 percent, we assume the same adjustment for European Union country direct imports from China. Table 3 summarizes the data we have on c.i.f. to f.o.b. adjustments, and our assumptions for countries for which no data are available.
To determine actual levels of indirect trade we use data on re-exports, harmonized by country of origin and country of destination, which we obtained from the Hong Kong Census and Statistics Department. Additionally, we have estimates from the Hong Kong Census and Statistics Department of the size of the markup that occurs in Hong Kong for goods that come from China, and an average markup for goods traveling from origins other than China.9 These estimates are shown in Table 4.
3.2 Methodological Improvements
We adjust both the Chinese and the trading partner data using a process very similar to the ones described in Fung and Lau(1996, 1998, 2001, 2003) and Feenstra, et al (1999). In those papers, the authors only adjusted U.S. and Chinese bilateral trade data. We apply our slightly modified process to Chinese bilateral trade with 69 trading partners.10 In addition, we improve the estimates from these earlier papers by using more accurate data on some of the adjustments. Using various data sources, we find that the average c.i.f. to f.o.b. adjustment is only one to two percentage points, whereas Fung and Lau used the IMF's ten percent rule of thumb (see footnote 6), and Feenstra, et al (1999) used a six percent adjustment.11 Further, we use U.S. Census Bureau data on the c.i.f. adjustment for imports into the United States to estimate the c.i.f. adjustment for Chinese and Hong Kong direct imports from the United States.
One significant difference between Fung and Lau (1996, 1998, 2001, 2003) and our own work is that we assume that all countries, including China, can correctly identify the country of origin of indirect imports.12 In section 5 we explore this assumption and provide evidence that it is reasonable.
3.3 Methodology
Table 5 summarizes the necessary calculations for adjusting a country's exports, using data on bilateral trade between the United States and China data as an example. Figure 4 illustrates the adjustments graphically. A country's adjusted exports will consist of two components. The first is reported exports. Since these are already on an f.o.b. basis, no adjustment is necessary (Table 5, lines 1 and 6). Since we assume that countries do not know the final destination of their indirect exports, we need to add each country's indirect exports to its reported exports. Indirect exports are obtained using Hong Kong's reported re-exports data (Table 5, lines 2 and 7). Before adding the Hong Kong re-export data, however, two adjustments are necessary. The value of re-exports reported by Hong Kong includes the value added in Hong Kong and the c.i.f. charges incurred traveling to Hong Kong. We adjust reported re-exports using the values summarized in tables 3 and 4. This adjusted re-exports value is equivalent to indirect exports. We then add the adjusted re-exports (Table 5, lines 3 and 8) to reported direct exports to get the country's total actual exports with its partner (Table 5, lines 5 and 10).
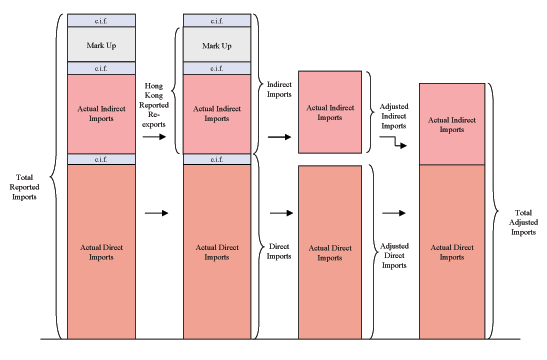
Adjusting reported imports is slightly more complicated. The adjustments are illustrated graphically in Figure 5, and the necessary calculations are summarized in Table 6 for the U.S. and Chinese data. Since we assume that each country knows the origin of its imports, even when the goods go through Hong Kong, we assume total reported imports (Table 6, lines 1 and 9) consist of both direct and indirect imports. We need to adjust these reported data to remove the various c.i.f. charges and the markup added to indirect imports in Hong Kong. This adjustment is complicated, because in order to remove c.i.f. charges, total imports must first be separated into direct and indirect imports. This is necessary because goods traveling from Hong Kong will sometimes be subject to a different c.i.f adjustment than will direct imports. We start with Hong Kong's reported re-exports (Table 6, lines 2 and 10). To this we add the c.i.f. charges that are incurred traveling from Hong Kong to the final destination. This gives us an estimate of the value of indirect imports at the time of import (Table 6, lines 5 and 13) and allows us to break total reported imports into our estimate of indirect and direct imports. For direct imports (Table 6, lines 6 and 14), we adjust the data to an f.o.b. basis using the figures in Table 3 (adjusted data are in Table 6, lines 7 and 15). For indirect imports, we use the figures in Tables 3 and 4 to remove both c.i.f. charges, as well as the markup added in Hong Kong (Table 6, lines 3 and 11).13 Finally, we add adjusted direct imports and adjusted indirect imports to get our estimate of total actual imports (Table 6, lines 8 and 16).
After we make these adjustments, we can observe our estimate of China's actual bilateral trade balances for 68 of the 69 trading partners in the dataset. The remaining trading partner is Hong Kong.14 Adjustments to China-Hong Kong bilateral trade depend on the adjustments that we make to the other trade balances. Any indirect trade that is reattributed to China or its trading partners must also be "un-attributed" from trade with Hong Kong. For example, under our current assumptions, China does not correctly determine the final destination of its exports and therefore incorrectly attributes some of its exports as exports to Hong Kong. To correct China's trade balance, we must therefore not simply attribute adjusted re-exports to each of China's bilateral trade figures, but we must also un-attribute those re-exports from China's reported exports to Hong Kong. 15 Additionally, we must make a similar adjustment to Hong Kong's reported imports from China.16 17 Table 7 summarizes the adjustments that must be made to China's bilateral trade data with Hong Kong due to reattribution of trade to other countries.
4 Adjusted Trade Balances
The reported bilateral trade data for China and its trading partners for 2003 are summarized in Table 8. For the 69 trading partners for whom we have data, China reported a total trade surplus of $42 billion in 2003, while those 69 trading partners reported that China's surplus was $219 billion. There are a number of countries, most notably Japan, Germany, Malaysia, Iran, and India for which both China and the partner reported having a trade deficit with the other. Because of this, the absolute discrepancy between the balances reported by China and its trading partners is actually larger than what you get by comparing the $42 billion and $219 billion figures, which net out some of these effects. The final column of Table 8 shows the discrepancy between the balances reported by each country. The United States has the largest discrepancy with China, while Japan, Taiwan, and Germany have the three next largest, respectively. The sum of these bilateral discrepancies for the 69 trading partners in our sample was $312 billion in 2003.
The 2003 adjusted bilateral trade data for China and its trading partners are shown in Table 9. For the 69 trading partners, China's adjusted trade surplus was $53 billion in 2003. The adjusted data for the 69 trading partners indicate that China's trade surplus was $126 billion. The discrepancy has narrowed from $312 billion to $125 billion--a reduction of $187 billion or 60 percent. Some of the improvements are worth noting. The Japanese-Chinese discrepancy is reduced by $29 billion, or almost 90 percent. China reported a trade surplus with the United States of $59 billion, while the U.S. reported that surplus to be $124 billion. After the adjustments described above, China's trade surplus with the United States is $86 billion according to the adjusted Chinese data, and $110 billion according to the adjusted U.S. data. The discrepancy is reduced from $66 billion to $24 billion.
5 Do Countries Know Who Their Trading Partners Are?
Most countries claim that they act according to United Nations guidelines in compiling trade statistics, which is to record imports based on the country of origin and to record exports based on the country of final destination. 18 Obviously this would be ideal, but we find reason to be skeptical of countries' ability to follow these guidelines. It can be tremendously difficult to determine the final destination of indirect exports. At the time of export, exporters themselves may not know the final destination of their goods, which means that even with the best intentions a country can make errors in the attribution of their trade.
We are less skeptical of countries' ability to determine correctly the country of origin of their indirect imports, because Hong Kong trade authorities require re-exporters to maintain a paper trail that includes the origin of the goods, which is passed along to the importing country. Thus, it is reasonable to assume that countries correctly record the country of origin of their imports, even when the goods pass through Hong Kong.
Fung and Lau (1996, 1998, 2001, 2003) treat official Chinese data as only reflecting direct trade. That means that any trade with Hong Kong, whether it involves re-exports or not, is treated as trade with Hong Kong. For the United States, they assume that the U.S. correctly identifies China as the origin of imports that are re-exported through Hong Kong, but that U.S. export data only reflect direct trade. Feenstra et al (1999) adopt the same set of assumptions that we have in this paper, treating U.S. and Chinese export data as only reflecting direct trade, while assuming U.S. and Chinese import data reflect both direct and indirect trade.
5.1 Determining the Best Set of Assumptions
In order to provide evidence that the assumptions we utilize here are reasonable, we look at the sixteen different cases that result from varying the following four basic assumptions: partner countries correctly attribute imports to the original country, partner countries correctly attribute exports to the final destination, China correctly attributes imports to the original country, and China correctly attributes exports to the final destination.19 We assume that each country falls into one of these cases, which we have called "types". Table 10 summarizes the assumptions we make under each type. The U.N. recommendations, which state that each country should attempt to identify correctly the origin and final destination of goods that are transshipped, correspond to Type 4. The assumptions made by Fung and Lau correspond to Type 0. We maintain, as did Feenstra et al (1999), that Type 1 makes the most sense.
Since the appropriate set of assumptions is not absolutely clear, we adjust each country's bilateral trade data under each of the sixteen sets of assumptions (types). We then observe whether or not there is a particular type that minimizes the bilateral trade balance discrepancies and/or the total trade differential.20 Results obtained under such a method are not conclusive, but they do offer insight into which set of assumptions might be most appropriate.21 Considering the strong patterns that result from this exercise, the results are at least helpful in forging our final conclusions.
Our results overwhelmingly suggest that the Type 1 assumptions are the best set of assumptions for minimizing both the trade balance discrepancy and the total trade discrepancy. Tables 11 and 12 show the trade balance discrepancy and total trade differential for China's largest trading partners under each type. The type that minimizes the discrepancy is in bold. In most countries (especially the largest trading partners), Type 1 was clearly the best choice, and in several other cases, it was nearly the minimizing type.
Interestingly, most of the countries whose trade balance discrepancies were not minimized under Type 1 are countries that share a land border with China, for example Vietnam, Pakistan, and Russia, and where re-exports are a very small fraction of trade. Hence, the assumption of whether re-exports are correctly attributed to the actual trading partner is not as important for those countries. In addition, the Netherlands and Singapore are themselves large re-exporters, which may help explain why Type 1 does not minimize the discrepancies for those countries. Finally, only Indonesia's discrepancy (and the U.K.'s differential) was minimized as Type 4, which corresponds to the U.N. recommendations that most countries claim to follow.
5.2 Variations on our Best Assumption
Up till now we have assumed that countries either correctly attributed all trade in one direction or none. We are comfortable with this assumption with respect to trading partners correctly determining the origin of imports that have passed through Hong Kong, because of the documentation that should travel with those goods. For exports, however, assuming that the exporting country is never able to determine the ultimate destination of goods that pass through Hong Kong seems somewhat unrealistic.22 In reality, we might expect countries to get it right sometimes and wrong others. Thus, we now explore varying the fraction of exports that are correctly attributed to the ultimate importer.
Table 13 summarizes China's adjusted overall trade balance and the discrepancies between adjusted Chinese and trading partner data, as we allow the percentage of exports that are correctly attributed to the trading partner (by China and/or its trading partners) to vary from zero to 100 percent in ten percentage point increments. The total discrepancy is minimized when it is assumed that China correctly attributes somewhere between 0 and 30 percent of its exports through Hong Kong to the ultimate trading partner. Interestingly, as we vary the percentage of exports that China's trading partners correctly attributed, we find that the discrepancy is minimized when we assume that they never correctly identify China as the trading partner when exports go through Hong Kong.
6 Conclusion
Given our analysis, we believe that China's trade surplus is larger than indicated in China's official data but significantly smaller than indicated in the data of its trading partners. The adjusted data we have suggest that in 2003 the actual trade surplus was in the range of $53 billion and $126 billion. The upper end of this is probably too high because we do not have trading partner data for over 100 trading partners, and with these trading partners China reported a cumulative trade deficit of $17 billion in 2003 (after adjustments this becomes a deficit of $13 billion). Moreover, even at the upper end of this range the trade surplus would be 9 percent of China's GDP, small in comparison to some other Asian economies.
Some have suggested that the discrepancies between Chinese and trading partner data are the result of attempts by the Chinese authorities to understate their trade surplus. Because the majority of the discrepancy is eliminated by the adjustments we make, we reject the argument that deliberate misreporting is the primary factor behind the sizable discrepancy. In fact, as in the case of Japan, the adjustments we made to the trade data often led to an almost complete elimination of the trade balance discrepancy. Clearly, the majority of the discrepancy is due to the role of Hong Kong as a trade intermediary in a great deal of Chinese trade. While some of the remaining discrepancy may be due to misreporting, it is a much smaller problem than some have insinuated.
Finally, we find evidence that, in general, the actual origin of a good that is transshipped through Hong Kong is correctly reported by the importing country, but the final destination of such goods is not correctly reported by the exporting country. In a more detailed analysis, we estimate that China is able to determine correctly the final destination of somewhere between 0 and 30 percent of such goods.
References
Fair Currency Alliance (2004). Fair Currency Alliance currency manipulation fact sheet. www.steelnet.org.
Feenstra, R. C., Hai, W., Woo, W. T., & Yao, S. (1999). Discrepancies in international data: An application to China-Hong Kong entrpot trade. American Economic Review Papers and Proceedings, 89, 338-343.
Fung, K. C., & Lau, L. J. (1996, April). The China-United States bilateral trade balances: How big is it really? Occasional Paper, Asia/Pacific Research Center, Institute for International Studies, Stanford University.
Fung, K. C., & Lau, L. J. (1998)![]() The
China-United States bilateral trade balances: How big is it really?
Pacific Economic Review, 3, 33-47.
The
China-United States bilateral trade balances: How big is it really?
Pacific Economic Review, 3, 33-47.
Fung, K. C., & Lau, L. J. (2001). New estimates of U.S.-China bilateral trade balances? Journal of Japanese and International Economies, 15, 102-130.
Fung, K. C., & Lau, L. J. (2003). Adjusted estimates of United States-China bilateral trade balances: 1995-2002. Journal of Asian Economics, 14, 489-496.
Hong Kong Census and Statistics Department (various years). Hong Kong Monthly Digest of Statistics. Hong Kong Government.
International Trade Centre. http://www.intracen.org.
Ruskin, Alan (2003). All roads lead to China. http://www.4castweb.com.
United Nations Department of Economic and Social Affairs, Statistics Division (1998). International merchandise trade statistics: Concepts and definitions. United Nations.
Figure 1a: Chinese Exports
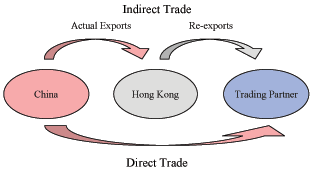
Figure 1b: Chinese Imports
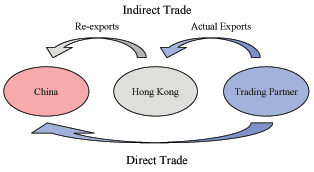
Figure 2a: Direct Trade from China
c.i.f. = Cost, insurance, freight.
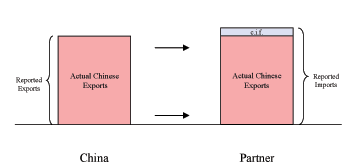
Figure 2b: Direct Trade to China
c.i.f. = Cost, insurance, freight.
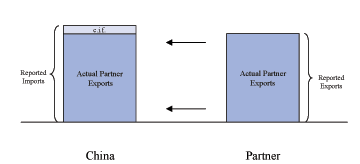
Figure 3a: Indirect Trade from China
c.i.f. = Cost, insurance, freight.
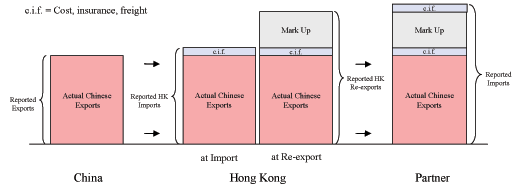
Figure 3b: Indirect Trade to China
c.i.f. = Cost, insurance, freight.
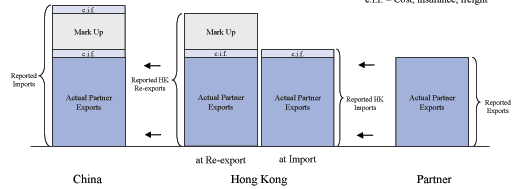
Figure 4: Adjusting Exports
c.i.f. = Cost, insurance, freight.
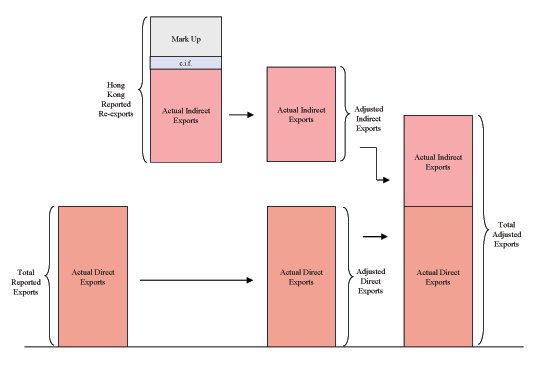
Figure 5: Adjusting Imports
c.i.f. = Cost, insurance, freight.
1 Trade partners included in tables include all countries for which total trade with China exceeded $4.0 billion USD in 2003, as reported by China. For data for countries included in this study but not listed in the tables please contact the authors.
2 Chile, Argentina, Panama, Peru, Venezuela, Costa Rica.
3 Includes countries for which partner data was not available at the time of this study. Figure represents the difference between total trade for the region, or regions, less the sum of trade values for countries included in this study, as reported by China.
4 Kazakhstan, Turkey, Pakistan, Oman, Israel, Macau, Bangladesh, Sri Lanka, Mongolia, Brunei.
5 Switzerland, Finland, Hungary, Denmark, Ireland, Ukraine, Poland, Austria, Norway, Czech Republic, Greece, Romania, Portugal, Slovakia, Malta, Lithuania, Slovenia, Estonia, Latvia, Iceland.
6 South Africa, New Zealand, Sudan, Nigeria, Egypt.
Table 1: Chinese Trade in 2003 (USD, bn)1 - Panel A: Western Hemisphere
| Country | Exports | Imports | Total Trade |
|---|---|---|---|
| US | 92.5 | 33.9 | 126.4 |
| Canada | 5.6 | 4.4 | 10.0 |
| Brazil | 2.1 | 5.8 | 8.0 |
| Mexico | 3.3 | 1.7 | 4.9 |
| Other, Included2 | 3.9 | 6.9 | 10.7 |
| Other, Excluded3 | 2.6 | 0.5 | 3.1 |
| Total | 110.0 | 53.2 | 163.2 |
Table 1: Chinese Trade in 2003 (USD, bn)1 - Panel B: Asia / Middle East
| Country | Exports | Imports | Total Trade |
|---|---|---|---|
| Japan | 59.4 | 74.1 | 133.6 |
| Hong Kong | 76.3 | 11.1 | 87.5 |
| Korea | 20.1 | 43.1 | 63.2 |
| Taiwan | 9.0 | 49.4 | 58.4 |
| Malaysia | 6.1 | 14.0 | 20.1 |
| Singapore | 8.9 | 10.5 | 19.3 |
| Thailand | 3.8 | 8.8 | 12.7 |
| Indonesia | 4.5 | 5.7 | 10.2 |
| Philippines | 3.1 | 6.3 | 9.4 |
| India | 3.3 | 4.3 | 7.6 |
| Saudi Arabia | 2.1 | 5.2 | 7.3 |
| Iran | 2.3 | 3.3 | 5.6 |
| Vietnam | 3.2 | 1.5 | 4.6 |
| Other, Included4 | 10.0 | 6.3 | 16.4 |
| Other, Excluded3 | 10.1 | 29.2 | 39.4 |
| Total | 222.4 | 272.9 | 495.3 |
Table 1: Chinese Trade in 2003 (USD, bn)1 - Panel C: Europe
| Country | Exports | Imports | Total Trade |
|---|---|---|---|
| Germany | 17.4 | 24.3 | 41.7 |
| Russia | 6.0 | 9.7 | 15.8 |
| Netherlands | 13.5 | 1.9 | 15.4 |
| UK | 10.8 | 3.6 | 14.4 |
| France | 7.3 | 6.1 | 13.4 |
| Italy | 6.7 | 5.1 | 11.7 |
| Belgium & Luxembourg | 4.2 | 2.9 | 7.1 |
| Spain | 3.9 | 1.4 | 5.3 |
| Sweden | 1.5 | 2.7 | 4.2 |
| Other, Included5 | 16.2 | 11.8 | 28.0 |
| Other, Excluded3 | 0.8 | 0.2 | 1.0 |
| Total | 88.4 | 69.7 | 158.1 |
Table 1: Chinese Trade in 2003 (USD, bn)1 - Panel D: Oceania / Africa
| Country | Exports | Imports | Total Trade |
|---|---|---|---|
| Australia | 6.3 | 7.3 | 13.6 |
| Other, Included6 | 6.0 | 4.5 | 10.6 |
| Other, Excluded3 | 5.2 | 5.1 | 10.3 |
| Total | 17.5 | 17.0 | 34.4 |
Table 1: Chinese Trade in 2003 (USD, bn)1 - Panel E: Totals
| Totals | Exports | Imports | Total Trade |
|---|---|---|---|
| Total Included | 419.6 (96%) | 377.6 (91%) | 797.2 (94%) |
| Total Excluded | 18.6 | 35.2 | 53.8 |
| Total | 438.2 | 412.8 | 851.0 |
1 Trade partners included in tables include all countries for which total trade with China exceeded $4.0 billion USD in 2003, as reported by China. For data for countries included in this study but not listed in the tables please contact the authors.
2 Chile, Argentina, Panama, Peru, Venezuela, Costa Rica.
3 Includes countries for which partner data was not available at the time of this study. Figure represents the difference between total trade for the region or regions, less the sum of trade values for countries included in this study, as reported by China.
4 Kazakhstan, Turkey, Pakistan, Oman, Israel, Macau, Bangladesh, Sri Lanka, Mongolia, Brunei.
5 Switzerland, Finland, Hungary, Denmark, Ireland, Ukraine, Poland, Austria, Norway, Czech Republic, Greece, Romania, Portugal, Slovakia, Malta, Lithuania, Slovenia, Estonia, Latvia, Iceland.
6 South Africa, New Zealand, Sudan, Nigeria, Egypt.
Table 2: c.i.f. adjustment by Exporting Country
| Country | Percent1 |
|---|---|
| China | 0.80 |
| Japan | 1.14 |
| EU | 2.00 |
| Taiwan | 0.79 |
| USA | 2.20 |
| Republic of Korea | 1.29 |
| Singapore | 1.29 |
| Malaysia | 1.51 |
| Others | 2.42 |
| Total | 1.27 |
Source: Hong Kong Census and Statistics Department.
1 The numbers in the table are the amount, in percent terms, that must be added to the imports to get from an f.o.b. basis to a c.i.f. basis for 2003.
Table 3: c.i.f. Adjustments to Imports by Country - Panel A: Hong Kong Imports
| Country | f.o.b.-c.i.f. markup (%) 2003 | Are Hong Kong Data Available? | Country Used as Proxy |
|---|---|---|---|
| China | 0.80 | Y | - |
| United States | 2.20 | Y | - |
| Canada | 2.20 | N | US |
| Brazil | 2.20 | N | US |
| Mexico | 2.20 | N | US |
| Japan | 1.14 | Y | - |
| Korea | 1.29 | Y | - |
| Taiwan | 0.79 | Y | - |
| Malaysia | 1.51 | Y | - |
| Singapore | 1.29 | Y | - |
| Thailand | 1.29 | N | Korea |
| Indonesia | 1.51 | N | Malaysia |
| Philippines | 1.51 | N | Malaysia |
| India | 2.42 | N | Other |
| Saudi Arabia | 2.42 | N | Other |
| Iran | 2.42 | N | Other |
| Vietnam | 1.51 | N | Malaysia |
| Germany | 2.00 | N | EU |
| Russia | 2.42 | N | Other |
| Netherlands | 2.00 | N | EU |
| UK | 2.00 | N | EU |
| France | 2.00 | N | EU |
| Italy | 2.00 | N | EU |
| Belgium Luxembourg | 2.00 | N | EU |
| Spain | 2.00 | N | EU |
| Sweden | 2.00 | N | EU |
| Australia | 2.42 | N | Other |
| Hong Kong | - | - | - |
Table 3: c.i.f. Adjustments to Imports by Country - Panel B: Imports from Hong Kong
| Country | f.o.b.-c.i.f. markup (%) 2003 | Estimated? Using which data? |
|---|---|---|
| China | 0.80 | Y-HK |
| United States | 4.94 | N |
| Canada | 2.20 | Y-HK |
| Brazil | 2.20 | Y-HK |
| Mexico | 2.20 | Y-HK |
| Japan | 1.14 | Y-HK |
| Korea | 1.29 | Y-HK |
| Taiwan | 0.79 | Y-HK |
| Malaysia | 1.51 | Y-HK |
| Singapore | 1.29 | Y-HK |
| Thailand | 1.29 | Y-HK |
| Indonesia | 1.51 | Y-HK |
| Philippines | 1.51 | Y-HK |
| India | 2.42 | Y-HK |
| Saudi Arabia | 2.42 | Y-HK |
| Iran | 2.42 | Y-HK |
| Vietnam | 1.51 | Y-HK |
| Germany | 2.00 | Y-HK |
| Russia | 2.42 | Y-HK |
| Netherlands | 2.00 | Y-HK |
| UK | 2.00 | Y-HK |
| France | 2.00 | Y-HK |
| Italy | 2.00 | Y-HK |
| Belgium Luxembourg | 2.00 | Y-HK |
| Spain | 2.00 | Y-HK |
| Sweden | 2.00 | Y-HK |
| Australia | 2.42 | Y-HK |
| Hong Kong | - | - |
Table 3: c.i.f. Adjustments to Imports by Country - Panel C: China Imports
| Country | f.o.b.-c.i.f. markup (%) 2003 | Estimated? Using which data? |
|---|---|---|
| China | - | - |
| United States | 7.14 | Y-US |
| Canada | 2.20 | Y-HK |
| Brazil | 2.20 | Y-HK |
| Mexico | 2.20 | Y-HK |
| Japan | 1.14 | Y-HK |
| Korea | 1.29 | Y-HK |
| Taiwan | 0.79 | Y-HK |
| Malaysia | 1.51 | Y-HK |
| Singapore | 1.29 | Y-HK |
| Thailand | 1.29 | Y-HK |
| Indonesia | 1.51 | Y-HK |
| Philippines | 1.51 | Y-HK |
| India | 2.42 | Y-HK |
| Saudi Arabia | 2.42 | Y-HK |
| Iran | 2.42 | Y-HK |
| Vietnam | 1.51 | Y-HK |
| Germany | 2.00 | Y-HK |
| Russia | 2.42 | Y-HK |
| Netherlands | 2.00 | Y-HK |
| UK | 2.00 | Y-HK |
| France | 2.00 | Y-HK |
| Italy | 2.00 | Y-HK |
| Belgium Luxembourg | 2.00 | Y-HK |
| Spain | 2.00 | Y-HK |
| Sweden | 2.00 | Y-HK |
| Australia | 2.42 | Y-HK |
| Hong Kong | 0.80 | Y-HK |
Table 3: c.i.f. Adjustments to Imports by Country - Panel D: Imports from China
| Country | f.o.b.-c.i.f. markup (%) 2003 | Estimated? Using which data? |
|---|---|---|
| China | - | - |
| United States | 7.14 | N |
| Canada | 2.20 | Y-HK |
| Brazil | 2.20 | Y-HK |
| Mexico | 2.20 | Y-HK |
| Japan | 1.14 | Y-HK |
| Korea | 1.29 | Y-HK |
| Taiwan | 0.79 | Y-HK |
| Malaysia | 1.51 | Y-HK |
| Singapore | 1.29 | Y-HK |
| Thailand | 1.29 | Y-HK |
| Indonesia | 1.51 | Y-HK |
| Philippines | 1.51 | Y-HK |
| India | 2.42 | Y-HK |
| Saudi Arabia | 2.42 | Y-HK |
| Iran | 2.42 | Y-HK |
| Vietnam | 1.51 | Y-HK |
| Germany | 2.00 | Y-HK |
| Russia | 2.42 | Y-HK |
| Netherlands | 2.00 | Y-HK |
| UK | 2.00 | Y-HK |
| France | 2.00 | Y-HK |
| Italy | 2.00 | Y-HK |
| Belgium Luxembourg | 2.00 | Y-HK |
| Spain | 2.00 | Y-HK |
| Sweden | 2.00 | Y-HK |
| Australia | 2.42 | Y-HK |
| Hong Kong | 0.80 | N |
HK = Hong Kong
US = United States
EU = European Union
Table 4: Hong Kong Rate of Re-export Markup by Country of Origin: Markup as % of value when goods are re-exported
| Year | Mainland China | Others | Overall |
|---|---|---|---|
| 1993 | 26.1 | 7.8 | 18.3 |
| 1994 | 24.9 | 5.7 | 16.7 |
| 1995 | 24.7 | 5.6 | 16.5 |
| 1996 | 25.6 | 6.2 | 17.3 |
| 1997 | 25.7 | 6.9 | 17.8 |
| 1998 | 26.0 | 7.9 | 18.7 |
| 1999 | 27.7 | 8.8 | 20.3 |
| 2000 | 28.5 | 9.5 | 21.1 |
| 2001 | 27.0 | 9.6 | 20.2 |
| 2002 | 25.5 | 9.3 | 19.1 |
| 2003 | 23.9 | 9.0 | 17.9 |
The data, provided by the Hong Kong Census and Statistics Department, are reported as a percentage of re-export value.
Table 5: Adjusting U.S. and Chinese Bilateral Exports - Panel A: Adjusting U.S. Exports to China
| Exports in USD, bn. | 1993 | 1994 | 1995 | 1996 | 1997 | 1998 | 1999 | 2000 | 2001 | 2002 | 2003 |
|---|---|---|---|---|---|---|---|---|---|---|---|
| 1) U.S. reported exports to China, f.o.b. | 8.7 | 9.2 | 11.7 | 11.9 | 12.8 | 14.2 | 13 | 16.1 | 19.1 | 22 | 28.3 |
| 2) Reported re-exports from U.S. to China | 3.2 | 3.7 | 5 | 5.9 | 6 | 5.3 | 5.4 | 6.1 | 6.5 | 6.2 | 6.2 |
| 3) Re-exports f.o.b., less markups | 2.8 | 3.4 | 4.5 | 5.3 | 5.4 | 4.7 | 4.8 | 5.4 | 5.7 | 5.5 | 5.6 |
| 4) Value added to U.S. exports in HK (Line 2 - Line 3) | 0.4 | 0.4 | 0.5 | 0.6 | 0.6 | 0.6 | 0.6 | 0.7 | 0.8 | 0.7 | 0.7 |
| 5) Adjusted U.S. exports, f.o.b. (line 1 + line3) | 11.5 | 12.6 | 16.3 | 17.2 | 18.2 | 18.9 | 17.8 | 21.5 | 24.8 | 27.5 | 33.8 |
Table 5: Adjusting U.S. and Chinese Bilateral Exports - Panel B: Adjusting Chinese Exports to the U.S.
| Exports in USD, bn. | 1993 | 1994 | 1995 | 1996 | 1997 | 1998 | 1999 | 2000 | 2001 | 2002 | 2003 |
|---|---|---|---|---|---|---|---|---|---|---|---|
| 6) China reported exports to U.S., f.o.b. | 17.0 | 21.4 | 24.7 | 26.7 | 32.7 | 38.0 | 42.0 | 52.1 | 54.3 | 70.0 | 92.5 |
| 7) Reported re-exports from China to U.S. | 21.8 | 25.3 | 27.6 | 29.2 | 31.3 | 30.9 | 32.0 | 36.5 | 33.3 | 34.3 | 33.5 |
| 8) Re-exports f.o.b., less markups | 15.9 | 18.8 | 20.6 | 21.5 | 23.0 | 22.7 | 23.0 | 25.9 | 24.1 | 25.4 | 25.3 |
| 9) Value added to China exports in HK (line 7 - line 8) | 5.8 | 6.5 | 7.0 | 7.7 | 8.2 | 8.2 | 9.1 | 10.6 | 9.2 | 9.0 | 8.2 |
| 10) Adjusted China exports (line 6 + line 8) | 32.9 | 40.2 | 45.3 | 48.2 | 55.8 | 60.7 | 65.0 | 78.0 | 78.4 | 95.3 | 117.8 |
Table 6: Adjusting U.S. and Chinese Bilateral Imports - Panel A: Adjusting U.S. Imports from China
| Imports in USD, bn. | 1993 | 1994 | 1995 | 1996 | 1997 | 1998 | 1999 | 2000 | 2001 | 2002 | 2003 |
|---|---|---|---|---|---|---|---|---|---|---|---|
| 1) U.S. reported imports from China, f.o.b.1 | 31.5 | 38.8 | 45.5 | 51.5 | 62.6 | 71.2 | 81.8 | 100.0 | 102.3 | 125.2 | 152.4 |
| 2) Reported re-exports from China to U.S. | 21.8 | 25.3 | 27.6 | 29.2 | 31.3 | 30.9 | 32.0 | 36.5 | 33.3 | 34.3 | 33.5 |
| 3) Re-exports f.o.b., less markups | 15.9 | 18.8 | 20.6 | 21.5 | 23.0 | 22.7 | 23.0 | 25.9 | 24.1 | 25.4 | 25.3 |
| 4) Value added to U.S. imports in HK (line 2 - line 3) | 5.8 | 6.5 | 7.0 | 7.7 | 8.2 | 8.2 | 9.1 | 10.6 | 9.2 | 9.0 | 8.2 |
| 5) Indirect U.S. imports (re-exports as seen at import) | 21.8 | 25.3 | 27.6 | 29.2 | 31.3 | 30.9 | 32.0 | 36.5 | 33.3 | 34.3 | 33.5 |
| 6) Direct imports (line 1 - line 5) | 9.8 | 13.5 | 17.9 | 22.3 | 31.3 | 40.3 | 49.7 | 63.5 | 69.0 | 90.8 | 119.0 |
| 7) Direct imports f.o.b. | 9.8 | 13.5 | 17.9 | 22.3 | 31.3 | 40.3 | 49.7 | 63.5 | 69.0 | 90.8 | 119.0 |
| 8) Adjusted U.S. imports (line 7 + line 3) | 25.7 | 32.3 | 38.5 | 43.8 | 54.3 | 62.9 | 72.7 | 89.4 | 93.1 | 116.2 | 144.2 |
Table 6: Adjusting U.S. and Chinese Bilateral Imports - Panel B: Adjusting Chinese Imports from the U.S.
| Imports in USD, bn. | 1993 | 1994 | 1995 | 1996 | 1997 | 1998 | 1999 | 2000 | 2001 | 2002 | 2003 |
|---|---|---|---|---|---|---|---|---|---|---|---|
| 9) China reported imports from U.S., c.i.f. | 10.6 | 14.0 | 16.1 | 16.2 | 16.3 | 17.0 | 19.5 | 22.4 | 26.2 | 27.2 | 33.9 |
| 10) Reported re-exports from U.S. to China | 3.2 | 3.7 | 5.0 | 5.9 | 6.0 | 5.3 | 5.4 | 6.1 | 6.5 | 6.2 | 6.2 |
| 11) Re-exports f.o.b., less markups | 2.8 | 3.4 | 4.5 | 5.3 | 5.4 | 4.7 | 4.8 | 5.4 | 5.7 | 5.5 | 5.6 |
| 12) Value added to Chinese imports through HK (line 2 - line 3) | 0.4 | 0.4 | 0.5 | 0.6 | 0.6 | 0.6 | 0.6 | 0.7 | 0.8 | 0.7 | 0.7 |
| 13) Indirect China imports (re-exports as seen at import) | 3.2 | 3.7 | 5.0 | 5.9 | 6.0 | 5.3 | 5.4 | 6.2 | 6.5 | 6.3 | 6.3 |
| 14) Direct imports (line 1 - line 5) | 7.4 | 10.2 | 11.1 | 10.3 | 10.3 | 11.7 | 14.1 | 16.2 | 19.7 | 21.0 | 27.6 |
| 15) Direct imports f.o.b. | 7.1 | 9.7 | 10.5 | 9.7 | 9.8 | 11.0 | 13.1 | 15.1 | 18.4 | 19.7 | 25.8 |
| 16) Adjusted Chinese imports (line 7 + line 3) | 9.9 | 13.1 | 15.1 | 15.0 | 15.1 | 15.8 | 17.9 | 20.4 | 24.1 | 25.2 | 31.3 |
1 U.S. imports are reported on a census basis, which is equivalent to an f.o.b. basis.
Table 7: Adjustments to Hong Kong - China Bilateral Trade Data for 2003 in USD, bn.
| Country | Subtract from Chinese Data: Exports | Subtract from Chinese Data: Imports | Subtract from Hong Kong Data: Exports | Subtract from Hong Kong Data: Imports |
|---|---|---|---|---|
| US | 25.2 | 0 | 6.2 | 25.4 |
| Canada | 1.9 | 0 | 0.4 | 1.9 |
| Brazil | 0.4 | 0 | 0.4 | 0.4 |
| Mexico | 0.5 | 0 | 0.2 | 0.5 |
| Japan | 7.9 | 0 | 17.0 | 8.0 |
| Korea | 1.7 | 0 | 6.0 | 1.7 |
| Taiwan | 1.6 | 0 | 11.8 | 1.6 |
| Malaysia | 1.1 | 0 | 3.2 | 1.1 |
| Singapore | 2.3 | 0 | 2.3 | 2.3 |
| Thailand | 1.2 | 0 | 2.1 | 1.2 |
| Indonesia | 0.6 | 0 | 0.8 | 0.6 |
| Philippines | 1.1 | 0 | 1.9 | 1.1 |
| India | 0.6 | 0 | 0.5 | 0.6 |
| Saudi Arabia | 0.2 | 0 | 0.1 | 0.2 |
| Iran | 0.0 | 0 | 0.0 | 0.0 |
| Vietnam | 0.5 | 0 | 0.1 | 0.5 |
| Germany | 4.6 | 0 | 2.9 | 4.6 |
| Russia | 0.2 | 0 | 0.2 | 0.2 |
| Netherlands | 2.3 | 0 | 0.3 | 2.3 |
| UK | 4.5 | 0 | 0.9 | 4.5 |
| France | 1.9 | 0 | 0.5 | 1.9 |
| Italy | 1.6 | 0 | 1.3 | 1.6 |
| Belgium Luxembourg | 0.7 | 0 | 0.3 | 0.7 |
| Spain | 1.1 | 0 | 0.1 | 1.1 |
| Sweden | 0.4 | 0 | 0.3 | 0.4 |
| Australia | 1.6 | 0 | 0.5 | 1.6 |
| Ch →HK →Ch | 0.0 | 0 | 26.4 | 24.0 |
| Others | 5.9 | 0 | 3.3 | 5.9 |
| Total1 | 71.6 | 0 | 90.2 | 96.2 |
1 Totals include adjustments from trading partners not included in this table.
Table 8: Reported Chinese World Trade Balance - 20031
| Country | Chinese Data: Exports | Chinese Data: Imports | Chinese Data: Balance | Trade Partner Data: Exports | Trade Partner Data: Imports | Trade Partner Data: Balance | Discrepancy2 |
|---|---|---|---|---|---|---|---|
| United States | 92.5 | 33.9 | 58.6 | 28.3 | 152.4 | -124.1 | 65.5 |
| Canada | 5.6 | 4.4 | 1.3 | 3.4 | 13.3 | -9.9 | 8.6 |
| Brazil | 2.1 | 5.8 | -3.7 | 4.5 | 2.3 | 2.2 | 1.5 |
| Mexico | 3.3 | 1.7 | 1.6 | 0.5 | 9.4 | -8.9 | 7.3 |
| Japan | 59.4 | 74.1 | -14.7 | 57.4 | 75.4 | -18.1 | 32.8 |
| Korea | 20.1 | 43.1 | -23.0 | 35.1 | 21.9 | 13.2 | 9.9 |
| Taiwan | 9.0 | 49.4 | -40.4 | 21.4 | 11.0 | 10.5 | 29.9 |
| Malaysia | 6.1 | 14.0 | -7.8 | 6.8 | 7.3 | -0.5 | 8.3 |
| Singapore | 8.9 | 10.5 | -1.6 | 10.1 | 11.1 | -1.0 | 2.6 |
| Thailand | 3.8 | 8.8 | -5.0 | 5.7 | 6.0 | -0.4 | 5.4 |
| Indonesia | 4.5 | 5.7 | -1.3 | 2.1 | 1.9 | 0.2 | 3.0 |
| Philippines | 3.1 | 4.3 | -0.9 | 2.9 | 4.0 | -1.1 | 2.0 |
| India | 3.3 | 4.3 | -0.9 | 2.9 | 4.0 | -1.1 | 2.0 |
| Saudi Arabia | 2.1 | 5.2 | -3.0 | 4.1 | 2.2 | 1.9 | 1.1 |
| Iran | 2.3 | 3.3 | -1.0 | 0.2 | 1.4 | -1.2 | 2.2 |
| Vietnam | 3.2 | 1.5 | 1.7 | 1.7 | 3.1 | -1.4 | 0.4 |
| Germany | 17.4 | 24.3 | -6.8 | 20.4 | 28.3 | -7.9 | 14.7 |
| Russia | 6.0 | 9.7 | -3.7 | 7.8 | 3.3 | 4.5 | 0.8 |
| Netherlands | 13.5 | 1.9 | 11.6 | 1.7 | 11.8 | -10.1 | 1.5 |
| UK | 10.8 | 3.6 | 7.3 | 3.1 | 14.0 | -10.9 | 3.6 |
| France | 7.3 | 6.1 | 1.2 | 5.2 | 15.0 | -9.9 | 8.6 |
| Italy | 6.7 | 5.1 | 1.6 | 4.3 | 10.8 | -6.5 | 4.9 |
| Belgium Luxembourg | 4.2 | 2.9 | 1.4 | 2.6 | 6.2 | -3.6 | 2.2 |
| Spain | 3.9 | 1.4 | 2.6 | 1.3 | 7.5 | -6.3 | 3.7 |
| Sweden | 1.5 | 2.7 | -1.3 | 2.2 | 1.9 | 0.3 | 1.0 |
| Australia | 6.3 | 7.3 | -1.0 | 5.0 | 9.2 | -4.2 | 5.2 |
| Hong Kong | 76.3 | 11.1 | 65.2 | 95.4 | 101.3 | -5.9 | 59.3 |
| Total Included3 | 419.6 | 377.6 | 42.0 | 358.4 | 577.3 | -218.8 | 312.2 |
| Total Excluded | 18.6 | 35.2 | -16.5 | NA | NA | NA | NA |
| Total | 438.2 | 412.8 | 25.5 | 358.4 | 577.3 | -218.8 | 312.2 |
1 Data for other years available from the authors upon request.
2 The discrepancy is the difference between the balance reported by China and its trading partners and is always non-negative. The total discrepancy is the sum of the values. Alternatively, one could total the bilateral balances on China's side and total the bilateral balances on the trading partners' side separately, to create, in effect, a world balance for each side. Because in this second method the totals are comprised of both negative and positive bilateral trade balances which are off-setting in aggregate, the difference between these world balances can be much smaller.
3 Totals include data from trading partners not included in this table.
Table 9: Adjusted Chinese World Trade Balance - 20031
| Country | Chinese Data: Adjusted Exports | Chinese Data: Adjusted Imports | Chinese Data: Balance | Trade Partner Data: Adjusted Exports | Trade Partner Data: Adjusted Imports | Trade Partner Data: Balance | Discrepancy2 |
|---|---|---|---|---|---|---|---|
| United States | 117.7 | 31.3 | 86.4 | 33.8 | 144.2 | -110.4 | 24.0 |
| Canada | 7.5 | 4.2 | 3.3 | 3.8 | 12.3 | -8.6 | 5.3 |
| Brazil | 2.6 | 5.7 | -3.1 | 4.9 | 2.1 | 2.7 | 0.4 |
| Mexico | 3.8 | 1.6 | 2.2 | 0.7 | 9.0 | -8.3 | 6.2 |
| Japan | 67.3 | 71.7 | -4.3 | 72.6 | 72.0 | 0.6 | 3.7 |
| Korea | 21.8 | 42.0 | -20.2 | 40.4 | 21.1 | 19.3 | 0.9 |
| Taiwan | 10.6 | 47.8 | -37.2 | 32.1 | 10.3 | 21.7 | 15.4 |
| Malaysia | 7.2 | 13.5 | -6.3 | 9.7 | 6.8 | 2.8 | 3.4 |
| Singapore | 11.1 | 10.1 | 1.0 | 12.1 | 10.2 | 2.0 | 3.0 |
| Thailand | 5.1 | 8.5 | -3.5 | 7.6 | 5.6 | 2.0 | 1.4 |
| Indonesia | 5.1 | 5.6 | -0.5 | 4.5 | 2.7 | 1.8 | 1.3 |
| Philippines | 4.2 | 6.0 | -1.8 | 3.9 | 1.5 | 2.3 | 0.5 |
| India | 4.0 | 4.1 | -0.1 | 3.4 | 3.7 | -0.3 | 0.4 |
| Saudi Arabia | 2.3 | 5.0 | -2.7 | 4.2 | 2.1 | 2.1 | 0.6 |
| Iran | 2.3 | 3.2 | -0.9 | 0.3 | 1.4 | -1.1 | 2.0 |
| Vietnam | 3.7 | 1.4 | 2.3 | 1.8 | 2.9 | -1.1 | 1.2 |
| Germany | 22.1 | 23.5 | -1.5 | 23.0 | 26.2 | -3.2 | 4.7 |
| Russia | 6.2 | 9.5 | -3.3 | 8.0 | 3.2 | 4.8 | 1.5 |
| Netherlands | 15.8 | 1.9 | 13.9 | 1.9 | 10.8 | -8.9 | 5.0 |
| UK | 15.3 | 3.4 | 11.9 | 3.9 | 12.3 | -8.3 | 3.5 |
| France | 9.2 | 5.9 | 3.3 | 5.7 | 14.1 | -8.5 | 5.2 |
| Italy | 8.3 | 4.9 | 3.4 | 5.4 | 10.0 | -4.6 | 1.2 |
| Belgium Luxembourg | 5.0 | 2.8 | 2.2 | 2.9 | 5.8 | -2.9 | 0.8 |
| Spain | 5.0 | 1.3 | 3.7 | 1.4 | 7.0 | -5.6 | 1.9 |
| Sweden | 1.9 | 2.6 | -0.8 | 2.4 | 1.7 | 0.7 | 0.1 |
| Australia | 7.8 | 7.1 | 0.8 | 5.5 | 8.4 | -3.0 | 2.2 |
| Hong Kong | 2.5 | 11.1 | -8.6 | 5.1 | 4.3 | 0.8 | 7.8 |
| Total Included3 | 417.3 | 364.4 | 52.9 | 325.5 | 451.6 | -126.1 | 124.6 |
| Total Excluded | 20.9 | 34.2 | -13.3 | NA | NA | NA | NA |
| Total | 438.2 | 398.7 | 39.6 | 325.5 | 451.6 | -126.1 | 124.6 |
1 Data for other years available from the authors upon request.
2 As defined in Table 8.
3 Totals include data from trading partners not included in this table.
Table 10: Trade Types
| Type | Trade Partner: Imports | Trade Partner: Exports | China: Imports | China: Exports |
|---|---|---|---|---|
| 0 | X | - | - | - |
| 1 | X | - | X | - |
| 2 | X | - | X | X |
| 3 | X | X | X | - |
| 4 | X | X | X | X |
| 5 | X | - | - | X |
| 6 | X | X | - | - |
| 7 | X | X | - | X |
| 8 | - | - | - | - |
| 9 | - | - | X | - |
| 10 | - | - | X | X |
| 11 | - | X | X | - |
| 12 | - | X | X | X |
| 13 | - | - | - | X |
| 14 | - | X | - | - |
| 15 | - | X | - | X |
X indicates that the country correctly determines either the origin of imports or the final destination of exports.
Table 11: Adjusted Trade Balance Discrepancies, by type - 2003 (USD bn) - Panel A
| Country | Minimizing Type | Type: 0 | Type: 1 | Type: 2 | Type: 3 | Type: 4 | Type: 5 | Type: 6 | Type: 7 |
|---|---|---|---|---|---|---|---|---|---|
| United States | 1 | 29.8 | 23.9 | 49.2 | 29.5 | 54.7 | 55.1 | 35.4 | 60.6 |
| Canada | 1 | 5.7 | 5.3 | 7.2 | 5.6 | 7.6 | 7.6 | 6.1 | 8.0 |
| Brazil | 1 | 0.8 | 0.4 | 0.8 | 0.7 | 1.2 | 1.2 | 1.1 | 1.6 |
| Mexico | 1 | 6.9 | 6.2 | 6.4 | 6.8 | 7.0 | 7.0 | 7.5 | 7.7 |
| Japan | 1 | 20.6 | 3.7 | 11.6 | 19.0 | 26.9 | 28.6 | 35.9 | 43.8 |
| Korea | 1 | 6.8 | 0.9 | 2.6 | 6.2 | 7.9 | 8.5 | 12.2 | 13.8 |
| Taiwan | 1 | 27.3 | 15.4 | 17.1 | 26.1 | 27.7 | 28.9 | 37.9 | 39.6 |
| Malaysia | 1 | 6.6 | 3.4 | 4.5 | 6.3 | 7.4 | 7.7 | 9.5 | 10.6 |
| Singapore | 9 | -0.7 | -3.0 | -0.7 | -0.9 | 1.3 | 1.6 | 1.3 | 3.6 |
| Thailand | 1 | 3.5 | 1.4 | 2.7 | 3.3 | 4.6 | 4.8 | 5.4 | 6.7 |
| Indonesia | 4 | -0.5 | -1.3 | -0.7 | -0.5 | 0.0 | 0.1 | 0.3 | 0.9 |
| Philippines | 1 | 1.4 | -0.5 | 0.6 | 1.2 | 2.3 | 2.5 | 3.2 | 4.2 |
| India | 1 | 1.1 | 0.6 | 1.2 | 1.0 | 1.7 | 1.7 | 1.6 | 2.2 |
| Saudi Arabia | 1 | 0.7 | 0.6 | 0.7 | 0.7 | 0.9 | 0.9 | 0.8 | 1.0 |
| Iran | 1 | 2.0 | 2.0 | 2.0 | 2.0 | 2.1 | 2.1 | 2.1 | 2.1 |
| Vietnam | 10 | -1.1 | -1.2 | -0.7 | -1.1 | -0.6 | -0.6 | -1.0 | -0.5 |
| Germany | 1 | 7.6 | 4.7 | 9.3 | 7.3 | 11.9 | 12.2 | 10.2 | 14.8 |
| Russia | 15 | -1.2 | -1.4 | -1.2 | -1.2 | -1.1 | -1.0 | -1.1 | -0.9 |
| Netherlands | 10 | -4.7 | -5.0 | -2.7 | -4.8 | -2.5 | -2.5 | -4.5 | -2.2 |
| UK | 2 | -2.6 | -3.5 | 0.9 | -2.7 | 1.7 | 1.8 | -1.9 | 2.6 |
| France | 1 | 5.7 | 5.2 | 7.1 | 5.7 | 7.5 | 7.6 | 6.2 | 8.1 |
| Italy | 1 | 2.4 | 1.2 | 2.8 | 2.3 | 4.0 | 4.1 | 3.6 | 5.2 |
| Belgium Luxembourg | 1 | 1.1 | 0.7 | 1.5 | 1.0 | 1.8 | 1.8 | 1.3 | 2.1 |
| Spain | 1 | 2.1 | 1.9 | 3.0 | 2.1 | 3.1 | 3.2 | 2.2 | 3.3 |
| Sweden | 1 | 0.3 | 0.1 | 0.5 | 0.3 | 0.7 | 0.8 | 0.6 | 1.0 |
| Australia | 1 | 2.7 | 2.2 | 3.8 | 2.7 | 4.3 | 4.3 | 3.2 | 4.8 |
Table 11: Adjusted Trade Balance Discrepancies, by type - 2003 (USD bn) - Panel B
| Country | Minimizing Type | Type: 8 | Type: 9 | Type: 10 | Type: 11 | Type: 12 | Type: 13 | Type: 14 | Type: 15 |
|---|---|---|---|---|---|---|---|---|---|
| United States | 1 | 63.3 | 57.4 | 82.6 | 62.9 | 88.2 | 88.5 | 68.8 | 94.1 |
| Canada | 1 | 8.2 | 7.8 | 9.7 | 8.2 | 10.1 | 10.1 | 8.6 | 10.5 |
| Brazil | 1 | 1.3 | 0.9 | 1.3 | 1.3 | 1.7 | 1.7 | 1.7 | 2.1 |
| Mexico | 1 | 7.1 | 6.4 | 6.6 | 7.0 | 7.2 | 7.3 | 7.7 | 7.9 |
| Japan | 1 | 31.1 | 14.2 | 22.1 | 29.5 | 37.4 | 39.0 | 46.4 | 54.3 |
| Korea | 1 | 9.0 | 3.1 | 4.8 | 8.5 | 10.1 | 10.7 | 14.4 | 16.0 |
| Taiwan | 1 | 29.4 | 17.6 | 19.2 | 28.3 | 29.9 | 31.1 | 40.1 | 41.7 |
| Malaysia | 1 | 8.0 | 4.8 | 5.9 | 7.7 | 8.8 | 9.1 | 10.9 | 12.0 |
| Singapore | 9 | 2.3 | 0.0 | 2.3 | 2.1 | 4.4 | 4.6 | 4.3 | 6.6 |
| Thailand | 1 | 5.2 | 3.1 | 4.3 | 5.0 | 6.2 | 6.4 | 7.1 | 8.3 |
| Indonesia | 4 | 0.3 | -0.5 | 0.0 | 0.2 | 0.8 | 0.9 | 1.0 | 1.6 |
| Philippines | 1 | 2.9 | 1.0 | 2.1 | 2.7 | 3.8 | 4.0 | 4.6 | 5.7 |
| India | 1 | 1.9 | 1.4 | 2.0 | 1.9 | 2.5 | 2.6 | 2.4 | 3.0 |
| Saudi Arabia | 1 | 0.9 | 0.8 | 1.0 | 0.9 | 1.1 | 1.1 | 1.1 | 1.2 |
| Iran | 1 | 2.1 | 2.0 | 2.1 | 2.1 | 2.1 | 2.1 | 2.1 | 2.1 |
| Vietnam | 10 | -0.4 | -0.5 | 0.0 | -0.4 | 0.1 | 0.1 | -0.3 | 0.2 |
| Germany | 1 | 13.7 | 10.8 | 15.4 | 13.4 | 18.0 | 18.3 | 16.3 | 20.9 |
| Russia | 15 | -1.0 | -1.1 | -1.0 | -1.0 | -0.8 | -0.8 | -0.8 | -0.7 |
| Netherlands | 10 | -1.7 | -2.0 | 0.3 | -1.7 | 0.5 | 0.6 | -1.5 | 0.8 |
| UK | 2 | 3.3 | 2.4 | 6.9 | 3.2 | 7.6 | 7.7 | 4.1 | 8.5 |
| France | 1 | 8.2 | 7.7 | 9.6 | 8.2 | 10.0 | 10.1 | 8.7 | 10.6 |
| Italy | 1 | 4.6 | 3.3 | 5.0 | 4.5 | 6.1 | 6.2 | 5.7 | 7.4 |
| Belgium Luxembourg | 1 | 2.0 | 1.7 | 2.5 | 2.0 | 2.7 | 2.8 | 2.3 | 3.0 |
| Spain | 1 | 3.5 | 3.4 | 4.4 | 3.5 | 4.6 | 4.6 | 3.6 | 4.7 |
| Sweden | 1 | 0.9 | 0.6 | 1.0 | 0.9 | 1.3 | 1.3 | 1.1 | 1.6 |
| Australia | 1 | 4.8 | 4.3 | 5.9 | 4.8 | 6.3 | 6.4 | 5.3 | 6.9 |
Smallest values in bold.
Table 12: Adjusted Trade Differentials, by type - 2003 (USD bn) - Panel A
| Country | Minimizing Type | Type: 0 | Type: 1 | Type: 2 | Type: 3 | Type: 4 | Type: 5 | Type: 6 | Type: 7 |
|---|---|---|---|---|---|---|---|---|---|
| United States | 1 | 29.8 | 29.0 | 54.3 | 29.5 | 54.7 | 55.1 | 35.4 | 60.6 |
| Canada | 1 | 5.7 | 5.3 | 7.2 | 5.6 | 7.6 | 7.6 | 6.1 | 8.0 |
| Brazil | 2 | 1.6 | 1.2 | 0.8 | 1.5 | 1.2 | 1.2 | 1.9 | 1.6 |
| Mexico | 1 | 6.9 | 6.2 | 6.4 | 6.8 | 7.0 | 7.0 | 7.5 | 7.7 |
| Japan | 1 | 20.6 | 5.7 | 13.6 | 19.0 | 26.9 | 28.6 | 35.9 | 43.8 |
| Korea | 1 | 8.2 | 2.3 | 2.6 | 7.6 | 7.9 | 8.5 | 13.6 | 13.8 |
| Taiwan | 1 | 27.9 | 16.1 | 17.1 | 26.7 | 27.7 | 28.9 | 38.5 | 39.6 |
| Malaysia | 1 | 7.4 | 4.2 | 4.5 | 7.1 | 7.4 | 7.7 | 10.2 | 10.6 |
| Singapore | 3 | 1.2 | 3.0 | 3.3 | 1.0 | 1.3 | 1.6 | 3.2 | 3.6 |
| Thailand | 1 | 3.5 | 1.4 | 2.7 | 3.3 | 4.6 | 4.8 | 5.4 | 6.7 |
| Indonesia | 10 | 4.2 | 3.4 | 2.8 | 4.1 | 3.5 | 3.6 | 4.9 | 4.4 |
| Philippines | 10 | 6.7 | 4.8 | 3.7 | 6.5 | 5.4 | 5.6 | 8.4 | 7.3 |
| India | 1 | 1.5 | 1.0 | 1.2 | 1.4 | 1.7 | 1.7 | 2.0 | 2.2 |
| Saudi Arabia | 9 | 1.2 | 1.1 | 0.9 | 1.2 | 1.0 | 1.0 | 1.3 | 1.1 |
| Iran | 10 | 4.0 | 3.9 | 3.9 | 4.0 | 3.9 | 4.0 | 4.0 | 4.0 |
| Vietnam | 14 | 1.1 | 1.2 | 0.7 | 1.1 | 0.6 | 0.6 | 1.0 | 0.5 |
| Germany | 1 | 7.6 | 4.7 | 9.3 | 7.3 | 11.9 | 12.2 | 10.2 | 14.8 |
| Russia | 10 | 4.8 | 4.6 | 4.5 | 4.8 | 4.6 | 4.6 | 4.9 | 4.8 |
| Netherlands | 10 | 5.2 | 5.0 | 2.7 | 5.2 | 2.9 | 2.9 | 5.4 | 3.2 |
| UK | 4 | 3.4 | 3.5 | 1.9 | 3.3 | 1.7 | 1.8 | 4.2 | 2.6 |
| France | 1 | 5.7 | 5.2 | 7.1 | 5.7 | 7.5 | 7.6 | 6.2 | 8.1 |
| Italy | 3 | 2.4 | 2.3 | 4.0 | 2.3 | 4.0 | 4.1 | 3.6 | 5.2 |
| Belgium Luxembourg | 1 | 1.1 | 1.0 | 1.7 | 1.0 | 1.8 | 1.8 | 1.3 | 2.1 |
| Spain | 3 | 2.1 | 2.1 | 3.2 | 2.1 | 3.1 | 3.2 | 2.2 | 3.3 |
| Sweden | 1 | 0.6 | 0.4 | 0.5 | 0.6 | 0.7 | 0.8 | 0.9 | 1.0 |
| Australia | 1 | 2.7 | 2.2 | 3.8 | 2.7 | 4.3 | 4.3 | 3.2 | 4.8 |
Table 12: Adjusted Trade Differentials, by type - 2003 (USD bn) - Panel B
| Country | Minimizing Type | Type: 8 | Type: 9 | Type: 10 | Type: 11 | Type: 12 | Type: 13 | Type: 14 | Type: 15 |
|---|---|---|---|---|---|---|---|---|---|
| United States | 1 | 63.3 | 62.5 | 87.7 | 62.9 | 88.2 | 88.5 | 68.8 | 94.1 |
| Canada | 1 | 8.2 | 7.8 | 9.7 | 8.2 | 10.1 | 10.1 | 8.6 | 10.5 |
| Brazil | 2 | 1.3 | 0.9 | 1.3 | 1.3 | 1.7 | 1.7 | 1.7 | 2.1 |
| Mexico | 1 | 7.1 | 6.4 | 6.6 | 7.0 | 7.2 | 7.3 | 7.7 | 7.9 |
| Japan | 1 | 31.1 | 16.2 | 24.1 | 29.5 | 37.4 | 39.0 | 46.4 | 54.3 |
| Korea | 1 | 9.0 | 3.1 | 4.8 | 8.5 | 10.1 | 10.7 | 14.4 | 16.0 |
| Taiwan | 1 | 29.4 | 17.6 | 19.2 | 28.3 | 29.9 | 31.1 | 40.1 | 41.7 |
| Malaysia | 1 | 8.0 | 4.8 | 5.9 | 7.7 | 8.8 | 9.1 | 10.9 | 12.0 |
| Singapore | 3 | 2.3 | 4.1 | 6.4 | 2.1 | 4.4 | 4.6 | 4.3 | 6.6 |
| Thailand | 1 | 5.2 | 3.1 | 4.3 | 5.0 | 6.2 | 6.4 | 7.1 | 8.3 |
| Indonesia | 10 | 3.4 | 2.6 | 2.0 | 3.3 | 2.8 | 2.9 | 4.2 | 3.6 |
| Philippines | 10 | 5.3 | 3.4 | 2.3 | 5.1 | 4.0 | 4.2 | 7.0 | 5.9 |
| India | 1 | 1.9 | 1.4 | 2.0 | 1.9 | 2.5 | 2.6 | 2.4 | 3.0 |
| Saudi Arabia | 9 | 1.0 | 0.8 | 1.0 | 1.0 | 1.1 | 1.1 | 1.1 | 1.2 |
| Iran | 10 | 3.9 | 3.9 | 3.9 | 3.9 | 3.9 | 3.9 | 4.0 | 4.0 |
| Vietnam | 14 | 0.4 | 0.5 | 0.8 | 0.4 | 0.7 | 0.7 | 0.3 | 0.6 |
| Germany | 1 | 13.7 | 10.8 | 15.4 | 13.4 | 18.0 | 18.3 | 16.3 | 20.9 |
| Russia | 10 | 4.6 | 4.4 | 4.2 | 4.5 | 4.4 | 4.4 | 4.7 | 4.5 |
| Netherlands | 10 | 2.2 | 2.0 | 0.3 | 2.2 | 0.5 | 0.6 | 2.4 | 0.8 |
| UK | 4 | 3.3 | 3.4 | 7.9 | 3.2 | 7.6 | 7.7 | 4.1 | 8.5 |
| France | 1 | 8.2 | 7.7 | 9.6 | 8.2 | 10.0 | 10.1 | 8.7 | 10.6 |
| Italy | 3 | 4.6 | 4.5 | 6.1 | 4.5 | 6.1 | 6.2 | 5.7 | 7.4 |
| Belgium Luxembourg | 1 | 2.0 | 2.0 | 2.7 | 2.0 | 2.7 | 2.8 | 2.3 | 3.0 |
| Spain | 3 | 3.5 | 3.5 | 4.6 | 3.5 | 4.6 | 4.6 | 3.6 | 4.7 |
| Sweden | 1 | 0.9 | 0.6 | 1.0 | 0.9 | 1.3 | 1.3 | 1.1 | 1.6 |
| Australia | 1 | 4.8 | 4.3 | 5.9 | 4.8 | 6.3 | 6.4 | 5.3 | 6.9 |
Smallest values in bold.
Table 13: Selected Adjusted Trade Balance, by Percent of Re-exports Attributed to Final Destination - 20031 - Panel A: Reported Trade Balance in USD bn
| Country | Total Discrepancy | Total Discrepancy2 |
|---|---|---|
| World | 312.18 | - |
| Hong Kong | 59.28 | - |
Table 13: Selected Adjusted Trade Balance, by Percent of Re-exports Attributed to Final Destination - 20031 - Panel B: Adjusted Trade Balances in USD bn
| Country | Total Discrepany | Total Discrepany2 | Re-exports Correctly Attributed as Exports to Final Destination %: China | Re-exports Correctly Attributed as Exports to Final Destination %: Trade Partners |
|---|---|---|---|---|
| World | 146.133 | 122.31 | 0 | 0 (Type 1) |
| Hong Kong | 29.323 | 5.49 | 0 | 0 (Type 1) |
| World | 145.263 | 127.16 | 10 | 10 |
| Hong Kong | 19.773 | 1.67 | 10 | 10 |
| World | 144.583 | 143.18 | 20 | 20 |
| Hong Kong | 10.233 | 8.83 | 20 | 20 |
| World | 144.37 | 159.67 | 30 | 30 |
| Hong Kong | 0.69 | 15.99 | 30 | 30 |
| World | 161.94 | 176.24 | 40 | 40 |
| Hong Kong | 8.85 | 23.15 | 40 | 40 |
| World | 180.89 | 192.80 | 50 | 50 |
| Hong Kong | 18.40 | 30.31 | 50 | 50 |
| World | 199.84 | 209.37 | 60 | 60 |
| Hong Kong | 27.94 | 37.47 | 60 | 60 |
| World | 219.30 | 226.45 | 70 | 70 |
| Hong Kong | 37.48 | 44.63 | 70 | 70 |
| World | 240.30 | 245.06 | 80 | 80 |
| Hong Kong | 47.02 | 51.79 | 80 | 80 |
| World | 261.30 | 263.68 | 90 | 90 |
| Hong Kong | 56.57 | 58.95 | 90 | 90 |
| World | 282.34 | 282.34 | 100 | 100 (Type 4) |
| Hong Kong | 66.11 | 66.11 | 100 | 100 (Type 4) |
| World | 150.433 | 126.60 | 0 | 10 |
| Hong Kong | 29.323 | 5.49 | 0 | 10 |
| World | 154.733 | 130.90 | 0 | 20 |
| Hong Kong | 29.323 | 5.49 | 0 | 20 |
| World | 187.353 | 163.52 | 0 | 90 |
| Hong Kong | 29.323 | 5.49 | 0 | 90 |
| World | 192.083 | 168.25 | 0 | 100 (Type 2) |
| Hong Kong | 29.323 | 5.49 | 0 | 100 (Type 2) |
| World | 140.963 | 122.86 | 10 | 0 |
| Hong Kong | 19.773 | 1.67 | 10 | 0 |
| World | 135.803 | 134.40 | 20 | 0 |
| Hong Kong | 10.233 | 8.83 | 20 | 0 |
| World | 130.64 | 145.94 | 30 | 0 |
| Hong Kong | 0.69 | 15.99 | 30 | 0 |
| World | 143.18 | 157.48 | 40 | 0 |
| Hong Kong | 8.85 | 23.15 | 40 | 0 |
| World | 157.25 | 169.16 | 50 | 0 |
| Hong Kong | 18.40 | 30.31 | 50 | 0 |
| World | 171.46 | 180.99 | 60 | 0 |
| Hong Kong | 27.94 | 37.47 | 60 | 0 |
| World | 185.68 | 192.83 | 70 | 0 |
| Hong Kong | 37.48 | 44.63 | 70 | 0 |
| World | 200.00 | 204.76 | 80 | 0 |
| Hong Kong | 47.02 | 51.79 | 80 | 0 |
| World | 215.11 | 217.50 | 90 | 0 |
| Hong Kong | 56.57 | 58.95 | 90 | 0 |
| World | 230.23 | 230.23 | 100 | 0 (Type 3) |
| Hong Kong | 66.11 | 66.11 | 100 | 0 (Type 3) |
1 Percent Re-exports Properly Attributed as Imports from Port of Origin = 100.
2 These estimates used throughout the paper. Assume mainland China is able to correctly attributed 100% of all re-exports to Hong Kong and back to itself, as trade with itself.
3 Hong Kong has a negative Exports balance with China.
Footnotes
* Staff economist and Research Assistant of the Division of International Finance of the Federal Reserve Board, respectively. The first author can be reached at [email protected]. We are grateful to Benjamin Cushman, Carolyn Evans, Jane Haltmaier, Dale Henderson, David Hummels, Diane Oberg, Trevor Reeve, Nathan Sheets, and Bert Wolfe for their comments and suggestions. The views in this paper are solely the responsibility of the authors and should not be interpreted as reflecting the views of the Board of Governors of the Federal Reserve System or of any other person associated with the Federal Reserve System. Return to text
1. FCA (2004) draws the implication that China is "hiding the ball", or intentionally understating its trade, perhaps in order to give the impression that the Chinese exchange rate is less undervalued than some believe. Return to text
2. We define "actual" trade as trade which is free of markups or adjustments in value, and which includes all trade, direct and indirect, between China and its trading partners. The value of actual trade is equal to the value of the goods at their port of origin. Return to text
3. Re-exports are defined by the Census and Statistics Department of the Government of Hong Kong as: "...products which have previously been imported into Hong Kong and which are re-exported without having undergone in Hong Kong a manufacturing process which has changed permanently the shape, nature, form or utility of the product." The key is that the goods are not fundamentally changed. In theory there is no limit to the amount of value that could be added. Return to text
4. In practice, even after adjustment, there will likely remain small discrepancies for most bilateral data. The sources of these discrepancies are manifold and include different territorial definitions, different definitions of what constitutes trade (e.g., shipping containers), and reporting errors. Correcting for these discrepancies is not the aim of this paper. For a good discussion of these discrepancies, visit the International Trade Centre's website www.intracen.org. Return to text
5. In a few cases, we have supplemented these data with data from CEIC (for data on Taiwan) and the IMF's Direction of Trade Statistics (DOTS), when those sources were more complete. A word of caution is in order when using data from DOTS for this type of work. If a country does not report bilateral data to DOTS, the IMF estimates the data using the trading partner data. DOTS estimates are made by multiplying the reporting country's export data by 1.1 to get the trading partner's import data and dividing the reporting country's import data by 1.1 to get the trading partner's export data. We use data from DOTS for Kazakhstan, Macau, Mongolia, Ukraine, Malta, Lithuania, and Sudan. The data for these countries is reported by the countries and not estimated from partner country data. Return to text
6. Data for other years are available from the authors upon request. Return to text
7. U.S. exports are reported on a 'free along side' basis, which means the value of the goods when they are along side the ship, i.e., before they are loaded. The difference between exports on an f.o.b. basis and f.a.s. basis is the cost of loading goods onto the ship. We assume that cost is zero. Fung and Lau (1996, 1998, 2001, 2003) assumed the cost was equal to 1 percent of the value of the exports. Given that the values we have found for c.i.f. adjustments tend to be on the order of one to two percentage points, we felt safe in assuming that the cost of loading the goods was effectively zero. Return to text
8. There could be problems with this if countries import and export very different types of goods. For example, the cost of insuring a shipment of toys may be different than the cost of insuring agricultural goods or high-tech equipment. Regardless, this adjustment tends to be very small and of second order compared to adjusting for reexports. Return to text
9. While it would be ideal to have these data on a country-by-country basis, these data are not available. Making use of the average should be a reasonable alternative. Return to text
10. We also adjust Chinese data for the rest of the world (about 140 countries), despite not having official trading partner data for those countries. Thus we have a complete picture of adjusted Chinese bilateral trade using Chinese data, but not using official trading partner data. Return to text
11. In addition, Fung and Lau applied the ten percent adjustment to U.S. import data that were already on an f.o.b. basis, thus discounting the data too much. They also treat the value-added markup in Hong Kong as a percent of the value of the imported good, when in fact the Hong Kong authorities report it as a percent of the value of the reexported good. We correct for both of these errors, both of which can lead to adjustments of several billion dollars in the case of the United States. Return to text
12. We are similar to Fung and Lau in our assumption that countries do not know the final destination of their exports that are re-exported through Hong Kong, despite the fact that most countries claim to attempt to determine the final destination of all exports. We discuss this further in section 5. Return to text
13. Note that the c.i.f. charges for import into Hong Kong from the original country and the c.i.f. charges for import into the final destination from Hong Kong are usually different. Return to text
14. FCA (2004) does not adjust the Chinese trade balance with Hong Kong. Adjusting that balance is crucial, however, because the majority of the adjustments to the Chinese bilateral balances are offset by adjustments to the China-Hong Kong balance, leaving the overall Chinese balance little changed. Return to text
15. An exception to this is for the small subsection of Chinese trade that consists of re-exports from China that travel through Hong Kong and then back to China. We have assumed that China has been able to correctly attribute this indirect trade and hence we do not need to adjust the bilateral balance for any reattribution of this type of trade. Return to text
16. This adjustment will be slightly greater because the cost of insurance and freight must also be removed. Return to text
17. While Hong Kong does a reasonably good job of reporting both its total imports and exports with China, and those imports and exports which are domestically consumed or produced. Adjusting Hong Kong's data this way is more appropriate because we are not adjusting the data for all of China's trading partners. Adjusting the data this way makes sure the adjustments are symmetrical. Return to text
18. See United Nations (1998). Return to text
19. For the purpose of this exercise, we assume that a country must either properly attribute all of its indirect imports (exports) or none at all. We relax this assumption for exports in section 5.2. Return to text
20. We define a trade differential as the difference between one country's imports from a trading partner and the trading partner's exports to that country, and we define the total trade differential as the sum of both trade differentials in a bilateral trade relationship. Return to text
21. Indeed, if you make the additional assumptions that 1) there exist no reporting errors, 2) there are no differences in reporting practices and 3) a country either gets indirect exports (indirect imports) either all right or all wrong, and with exact values of c.i.f. - f.o.b. adjustments and Hong Kong markups, the minimizing type would reduce the discrepancies to 0 and necessarily represent the appropriate set of assumptions. Return to text
22. In fact, if we make this assumption, as we have done so far, adjusted Chinese exports to Hong Kong are negative in some years. This suggests that China sometimes knows and correctly reports the destination of its exports that are transshipped through Hong Kong. Return to text
This version is optimized for use by screen readers. Descriptions for all mathematical expressions are provided in LaTex format. A printable pdf version is available. Return to text