
Board of Governors of the Federal Reserve System
International Finance Discussion Papers
Number 913, January 2008 --- Screen Reader
Version*
India's Future: It's About Jobs
NOTE: International Finance Discussion Papers are preliminary materials circulated to stimulate discussion and critical comment. References in publications to International Finance Discussion Papers (other than an acknowledgment that the writer has had access to unpublished material) should be cleared with the author or authors. Recent IFDPs are available on the Web at http://www.federalreserve.gov/pubs/ifdp/. This paper can be downloaded without charge from the Social Science Research Network electronic library at http://www.ssrn.com/.
Abstract:
Projections of sustained strong growth in India depend importantly on the utilization of the huge increase in India's working-age population projected over the next two decades. To date, however, India's economic growth has been concentrated in high-skill and capital-intensive sectors, and has not generated strong employment growth. In this paper, we highlight the tension between India's performance in output and employment, describe the characteristics of India's demographic dividend, and discuss impediments to India's shift away from agriculture.
Keywords: India, growth projections, employment
JEL classification: E20, F00
1 Introduction
India's extraordinary recent economic performance has generated significant optimism about the country's outlook, including projections of rapid and sustained output growth going forward. Most of these projections rely on two key assumptions: continued economic reform and the utilization of India's demographic dividend - the huge increase in working-age population to occur over the next 20 years. To date, India's economic rise has been concentrated in high-skill and capital-intensive service and manufacturing sectors, and has not generated strong employment growth, especially for low-skilled workers. Going forward, to achieve the increase in labor input and popular support for reform necessary for high growth, India will have to better develop and utilize its most valuable input - a vast, young, and growing workforce. Growth potential will be greater the better educated is this population and the faster these workers transition from the agriculture sector to jobs in other sectors. In this paper, we review India's growth and employment performance, describe India's demographic dividend, and examine the factors that have hindered India's shift away from the agriculture sector.
2 India's Economic Performance
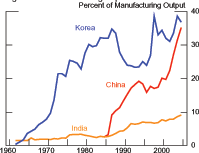
Since the early 1980s, India's average annual output growth has shown remarkable improvement (figure 1), driven by a surge in services and a pickup in manufacturing growth (table 1). This improvement has noticeably changed the composition of India's GDP (figure 2). From around 1980 to 2005, the share of the services sector in output has risen from 38 percent to 54 percent, while the share of agriculture has halved, to 20 percent.1Only the share of India's industry sector, at around 25 percent, has changed little. Compared to other developing countries, India's manufacturing sector is only a bit smaller and its service sector only slightly larger than would be predicted by fundamentals such as GDP per capita and the size of the economy (IMF, 2006). However, India's share of manufacturing falls short of most other Asian economies, particularly China and Korea with which it is often compared (figure 2).
Figure 1: Real GDP Growth
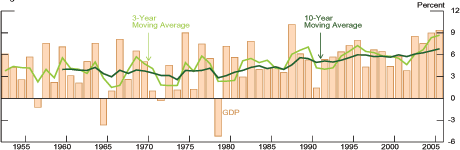
Note: Data are for fiscal years beginning in April, 2005 refers to FY2005/06.
Source: Indian Central Statistical Organisation.
Table 1: Sectoral Composition of GDP and Employment Growth
| Sector | Total | Agriculture | Industry | Services |
|---|---|---|---|---|
| Output Growth: 1973-1983 | 4.2 | 2.9 | 5.0 | 5.2 |
| Output Growth: 1983-2005 | 5.8 | 2.8 | 6.2 | 7.4 |
| Employment Growth: 1973-1983 | 2.2 | 1.4 | 4.3 | 4.1 |
| Employment Growth: 1983-2005 | 2.1 | 1.3 | 3.6 | 3.7 |
| Share of Total in 2005: Output | 100 | 20 | 26 | 54 |
| Share of Total in 2005: Employment | 100 | 57 | 19 | 25 |
Note: Agriculture is defined as agriculture,
forestry and fishing; Industry is mining, manufacturing,
construction and utilities; and Services is trade, finance,
business, and other services.
Source: Indian Central Statistical
Organisation, Indian National Sample Survey Organization.
India's employment growth since the mid-1980s has not mirrored
that of output, either in terms of pace or composition (table 1).
From 1983 to 2005, total employment rose just over 2 percent at an
annual rate, about matching the pace of the slower-growth
1970s.2 On a per capita basis, the contrast is
starker; output per capita has almost tripled since 1983, while
employment per capita is little changed.3Moreover, there is only a
weak tendency for Indians to leave agriculture for higher
productivity work elsewhere. Employment growth in the industry and
services sectors has actually slowed since 1980, while that in
agriculture held steady. As a result, the booming services sector
accounts for only
![]() of current employment, and the agriculture sector still employs
over half of the Indian workforce. The combined share of
manufacturing and services employment in India's total employment
is also low relative to China and Korea, reflecting their stronger
employment growth in services and weak or negative growth in
agriculture.
of current employment, and the agriculture sector still employs
over half of the Indian workforce. The combined share of
manufacturing and services employment in India's total employment
is also low relative to China and Korea, reflecting their stronger
employment growth in services and weak or negative growth in
agriculture.
Figure 2: Shares of Industries and Employment in GDP (percent)
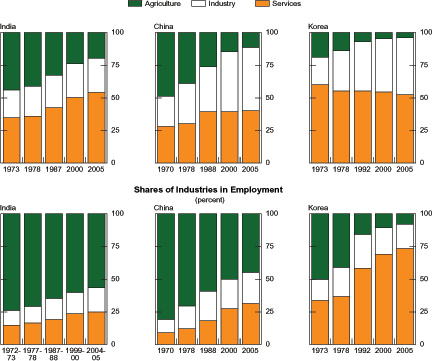
Sources: Indian Central Statistical Organisation, Indian National Sample Survey Organisation, Indian Office of the Registrar General, U.S. Census Bureau, CEIC, and Haver Analytics.
Although India has been successful at improving output growth through rising labor productivity, the lack of meaningful employment growth in the face of strong population growth poses a serious risk to India's future. By definition, growth in India's labor force is a key factor undergirding the country's growth in potential output. India currently has over 500 million people younger than 25 and the country is slated to have the world's largest workforce before 2030. Any estimate of sustained higher growth rates for India relies significantly on the country's capacity to employ this young population and to switch workers from the agriculture sector to the faster growing industry and services sectors (UBS, 2006). Optimistic growth projections for India also rely on continued economic and social reforms.4 The unequal benefits of India's growth have already resulted in political backlash against reformers. If growth remains concentrated in the more high-skilled capital intensive industries and in a few states, the chance for continued significant reform will diminish, and with it India's growth potential.
3 Characterizing India's Workforce
Like most low-income countries, in order to increase the
employment-to-population ratio and reallocate workers toward the
manufacturing and services sectors, India must pull primarily from
the rural population. Currently, slightly more than half of India's
labor force consists of rural agricultural workers (National Sample
Survey Organization, 2006a). Moreover, because
![]() of the country's total population lives in rural areas, India's
workforce is likely to be drawn from the rural population for some
time to come. This group may be quite willing to move to other
sources of employment. McKinsey (2001) estimates that fewer than
half of India's 230 million "full-time" employees in agriculture
are actually fully employed. In addition, Indian national surveys
indicate that 40 percent of Indian farmers would change professions
if given the chance (NSSO, 2003).
of the country's total population lives in rural areas, India's
workforce is likely to be drawn from the rural population for some
time to come. This group may be quite willing to move to other
sources of employment. McKinsey (2001) estimates that fewer than
half of India's 230 million "full-time" employees in agriculture
are actually fully employed. In addition, Indian national surveys
indicate that 40 percent of Indian farmers would change professions
if given the chance (NSSO, 2003).
The skill level of rural workers is quite low, however. According to Indian government, just over half of all rural inhabitants are literate at the primary education level and only 30 percent are literate at the secondary level (table 2). These figures reflect a long period during which the government placed minimal emphasis on broad-based primary education, focusing instead on higher education. Even in 2004, India spent about twice as much on tertiary education per pupil than on primary and secondary education combined. More alarming, on average, Indian teachers are absent from work one-quarter of the time (Kremer et al., 2005). Absentee rates are even higher in poor states. These factors may help explain why India experiences significant attrition in attendance by the secondary level.
In addition, the majority of India's current and future workforce lives in poverty. Roughly, 80 percent of India's population survives on less than $2 per day and 20 percent of the population is undernourished. Children, India's future workforce, suffer disproportionately. Nearly half of children under 5 are moderately to severely underweight. Such levels of malnutrition, especially if sustained, have been linked to difficulties in learning and concentration as well as impairments to cognitive ability (Liu et. al, 2004). Given India's poverty is concentrated in rural areas, where household financial resources are about half those of urban residents, the extent and associated costs of poverty for this group are likely much higher than the average figures would suggest (NSSO, 2006b).
Table 2: Constraints to Human Capital Development
| Rural literacy: 2004-05; percent of rural population 15+: Literate at primary level | 55 |
|---|---|
| Rural literacy: 2004-05; percent of rural population 15+: Literate at secondary level | 31 |
| Public expenditure per pupil: 2004; percent of GDP per capita: Primary | 9 |
| Public expenditure per pupil: 2004; percent of GDP per capita: Secondary | 17 |
| Public expenditure per pupil: 2004; percent of GDP per capita: Tertiary | 95 |
| Gross enrollment ratios: 2005; percent of eligible children: All levels | 62 |
| Gross enrollment ratios: 2005; percent of eligible children: Primary | 115 |
| Gross enrollment ratios: 2005; percent of eligible children: Secondary | 54 |
| Nutrition: percent of total: Total undernourished population (2004) | 20 |
| Nutrition: percent of total: Pct of children < 5 undernourished | 47 |
| Monthly personal consumption expenditure: 2004-05; U.S. dollars: Urban | 24 |
| Monthly personal consumption expenditure: 2004-05; U.S. dollars: Rural | 13 |
Source: World Bank, World Development Indicators (2007), HNP Stats (2007); UNESCO Institute for Statistics; NSSO.
Taken together, these figures imply that the vast majority of India's current and future workforce is neither trained nor well-suited for the jobs currently driving India's output growth. Going forward, most high-growth projections for India assume that educational and infrastructural impediments to growth will dissipate.5 However, for this to happen, stronger progress is needed on reforming education and alleviating poverty. India must to enhance and utilize its human capital to achieve strong growth.
4 India's Agriculture Sector
Improving performance in the Indian agriculture sector will also be central to raising the quality and availability of workers. Research suggests that GDP growth in agriculture has a greater impact on income than that of other sectors, because of its direct effects on earnings and its impact on the availability and price of food (World Bank, 2007b). India's farms have garnered far less media attention than its booming service complexes, but politicians and economists are increasingly realizing that improving India's rural conditions is central to successful development. Unfortunately, lack of investment has made India's agriculture sector the weakest performing in the economy and the challenge of overcoming India's statist policies is formidable.
4.1 Current Performance
India's agriculture sector is enormous. Eight hundred million people live in the rural areas of India (more than the population of the United States and the euro area combined) and 250 million people work in agriculture. Sixty percent of India's land area is classified as agricultural and India's agricultural output is massive. India is among the world's top three producers of milk, wheat, horticulture, and cotton. As is typical for rapidly developing countries, however, growth in India's agriculture sector is slower than that in manufacturing and services - rising at roughly half the pace of overall output.
Figure 3: Agricultural Output Growth
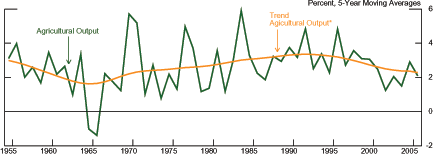
Note: Agricultural Output trend estimated using HP-Filter with smoothing parameter equal to 100. Data are for fiscal years beginning in April, 2005 refers to FY2005/06.
Source: Indian Central Statistical Organisation.
Figure 3 traces output growth in agriculture since the middle of last century. Even on a 5-year moving-average basis, India's agriculture output growth is highly volatile, reflecting the variable monsoon. After declining during the 1950s, trend agriculture growth shifted up noticeably during the 1970s and 1980s. This shift resulted from India's "Green Revolution",' a monumental effort by the Indian government to achieve self-sufficiency in agriculture. With the introduction of higher-yielding varieties of wheat and rice, supportive price policies, and significant investment in rural infrastructure, particularly irrigation, India freed itself from its repeated bouts of famine. However, the country has failed to build on this achievement, and trend growth in agriculture has slowed noticeably since 1990. This performance contrasts sharply with that of China and Korea. At around 2 percent currently, India's agricultural sector is moving forward at less than half the rate of Korea's during the 1980s and of China's during the 1980s and 1990s.
India's relatively poor productivity growth is behind the divergences in performance. Bosworth and Collins (2007) estimate that, from 1978 to 2004, Indian growth in agricultural output per worker was one-third that of China, primarily related to weaker contributions of physical capital and total factor productivity. Indeed, China and especially Korea have more extensive irrigation, higher fertilizer consumption, and Korea has more mechanized production (table 3). Better infrastructure and inputs have resulted in substantially greater crop yields in China and Korea.
Table 3: Selected Agricultural Indicators
| Country | Irrigated Land 2005 (pct of cropland) | Fertilizer Consumption 2002 (Kg/hectare of arable land) | Tractors 2003 (tractors / 100 hectares of arable land) | Cereal Yield 2005 (Kg/hectare) |
|---|---|---|---|---|
| India | 33 | 101 | 159 | 2,367 |
| China | 47 | 383 | 96 | 5,105 |
| Korea | 48 | 415 | 1,285 | 6,283 |
Source: World Bank, World Development Indicators, 2007.
India's poor recent performance in agriculture in large part
reflects a significant slowdown in investment in the sector. Indian
gross fixed capital formation in agriculture grew at nearly 5
![]() percent at an annual rate from 1960 to 1980 (figure 4), roughly at
the pace of growth in non-agriculture investment. Investment growth
in agriculture declined sharply, to 1
percent at an annual rate from 1960 to 1980 (figure 4), roughly at
the pace of growth in non-agriculture investment. Investment growth
in agriculture declined sharply, to 1
![]() percent, from 1980 to 2005. These figures may help explain
why over half of Indian farmers still plow with cattle rather than
tractors.
percent, from 1980 to 2005. These figures may help explain
why over half of Indian farmers still plow with cattle rather than
tractors.
Figure 4: Contributions to Growth in Gross Capital Formation
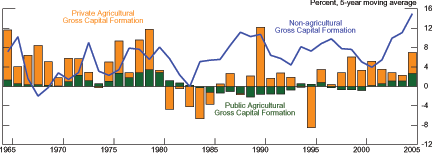
Note: Data are for fiscal years beginning in April, 2005 refers to FY2005/06.
Source: Indian Central Statistical Organisation and author's calculations.
4.2 Causes of Weak Investment
The fall in agricultural investment reflects both a shift in government spending toward subsidies and a move of private investors toward more productive sectors. Although government spending on agriculture is significant (2.1 percent of GDP in FY2006/07), public investment growth has been negative, on balance, since 1980. Over 90 percent of public agriculture spending is current expenditure, sustaining a vast network of subsidies and price supports. Even government agencies designed to improve productivity and maintain infrastructure have been functioning more as employers of last resort. Many regional and state irrigation departments are found to spend nearly 100 percent of their budgets on salaries, with the Uttar Pradesh irrigation department alone employing 110,000 people (Briscoe, 2005).6 State agriculture extension agencies, which were instrumental in transferring knowledge and improving practices during the Green Revolution, are now considered "moribund" with a "disproportionate" share of revenue spent on salaries and little on investment (McKinsey, 2001).
India's private sector and foreign investors cannot easily step in. Foreigners have been prohibited from investing in agriculture and the investment climate is harsh even for domestic investors. Indian federal and state laws control almost every aspect of the agriculture industry. Importantly, the Essential Commodities Act of 1955 strictly regulates the production, supply, storage, and distribution of "essential" commodities, including all food crops, cotton, wool, and jute. State-level Agricultural Produce Marketing Acts required farmers to sell their agricultural goods in regulated markets. The Factories Act of 1948 restricted the scale of the food processing firms, severely limiting development of the industry. As of recently, only 4 percent of India's food is processed, with the majority of India's poultry sold live to final consumers and only 15 percent of wheat processed in modern flour mills (Landes, USDA, 2004). Despite the low level of processing, the layers of government middlemen and institutions created by these laws, combined with poor physical infrastructure, ensure that Indian farmers receive only 15 to 25 percent of the ultimate consumer price of their products. (This figure compares roughly to that in the United States, though with far less processing.)
India's central government has been chipping away at these restrictions, especially in the last five years, but progress has been slow. Because under the Indian constitution agriculture is regulated by the states, the central government can only recommend national agricultural policies; the legislation must be ratified and implemented by the states. Over time the states' own legislation and modifications of federal laws have created a morass of restrictions, severely constraining interstate, and even intrastate, trade. The state-level nature of agriculture policy also means that reform has been piecemeal, with some states becoming more market oriented (e.g. Gujarat) and others remaining highly restrictive (e.g. Bihar).
Private investors have also been hindered by India's poor financial intermediation, market infrastructure, and legal institutions. Directed lending to priority sectors amounts to 40 percent of total banking credit; the agricultural sector specifically receives about 15 percent. Nonetheless, small-scale farmers are chronically capital constrained. The most common source of finance for over 60 percent of all farms is professional money lenders. A recent World Bank survey of 6,000 rural households showed that almost 90 percent of the marginal or landless farmers surveyed had no access to formal credit, and 70 percent had no access to a savings account in a formal financial institution (Basu and Srivastava, 2005). Despite the high risks farmers face, the vast majority have no crop or other insurance. Opportunities to hedge risk in the market are also limited. Until 2004, the Indian government banned commodities futures exchanges. Selected trading is now allowed but, in the face of shortages, the government removed one of its largest crops, wheat, from its list of allowable futures commodities in 2006.
Agricultural investors, like all investors in India, find little
legal support. Out of 175 countries, India ranked 173![]() in the ease of enforcing contracts, making it difficult
for modern agricultural practices to expand (World Bank, 2007d).
Particularly costly has been the lack of clear rules regarding land
ownership and weak protection for lessors and lessees, which limit
the ability of farmers and investors to combine land and take
advantage of economies of scale. This is especially important in
India where the average land holding is 0.2 hectares (around
in the ease of enforcing contracts, making it difficult
for modern agricultural practices to expand (World Bank, 2007d).
Particularly costly has been the lack of clear rules regarding land
ownership and weak protection for lessors and lessees, which limit
the ability of farmers and investors to combine land and take
advantage of economies of scale. This is especially important in
India where the average land holding is 0.2 hectares (around
![]() acre) (Infochange).
acre) (Infochange).
4.3 Moving Forward
With the plight of the farmer and higher food prices as key voter concerns, the agriculture sector is receiving increasing government attention. The FY2007/8 budget and more recent policy announcements suggest greater spending on irrigation and watershed development as well as increased agriculture lending. Government investment on road infrastructure has also been quite heavy in the past few years (e.g. the Golden Quadrilateral). Private microfinance is expanding and innovative rainfall insurance programs are being tested in a number of communities (Gine et al. 2007). Food processing industries have been eliminated from the list of those restricted to be small scale. In 2003, the government encouraged the abolition of state-run monopolies that fixed prices for crops which would free up farmers to sell directly to wholesalers.7 Facilitating this has been the development of village internet connections (web kiosks) where farmers can sell their crops on line, buy products, and access information. Some communities are also seeing a rise in contract farming in which food-processing companies arrange with farmers to grow a specific quantity of a crop, at an agreed-upon price. Earlier, the government significantly reduced restrictions on agriculture exports and imports providing additional market access for farmers.
These measures and practices, however, have yet to meaningfully boost output, and reforms need to be extended. To do this, Indian policymakers will have to win over the rural community. While some farmers are embracing change, many rural residents are worried about the risk change may pose to their meager safety net. A better safety net and improved education, in tandem with a more supportive investment climate, should help allay such fears and contribute to India's future success.
5 India's Manufacturing Sector
As critical to India's future as pushing workers out of the agriculture sector will be pulling them into jobs elsewhere. Especially for the manufacturing sector, the question is why has Indian output and low-skilled employment growth been so weak?
5.1 Overview
After achieving independence in 1947, India's initial vision for the manufacturing sector was the heavy-industry intensive, autarkic model of the Soviet Union. Significant capital investment in government-owned steel and cement factories boosted output growth to over 6 percent in the late 1950s (figure 5). However, in the 1960s, Indian manufacturing languished as attention turned to the agriculture sector and foreign trade options were severely limited. Renewed government spending in the 1980s and intensified liberalization of trade and industry in the 1990s reinvigorated manufacturing and growth returned to its earlier pace. Over the past several years, Indian manufacturing has surged to the high end of its historical range.
Figure 5: Manufacturing Output Growth
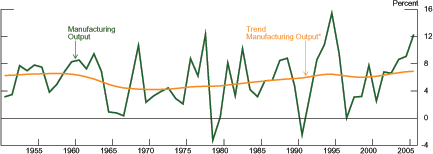
Note: Manufacturing output trend estimated using HP-Filter with smoothing parameter equal to 100. Data are for fiscal years beginning in April, 2005 refers to FY2005/06.
Source: Indian Central Statistical Organisation.
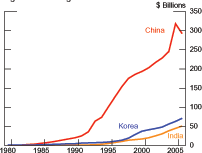
Relative to China and Korea, however, even the booming 12-percent growth experienced by India's manufacturing sector last year barely keeps pace with the trend growth sustained by those countries for decades, and India's trend growth still lags behind (figure 6). The persistent sizable gap between India's growth and that of Korea and China implies that, were the countries to have started at the same level of output in 1965, manufacturing output in Korea and China would now be nearly 12 and 6 times larger, respectively, than in India (figure 7).
Figure 6: Manufacturing Gross Value Added Trend Growth*
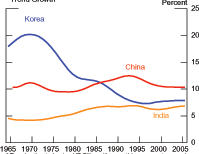
* Trend estimated using HP-Filter with smoothing parameter equal to 100.
Source: World Development Indicators.
Figure 7: Manufacturing Gross Value Added
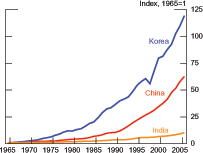
Source: World Development Indicators.
Manufacturing employment growth over the key expansionary
periods for Korea and China was also much stronger. From the early
1960s to the mid-1990s, China's employment in manufacturing rose at
a 6
![]() percent annual pace. Korea's manufacturing employment growth from
1963 to 1990 was an even greater 8 percent annual rate. In
contrast, India's employment growth averaged 3
percent annual pace. Korea's manufacturing employment growth from
1963 to 1990 was an even greater 8 percent annual rate. In
contrast, India's employment growth averaged 3
![]() percent from 1983 to 2005, and was just slightly higher - 4
percent from 1983 to 2005, and was just slightly higher - 4
![]() percent - the decade earlier. Moreover, with few exceptions,
India's high-growth industries are not rapidly generating jobs.
There is almost no correlation across manufacturing industries
between output share and employment share (figure 8) or in growth
in output and employment (figure 9). Indeed, were the
transportation equipment and apparel industries to be removed,
there would be a sizable negative correlation between employment
growth and output growth since 1999.
percent - the decade earlier. Moreover, with few exceptions,
India's high-growth industries are not rapidly generating jobs.
There is almost no correlation across manufacturing industries
between output share and employment share (figure 8) or in growth
in output and employment (figure 9). Indeed, were the
transportation equipment and apparel industries to be removed,
there would be a sizable negative correlation between employment
growth and output growth since 1999.
Figure 8: Shares of Employment and Output
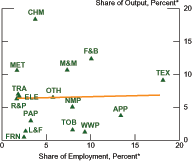
Note: Employment share in FY2004/05, output share in FY2005/06.
Source: India Central Statistical Organisation, National Sample Survey Organisation, and author's calculations.
Figure 9: Growth of Employment and Output
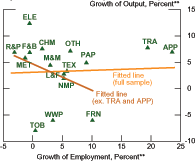
Note: Annualized output and employment growth from FY1999/00 to FY2004/05.
Source: India Central Statistical Organisation, National Sample Survey Organisation, and author's calculations.
Abbreviations for Figures 8 and 9:
| APP=Wearing Apparel | CHM=Chemicals | ELE=Electrical Mach. | F&B=Food & Beverages |
| FRN=Furniture | L&F=Leather and Fur Prod. | M&M=Metal Prod. & Mach. | MET=Basic Metals |
| NMP=Non-Metalic Prod. | OTH=Other Manufacturing | PAP=Paper & Printing Prod. | R&P=Rubber and Petrol. Prod. |
| TEX=Textiles | TOB=Tobacco Prod. | TRA=Transport Equip. | WWP=Wood & Wood Prod. |
5.2 Sources of anemic output growth
Three factors can help explain India's relatively weak performance in manufacturing: Since independence, India has had limited ties to the global economy.8 India's regulations have unintentionally prevented the country from best utilizing its workforce. And, with few exceptions, the country's physical and policy environment has stifled business.
In contrast to the export-led growth model followed by other Asian economies, India intentionally shut itself off from the global economy. The result of this isolation can be plainly seen in figure 10. In the early 1960s, Korea and India had roughly the same low share of manufacturing exports to total manufacturing output, as did China in the mid-1980s. Korea and China both sharply increased their export share in subsequent decades, but, despite some pickup, India's manufacturing exports remain under 10 percent of total manufacturing output.
India has also been remarkably closed in terms of global capital markets. Before 1991, the government almost entirely prevented portfolio and foreign direct investment. Outflows are still tightly controlled and, although portfolio flows have been significantly freed, the relaxation of foreign direct investment controls has been gradual, with the government still regulating investments by requiring approval or by opposing ownership limits. Such restrictions on direct investment have stifled a significant source of capital for the manufacturing industry. In contrast, China has allowed massive foreign direct investment (figure 11).
Figure 10: Manufacturing Exports
Source: World Development Indicators.
Figure 11: Foreign Direct Investment
Source: UNCTAD FDI Online Database.
The situation is improving. Beginning with intermediate imports in the 1980s and recently moving to exports, especially of services, India's trading system has become increasingly liberalized. The country has also become more open to direct investment, which has picked up sharply. India's manufacturing has benefited from this increasing openness - but not through an increase in output for labor-intensive industries, as would be predicted based on relative endowments. Instead, skill- or capital-intensive industries such as chemicals, pharmaceuticals, and basic metals have been the stronger performers.
That gains have been seen more in terms of productivity than in employment likely reflects other institutional factors, especially India's regulations regarding labor and industry. Among the most onerous, revisions to the Industrial Disputes Act of 1947 required large-scale enterprises to obtain state government approval before laying off workers or closing down. Initially, "large-scale" referred to firms with over 300 employees but in 1982 the number was reduced to 100 workers. Given political pressures, states almost never granted approval. In addition, ostensibly to create a strong industrial base but assure jobs, the government reserved certain industries, primarily heavy manufacturing, to be government monopolies and then restricted thousands of others to be small-scale - fewer than 10 employees in firms with electric power and 20 employees in firms without.
These and other laws, along with India's emphasis on tertiary education, created a policy environment unintentionally biased toward high-skilled, capital-intensive enterprises (OECD, 2007). Instead of generating strong job growth, these regulations ensured that most of India's manufacturing establishments remained small - on average 10 times smaller than those of comparable countries (Kochhar et al., 2006). Government restrictions also encouraged firms to minimize the number of workers and, if they did hire, employ those with the highest productivity. Despite its vast endowment of labor, Kochhar et al. show that India has not concentrated its manufacturing in labor-intensive industries and, compared to similar countries, has specialized in industries that produce relatively skill-intensive goods. Reforms so far do not seem to have altered this pattern. One reason may be that the most onerous labor restrictions remain, and workers in India's formal sector are still among the most difficult to fire in the world (World Bank, 2007d).
Manufacturing has also been constrained by India's business infrastructure and regulations (table 4). Infrastructure challenges have been well documented, including the difficulty of transporting goods from factory to market and the limited and costly supplies of water and power. In addition, India has a weak legal and regulatory environment, even when compared to China and Korea.
In India, it has been difficult to start a business, business operations are complicated, and the country lacks effective policies for dealing with failing firms. In particular, only in the past two years have changes in the tax registration system enabled India to halve the time required to start a business to near that in China and Korea. Business startup fees, however, are still substantially higher in India and continued limits on foreign direct investment restrict a source of business creation in numerous sectors.
Table 4: Business Conditions (2007)
| Business Condition | India | China | Korea |
|---|---|---|---|
| Electricity: Distribution losses (2004; percent of domestic supply) | 26.2 | 6.3 | 3.5 |
| Electricity: Cost (2002; U.S. dollars per kilowatt hour) | 7.4 | 3.2 | 6.2 |
| Starting a business: Time required (months) | 1.1 | 1.2 | 0.6 |
| Starting a business: Cost (percent of GDP per capita) | 74.6 | 8.4 | 16.9 |
| Contract enforcement: Procedures required | 46 | 35 | 35 |
| Contract enforcement: Time (months) | 47.3 | 13.5 | 7.7 |
| Property registration: Procedures required | 6 | 4 | 7 |
| Property registration: Time (months) | 2.1 | 1 | 0.4 |
| Closing a business: Recovery rate (cents on the dollar) | 11.6 | 35.9 | 81.2 |
| Closing a business: Time (months) | 120 | 20.4 | 18 |
Sources: Doing Business Database, International Energy Agency, World Competitiveness Report, and World Development Indicators
For existing companies, harsh regulatory practices can severely complicate operations and expansion. A survey by the Federation of Indian Chambers of Commerce and Industry found that companies could be visited by a multitude of inspectors, many with the authority to imprison the factory owner. Contract enforcement is also complicated and lengthy - about 4 years. In China and Korea, there are 25 percent fewer procedures, and disputes are typically settled in under a year. Although the list of Indian industries restricted to be small scale has been slashed, weak property laws and other regulations continue to restrain business growth. For example, the time required for businesses to register their property is double that of China, and five times longer than in Korea.
Finally, a lack of effective bankruptcy or liquidation provisions has prevented the reallocation of assets and employees to more productive uses. On paper, India has relatively strong investor protections, but their effectiveness appears limited (Allen et al, 2007). At present, on average, creditors recover about 12 percent of their claims a decade after the bankruptcy case commences. Moreover, existing bankruptcy regulations allow bankruptcy reorganization proceedings only after the firm's accumulated losses exceed its net value - not at default. Liquidation is lengthy, as well, often taking decades. Moreover, other interests, such as labor, can exercise claims on companies long after operations have ceased. There are cases of companies that closed in the 1980s continuing to pay former employees (Landes, 2005). Debt recovery tribunals established in the 1990s and legislation passed in 2002 related to financial firms increase the power of banks to recover on loans, but such protections have yet to be extended to other types of creditors. Such weak creditor protection helps limit India's corporate bond market to 2 percent of GDP, compared with 11 percent in China and 68 percent in Korea (McKinsey, 2006).
5.3 India's Textile/Apparel Sectors
One of the most striking examples of the debilitating effects of India's trade restrictions, intense regulation of industry, and poor business infrastructure has been the performance of India's textile and apparel industries. India should be a powerhouse in textile and apparel production. The country has an abundant supply of low-skilled labor, a long history as a textile and apparel producer, and the largest land area under cotton production in the world. However, in addition to being significantly surpassed on the international trade front by China, India's textile and apparel sectors have also underperformed domestically (figure 12). The below-average growth of India's textile and apparel industries has been particularly costly in terms of employment creation. These industries are prominent on any list of those exhibiting both high labor intensity and a high proportion of low-skilled jobs. They have also traditionally been critical for countries developing from agriculture-based to industrial economies.
Why has India's performance in these sectors been so weak? The answer lies in the fact that the factors holding back industrial growth in India more generally have combined to suppress output and employment in the apparel and textile sectors. First, the lack of irrigation, the small-scale nature of Indian farming, and poor distribution networks and systems, have meant that India's domestic cotton supply is volatile and often of poor quality (Landes, 2005).
Figure 12: Manufacturing Output
Note: Data are for fiscal years beginning in April, 2005 refers to FY2005/06.
Source: India Central Statistical Organisation.
Figure 13: Fabric Production
Note: Data are for fiscal years beginning in April, 2005 refers to FY2005/06.
Source: Government of India, Economic Survey, various years.
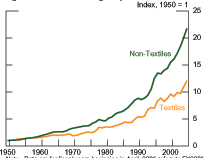
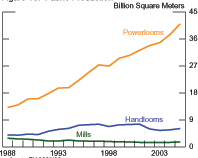
Second, government regulations have been particularly severe on textiles and apparel and, until very recently, have prevented India from taking advantage of economies of scale in these sectors. Before 2001, most of the textile and clothing industries were reserved for the small-scale sector and only in 2005 were knitted and woven cloth and apparel "dereserved" from the small-scale list. Tax and other incentives supporting small-scale producers have stifled integrated mill production and, in India, most textiles are produced on small, individually owned power looms (figure 13).
India's strict labor regulations have also kept Indian textile and apparel establishments from expanding. Some estimates suggest the laws have limited the long-run demand for employees at a given output almost 20 percent (Sato, 2006). McKinsey (2001) finds average Indian apparel exporters have one-tenth the number of sewing machines needed to function efficiently and non-exporters have even fewer machines. Even large firms often divide workers into smaller establishments to prevent labor unrest, at some cost to productivity (McKinsey, 2001). Such diffuse production results in weaker quality control and less adaptability to changes in demand. It also generates one of the longest supply chains in the world, with as many as 15 intermediaries between the cotton farmer and final purchaser (Verma, 2002).
Third, strong domestic restrictions have hindered the ability of firms to export, and textile exports have underperformed overall manufacturing exports since 2000, even after the limits on importing from India in the Multi-Fibre Arrangement were fully lifted in early 2005 (figure 14). Until recently, export of certain textiles and apparel was forbidden. And into this decade, firms that received government permission to export were required to ship over half of their output overseas each year, making it a risky option for many firms. Foreign direct investment in certain types of textile and apparel manufacture is restricted to only 25 percent of the operation, in those cases limiting the use India as an export platform and the exposure of domestic firms to best practices and productivity-enhancing competition. Regulations originally prohibited the use of synthetic fibers and continued regulatory bias against synthetic or blended fibers, which represent a majority of traded apparel and textiles, has also hampered India's industry and exports. (Kathuria and Bhardwaj, 1998)
Figure 14: Total and Textile Exports
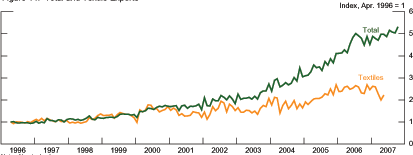
Note: Nominal value.
Source: CEIC database.
Especially since 2000, the government has taken steps to release the textile and apparel sector from a number of the binding regulations. In response, performance in these industries has improved. In particular, employment growth in apparel and textiles jumped to an average annual rate of nearly 24 percent and 6 percent, respectively, between FY1999/00 and FY2004/05 and together the two industries now account for roughly one-third of manufacturing employment. However, the pickup in output growth has been far weaker, and the industries are still underperforming in terms of domestic manufacturing production and exports. Continued improvement in these industries and other low-skilled industries in terms of both employment and productivity growth will be necessary to sustain high growth going forward.
6 Conclusion
India's growth performance so far this decade has elevated India's role in the global economy and generated a new optimism within India and internationally regarding the country's future. Global demographic changes support this optimism. Over the next two decades, India will overtake China as the country with the largest working-age population. The increase in India's working population has the potential to fuel substantial economic growth. However, India has always had a large, rapidly growing population. Sustaining strong growth will require that the country increasingly and more productively employ its labor force. Policy discussions within and outside of India often focus on the need to improve infrastructure, expand higher education, and allow greater foreign entry. These reforms are critical. However, without complementary progress on reforms on improving basic education and nutrition, boosting productivity in the agriculture sector, and easing stifling labor regulations, India may be hard pressed to take advantage of its population windfall and realize the projections of India's optimists.
References
Allen, Franklin, Rajesh Chakrabarti, Sankar Dee, Jun "QJ" Qian, Meijun Qian, 2007. "Financing Firms in India," mimeo.
Ananthakrishnan, Prasad and Sonali Jain-Chandra, 2005. "The Impact on India of Trade Liberalization in the Textiles and Clothing Sector," IMF Working Paper, WP/05/214.
Audinet, Pierre, 2002. "Electricity Prices in India," Energy Prices and Taxes, International Energy Agency, 2002:Q2.
Banerjee, Abhijit, Shawn Cole, and Esther Duflo, 2004. "Banking Reform in India", Massachusetts Institute of Technology Working Paper.
Basu, Priya and Pradeep Srivastava, 2005. "Scaling-up Microfinance for India's Rural Poor," World Bank Policy Research Working Paper 3646, June 2005.
Bosworth, Barry and Susan Collins, 2007. "Accounting for Growth: Comparing China and India," Economics of Developing Countries Papers, Brookings Institution.
Briscoe, John (2005) "India's Water Economy: Bracing for a Turbulent Future," World Bank.
Chand, Satish and Kunal Sen, 2002. "Trade Liberalization and Productivity Growth: Evidence From Indian Manufacturing." Review of Development Economics, Vol 6, pp 120-132.
The Economic Times, "New Farm Produce Marketing Act Set to be in by March," May 30, 2007, New York Times Network.
Gine, Xavier, Robert Townsend, and James Vickery, February 2007. "Patterns of Rainfall Insurance Participation in Rural India." Mimeo.
Goswami, Omkar. India: the Tide Rises Gradually in "Corporate Governance in Development: the Experiences of Brazil, Chile, India, and South Africa," ed. Charles P. Oman, OECD, 2003.
Infochange, "Agriculture and Food Security: Background and Perspective," Centre for Communication and Development Studies, http://www.infochangeindia.org/AgricultureIbp.jsp
International Energy Agency, 2007, International Energy Statistics, http://www.iea.org/Textbase/stats/index.asp
International Monetary Fund, September 2006. "Asia Rising: Patterns of Economic Development and Growth," World Economic Outlook, Washington D.C.
Jha, Veena, 2005. "Trade Adjustment Study: India," United Nations Conference on Trade and Development, http://r0.unctad.org/ditc/tab/publications/nama/india_study.pdf.
Kathuria, Sanjay and Anjali Bhardwaj, 1998. "Export Quotas and Policy Constraints in the Indian Textile and Garment Industries," Working Paper, SASPR, World Bank.
Kochhar, Kalpana, Utsav Kumar, Raghuram Rajan, Arvind Subramanian, and Ioannis Tokatlidis, January 2006. "India's Pattern of Development: What Happened, What Follows?" IMF Working Paper, WP/06/22.
Kremer, Michael, Nazmul Chaudhury, Jeffrey Hammer, Karthik Muralidharan, F. Halsey Rogers, 2005. "Teacher Absence in India: A Snapshot," Journal of the European Economic Association, 3:2-3 (April-May 2005): 658-667.
Landes, Maurice, 2004. "The Elephant is Jogging: New Pressures for Agricultural Reform in India," Amberwaves, Economic Research Service, U.S. Department of Agriculture, February.
Landes, Maurice, Stephen MacDonald, Santosh K. Singh, and Thomas Vollrath, 2005. "Growth Prospects for India's Cotton and Textile Industries," Electronic Outlook Report from the Economic Research Service, U.S. Department of Agriculture, www.ers.usda.gov.
Liu, Jianghong, Adrian Raine, Peter H. Venables, and Sarnoff A. Mednick, November 2004. "Malnutrition at Age 3 Years and Externalizing Behavior Problems at Ages 8, 11, and 17 Years," American Journal of Psychiatry, vol. 161, pp. 2005-2012.
Mattoo, Aaditya, Deepak Mishra, Ashish Narain. World Bank, 2007c. "From Competition at Home to Competing Abroad: A Case Study of India's Horticulture." World Bank.
McKinsey & Company. "India: The Growth Imperative." September 2001.
McKinsey & Company. "Accelerating India's Growth through Financial System Reform", May 2006
Mitra, Devashish and Beyza P. Ural, 2007. "Indian Manufacturing: A Slow Sector in a Rapidly Growing Economy." World Bank Policy Research Working Paper, 4233.
National Sample Survey Organisation, 2003. "Some Aspects of
Farming, 2003 59![]() Round," Report No. 496.
Round," Report No. 496.
National Sample Survey Organisation, September 2006a.
"Employment and Unemployment Situation in India 2004-05: NSS
61![]() Round (July 2004-June 2005)," Report
No. 515(61/10/1).
Round (July 2004-June 2005)," Report
No. 515(61/10/1).
National Sample Survey Organisation, December 2006b. "Level and
Pattern of Consumer Expenditure, 2004-05: NSS 61![]() Round (July 2004-June 2005)," Report No.
508(61/1.0/1).
Round (July 2004-June 2005)," Report No.
508(61/1.0/1).
Organisation for Economic Co-operation and Development, 2007. "India," OECD Economic Surveys, vol. 2007/14, October.
Poddar, Tushai and Eva Yi, 2007. "India's Rising Growth Potential," Global Economics Paper # 152, Goldman Sachs, January 22.
Rodrik, Dani and Arvind Subramanian, July 2004. "Why India Can Grow at 7 Percent a Year or More: Projections and Reflections," IMF Working Paper, WP/04/118.
Sato, Takahiro, 2006. "Labour Demand in the India's Textile and Apparel Industries: A Comparative Analysis of Organzied and Informal Sectors," Department of Economics, Osaka City University, mimeo.
UBS Investment Research, 2006. "The Base of the Indian Pyramid," Global Economic and Strategy Research, UBS, March 2.
Verma, Samar, 2002. "Export Competitiveness of Indian Textile and Garment Industry," Working Paper 94, Indian Council For Research on International Economic Relations, November.
Wilson, Beth Anne and Geoffrey Keim, January 2006. "India and the Global Economy," Business Economics, vol 41, no. 1.
Wilson, Dominic and Roopa Purushothaman, October 2003. "Dreaming with BRICs: The Path to 2050," Goldman Sachs Global Economics Paper No. 99.
World Bank, 2005. "India: Road Transport Service Efficiency Study," Washington DC.
World Bank, 2007a. World Development Indicators,
World Bank, 2007b. World Development Report 2008. Washington D.C.
World Bank, 2007c "India: Taking Agriculture to the Market"
World Bank, 2007d, Doing Business Database, http://www.doingbusiness.org.
Footnotes
* We appreciated the comments of Jane Haltmaier, Mike Leahy, and Robert Martin and the excellent assistance of Suzanne Plant. The views expressed in this paper are solely the responsibility of the authors and should not be interpreted as reflecting the views of the Board of Governors of the Federal Reserve System or of any other person associated with the Federal Reserve System. Corresponding Author: Beth Anne Wilson, Mail Stop 24, Federal Reserve Board, Washington, DC 20551 USA. Email: [email protected]. Return to text
1. The declining weight of the volatile agriculture sector has led to increasingly stable GDP. Return to text
2. Employment data are from the Indian National Sample Survey Organisation which conducts an employment survey over a twelve-month period roughly once every five years. The first of these surveys was conducted during 1972-73, with subsequent surveys in 1977-78, 1983, 1987-88, 1999-00, and 2004-05. Return to text
3. See also Bosworth and Collins (2007). Return to text
4. See Goldman Sachs (2003) and (2007) and Rodrik and Subramanian (2004). Return to text
5. For example, Goldman Sachs (2003). Return to text
6. Such weak investment has left India's irrigation system limited and in disrepair. With little capacity for storing rainwater, farmers have turned to pumping groundwater using heavily subsidized electricity, leading to overexploitation or near-overexploitation of almost one-fifth of the country's groundwater. Return to text
7. As of mid-2007, 16 of 29 states had amended a draft federal legislation, the Agriculture Produce and Marketing Committee Act. All 29 states are expected to have completed the process by March 2008. (The Economic Times, 2007) Return to text
8. For a discussion of India's current links to the world economy see Wilson and Keim (2006). Return to text
This version is optimized for use by screen readers. Descriptions for all mathematical expressions are provided in LaTex format. A printable pdf version is available. Return to text