
Board of Governors of the Federal Reserve System
International Finance Discussion Papers
Number 927, April 2008--- Screen Reader
Version*
Emerging Market Business Cycles Revisited: Learning about the Trend*
NOTE: International Finance Discussion Papers are preliminary materials circulated to stimulate discussion and critical comment. References in publications to International Finance Discussion Papers (other than an acknowledgment that the writer has had access to unpublished material) should be cleared with the author or authors. Recent IFDPs are available on the Web at http://www.federalreserve.gov/pubs/ifdp/. This paper can be downloaded without charge from the Social Science Research Network electronic library at http://www.ssrn.com/.
Abstract:
The data reveal that emerging markets do not differ from developed countries with regards to the variance of permanent TFP shocks relative to transitory. They do differ, however, in the degree of uncertainty agents face when formulating expectations. Based on these observations, we build an equilibrium business cycle model in which the agents cannot perfectly distinguish between the permanent and transitory components of TFP shocks. When formulating expectations, they assign some probability to TFP shocks being permanent even when they are purely transitory. This is sufficient for the model to produce "permanent-like" effects in response to transitory shocks. The imperfect information model calibrated to Mexico predicts a higher variability of consumption relative to output and a strongly negative correlation between the trade balance and output, without the predominance of trend shocks. The same model assuming perfect information and calibrated to Canada accounts for developed country business cycle regularities. The estimated relative variance of trend shocks in these two models is similar.
Keywords: Emerging markets, business cycles, learning, Kalman filter
JEL classification: F41, E44, D82
1 Introduction
Some of the key stylized facts regarding economic fluctuations in emerging market economies seem at odds with the neoclassical theory of business cycle fluctuations for small open economies. In particular, it has been a challenge for these models to generate a higher variability of consumption relative to output along with a negative correlation between the cyclical components of the trade balance and output as observed in the data. The present paper analyzes the importance of imperfect information and learning about trend shocks hitting the economy in explaining these features of emerging market business cycles.
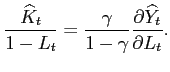
To do so, we build a small open economy model in which the agent in an emerging market economy observes all the past and current realizations of TFP shocks and knows the stochastic properties of the distributions of trend growth and transitory components, but does not observe the realizations of these components. Using the available information, she forms expectations about trend growth (or permanent) and transitory (or cycle) components of total factor productivity (TFP, henceforth) shocks using the Kalman Filter.1 The agent in the developed economy, however, is fully informed about the decomposition of TFP. The two economies are identical otherwise.
Our motivation for differentiating these two types of countries (i.e., emerging market vs. developed) based on available information relies on the following empirical observation. We find that the average standard deviation of GDP growth forecasting errors for emerging markets is more than twice that of developed economies suggesting that an additional layer of uncertainty regarding the decomposition of TFP into its components is relevant. In the emerging market economy model, the agent can react to a transitory shock as if it were permanent, amplifying business cycle fluctuations.
The model features production with endogenous capital and labor, where there are costs associated with adjusting capital. The agent can borrow and lend in international capital markets. Capital markets are incomplete, because the only financial instrument available is a one-period non-contingent bond. This bond pays an interest rate that increases with the debt level to account for possible risk premia charged due to a higher default risk when debt increases.
This paper shows that the imperfect information model calibrated
to Mexico, can closely match the data. In particular, it generates
a higher variability of consumption relative to output and a strong
negative correlation between the trade balance and output for a
wide range of relative variance of trend shocks. A standard
deviation of trend shocks relative to cyclical shocks in the
interval ![]() allows the model to match key features
of emerging market moments reasonably well.
allows the model to match key features
of emerging market moments reasonably well.
The main mechanism driving our results is based on the learning dynamics. Under imperfect information, the agent assigns some probability to the TFP shocks being permanent even when they are purely transitory. When the signals are modeled as trend plus cycle (as opposed to trend plus noise or cycle plus noise), the agent's beliefs about the contemporaneous trend shocks relative to the cycle are amplified. In this setting, the agent optimally decomposes signals into trend growth shocks and cyclical level shocks. An important implication of this formulation is that when updating the beliefs about the changes in the cyclical shocks, the agent updates her beliefs not only about the contemporaneous cyclical shocks but also their first lag. Although this backward revision has no implications for the already executed decisions in the previous period, it implies, for example, that in response to a positive signal, the agent may improve her beliefs about the change in level of cyclical shocks by not only improving her beliefs about the contemporaneous cyclical shock but also by lowering the one about the previous period's cyclical shock. Therefore, she improves her beliefs about contemporaneous cyclical shock by less than she would otherwise, leading to a dampening of the cyclical shocks relative to the trend growth. Hence, when the agent observes a signal, her beliefs are biased towards the trend growth component. Moreover, the policy functions react more to the trend growth shocks compared to cyclical; therefore, a slightly higher probability assigned to the trend growth component relative to the contemporaneous cyclical component is sufficient for the model to produce "permanent-like" responses.
The perfect information model calibrated to Canada is also successful in accounting for business cycle regularities in developed countries as shown by Aguiar and Gopinath (2007) (AG, henceforth). The relative variance of trend shocks estimated using Canadian data in the perfect information model is very close to that estimated using Mexican data with the imperfect information model confirming that these two models do not rely on differences in relative variance of trend shocks. Consistently, when we feed the Mexico parameters estimated using imperfect information model into the perfect information model, we find that the resulting business cycle moments are similar to those of developed countries.
Our paper relates mainly to AG and Garcia-Cicco, Pancrazzi and Uribe (2006) (GPU, henceforth).2 AG made a significant contribution to the literature by showing that introducing trend shocks to an otherwise standard small open economy real business cycle model can account for the aforementioned features of economic fluctuations in emerging market economies.3 Our perfect information setup is identical to AG's model.
In order for AG's model to account for the two key features of emerging market cycles mentioned above, a high variability of trend shocks relative to the transitory shocks is necessary.4 Empirical evidence regarding the predominance of trend shocks, however, is inconclusive. AG present evidence suggesting that the relative variance of trend shocks to transitory shocks in Mexico might be higher than in Canada, but caution that this result is statistically insignificant in a univariate analysis.5 In a more recent study, GPU present estimates for Argentina that suggest otherwise. GPU argue that the assumption of highly dominant trend shocks is not robust to considering longer time series data. In this study, instead of focusing on one country, we calculate the relative variance of trend shocks using TFP data for 21 developed and 25 emerging market countries and show that developed and emerging market countries are not significantly different in this regard. Therefore, explanations of the differences between these two types of countries should not hinge on the relative variance of trend growth shocks.
Our paper differs from the existing literature mainly with regards to modelling of imperfect information and learning. The existing literature assumes that the agents are fully-informed about the types of shocks, that is, when they observe a high realization of output, they know for sure if it is permanent or transitory. If TFP would measure primarily idiosyncratic technological shocks at the firm level, one could argue that at the micro level, agents could have perfect information about the type of shocks they receive and that imperfect information is just a statistical problem for the econometrician. However, the main intuition proposed in the literature for why trend shocks could be more dominant in emerging markets is the importance of regime changes (monetary, fiscal, and trade policies) which most certainly are not perfectly distinguishable at the firm or household level. Thus, it appears to be rather a strong assumption especially for emerging market economies. The empirical evidence presented in this paper shows that the degree of uncertainty faced by agents for emerging markets when formulating expectations differs significantly compared to those formulated for developed economies as discussed above.
Our findings do not imply that trend shocks are unimportant. On the contrary, our study confirms the importance of these shocks in explaining emerging market regularities in a setting where agents are imperfectly informed about the types of shocks. By modelling this informational friction explicitly, we eliminate the need for higher variability of trend shocks which does not appear to be supported by the data.
Other papers that our study is related to include Mendoza and Smith (2006), who build an equilibrium model with collateral constraints that amplifies negative productivity shocks to explain excess volatility movements nested in regular business cycles such as Sudden Stops. In a related paper, Neumeyer and Perri (2005) show that real interest rates including default risk are volatile in emerging markets and argue that they lead the business cycles.6
Our paper also relates to the literature on macro models with learning.7 To our knowledge, ours is the first paper to incorporate a learning problem with permanent shocks as well as persistent AR(1) transitory shocks using Kalman filtering techniques into a dynamic stochastic general equilibrium growth model. In this literature, Nieuwerburgh and Veldkamp (2004) study U.S. business cycle asymmetries in an RBC framework with asymmetric learning. Their analysis focuses on whether learning regarding transitory TFP shocks can induce asymmetries in output growth over the business cycle. Also, Boz (2007) investigates the business cycle implications of learning about persistent productivity shocks. Again, this model does not allow simultaneously for both, permanent and transitory shocks. In a related paper, Edge, Laubach and Williams (2004) show that uncertainty with respect to the nature of productivity shocks (permanent shifts versus transitory shocks) helps explain some of the U.S. business cycle characteristics. Their model, however, differs from ours in that the focus of their paper is to understand the U.S. economy in the presence of the alleged TFP acceleration that took place in the early 1990's.8 In addition, in their setup, signals are modelled as trend plus iid shocks, whereas we model signals as trend plus AR(1) cycle shocks which leads to the amplification of trend shocks. Last but not the least Jaimovich and Rebelo (2006) and Lorenzoni (2006) also model informational frictions in the context of news driven business cycles.
The rest of the paper is structured as follows. The next section presents our empirical findings. Section 3 introduces the model as well as the information structure and the consequent learning process. Section 4 presents the results of our quantitative analysis and compares those results with existing studies. Section 5 concludes and discusses extensions for further research.
2 Empirical Evidence
2.1 Comparison of Solow Residuals
In this subsection, we explore whether there are any systematic differences in the dominance of permanent shocks between emerging market economies and developed economies. In order to analyze this issue, we apply the methodology of Cochrane (1988) to calculate the variance of the random walk components relative to transitory ones for Solow residuals using annual data for 1960-2003 for a set of developed (21) and emerging market (25) countries.9
The decomposition of shocks into permanent and transitory
components proposed by Cochrane (1988) relies on the following
intuition. Suppose that TFP (![]() ) follows a random
walk with drift, such that:
) follows a random
walk with drift, such that:
| (1) |
where
![]() is assumed to be a white noise
process with mean 0 and standard deviation
is assumed to be a white noise
process with mean 0 and standard deviation
![]() .
.
In this case, the variance of the k-differences defined
as
![]() would
increase linearly in
would
increase linearly in ![]() , given that:
, given that:
| (2) |
However, if the TFP process is dominated by a stationary process -
potentially following an ARMA process around a deterministic trend
(e.g.
![]() with
with
![]() ) this
variance would converge to a constant, independent of k.
This implies that as k increases, the following variance
ratio:
) this
variance would converge to a constant, independent of k.
This implies that as k increases, the following variance
ratio:
![]() , converges
either to 1 - if the permanent component of shocks dominates - or
to 0 if transitory perturbations around a deterministic trend
dominates. As Cochrane (1988) argues, this test has the advantage
of not imposing too much structure on the underlying process and
remains valid for any
, converges
either to 1 - if the permanent component of shocks dominates - or
to 0 if transitory perturbations around a deterministic trend
dominates. As Cochrane (1988) argues, this test has the advantage
of not imposing too much structure on the underlying process and
remains valid for any ![]() time series that allows a
Beveridge-Nelson representation into a stochastic trend and a
transitory component.
time series that allows a
Beveridge-Nelson representation into a stochastic trend and a
transitory component.
In order to analyze whether there is any systematic evidence of
trend shocks being more dominant in emerging market countries
compared to developed economies, we compute the sample variances
for the log-differences of the Solow residuals for
![]() for each country from
Blyde, Daude and Fernandez-Arias (2007).10 This is the same
procedure AG use to analyze the cases of Canada and Mexico.
However, our sample period is almost twice as long as AG's and we
use a large sample of countries.
for each country from
Blyde, Daude and Fernandez-Arias (2007).10 This is the same
procedure AG use to analyze the cases of Canada and Mexico.
However, our sample period is almost twice as long as AG's and we
use a large sample of countries.
Figure 1 displays average random walk components of Solow residuals for both groups of countries. For lags less than 15, developed countries' point estimates appear to be larger than those of emerging market countries. This finding, however, depends on the lag specification and is not statistically significant. Moreover, there is considerable dispersion across countries within each group as suggested by the estimated kernel densities reported in Figure 2. For lag specifications of 5 and 10, the distributions for developed countries are to the right of those of emerging market countries suggesting higher dominance of the random walk component, but again these differences are not statistically significant. We conclude that developed and emerging market countries do not significantly differ in the importance of permanent shocks to TFP.11
2.2 Comparison of Forecast Errors
To explore if there are any differences in the uncertainty faced in emerging markets compared to developed economies, we calculate the standard deviations of forecast errors, check the efficiency of these errors, and also examine their autocorrelation structure.
Let the forecast for period ![]() based on
information available at time
based on
information available at time ![]() be defined by
be defined by
![]() and actual GDP growth be
and actual GDP growth be
![]() . Then, the one-step-ahead forecast
error can be defined as:
. Then, the one-step-ahead forecast
error can be defined as:
| (3) |
First, we investigate the standard deviations of forecast errors
based on Consensus Forecasts, IMF's World Economic Outlook
forecasts, and finally by estimating an ARMA model using TFP data.
Table 1
summarizes the standard deviations of Consensus Forecasts' forecast
errors (![]() ) for quarterly GDP growth (at
annualized rates) for a set of developed and emerging market
countries until the third quarter of 2007 since - at most - the
last quarter of 1998.12 This table suggests that the
standard deviations of forecast errors for emerging markets are
systematically higher than those of developed economies. On
average, the standard deviation of these errors are 1.04 percentage
points for emerging markets and 0.46 percentage points for
developed countries, less than half that of emerging markets. The
same result holds if we consider the median standard deviation of
forecast errors for both groups. In this case, emerging markets
median value is 0.81 versus 0.38 for developed countries. Thus,
forecasts are subject to more uncertainty in emerging markets than
in developed countries. Similar evidence is reported by Timmermann
(2006) regarding the World Economic Outlook forecast errors.
For example, for Western Hemisphere the standard deviation of
forecast errors is 2.41%, Asia (2.22%), Middle East (6.38%), Africa
(3.19%), and Central and Eastern Europe (3.49%), while for advanced
economies it is 1.36%. Finally, estimating a simple
country-specific ARMA model including or not a time trend for our
TFP yields standard deviations of forecast errors for the emerging
market sample that are on average 78% larger than for developed
countries.13
) for quarterly GDP growth (at
annualized rates) for a set of developed and emerging market
countries until the third quarter of 2007 since - at most - the
last quarter of 1998.12 This table suggests that the
standard deviations of forecast errors for emerging markets are
systematically higher than those of developed economies. On
average, the standard deviation of these errors are 1.04 percentage
points for emerging markets and 0.46 percentage points for
developed countries, less than half that of emerging markets. The
same result holds if we consider the median standard deviation of
forecast errors for both groups. In this case, emerging markets
median value is 0.81 versus 0.38 for developed countries. Thus,
forecasts are subject to more uncertainty in emerging markets than
in developed countries. Similar evidence is reported by Timmermann
(2006) regarding the World Economic Outlook forecast errors.
For example, for Western Hemisphere the standard deviation of
forecast errors is 2.41%, Asia (2.22%), Middle East (6.38%), Africa
(3.19%), and Central and Eastern Europe (3.49%), while for advanced
economies it is 1.36%. Finally, estimating a simple
country-specific ARMA model including or not a time trend for our
TFP yields standard deviations of forecast errors for the emerging
market sample that are on average 78% larger than for developed
countries.13
Second, in emerging market economies forecast errors are more likely to be inefficient, in the sense that the sample mean of forecasting errors differs significantly from zero which would imply that forecasters make systematic errors when projecting GDP growth. While in the case of developed countries there are just two cases out of ten where the forecast errors are biased, for emerging markets in more than 40% of the cases (8 out of 18) the sample mean of forecast errors differs significantly from zero at a 10% level of significance. This result suggests again that there are serious difficulties in forecasting the relevant economic variables for emerging markets.
Finally, we also examine first order AR of forecast errors. These autocorrelations are positive and significant for the cases of Argentina and Mexico, however, there is no developed country with a significant autocorrelation. This positive autocorrelation implies that if e.g. the current GDP growth forecast is below the actual realization, next period it will probably underestimate growth again. This type of errors are likely to occur if a trend shock hits and agents are uncertain about it. In the case of a positive (negative) trend shock, they would underestimate (overestimate) until they learn that a structural break took place.14
3 Model
We consider a standard small open economy real business cycle model with trend shocks similar to that utilized by AG and GPU. Unlike these two studies, in our emerging market economy model, the representative agent is imperfectly informed about the trend-cycle decomposition of the TFP shocks and, thereby, solves a learning problem as explained in detail below. When for comparison we consider a developed economy model, we assume perfect information. Therefore, the model for the developed economy is identical to those considered previously in the literature.
The model features production with endogenous capital and labor. There are costs associated with adjusting capital which are typically introduced in the literature to match the variability and the persistence in investment. The agent can borrow and lend in international capital markets. We assume incomplete asset markets, such that the only financial instrument available is a one-period non-contingent bond that pays an interest rate that increases with the debt level to account for possible risk premia charged due to a higher default risk when debt increases.15 At the beginning of every period, the agent observes the realization of TFP shock, updates expectations regarding the components of TFP, makes investment, labor, level of debt, and consumption decisions.
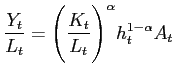
The production function takes a standard Cobb-Douglas form,
| (4) |
where
![]() is the labor's share of
output.
is the labor's share of
output. ![]() is the transitory shock that follows an
AR(1) process
is the transitory shock that follows an
AR(1) process
| (5) |
with
![]() , and
, and
![]() is independently and
identically and normally distributed,
is independently and
identically and normally distributed,
![]() .
.
![]() represents the cumulative product of
growth shocks and is defined by
represents the cumulative product of
growth shocks and is defined by
|
and
where
![]() , and
, and
![]() is independently and
identically and normally distributed with
is independently and
identically and normally distributed with
![]() . The
term
. The
term ![]() represents the long run mean growth
rate. Combining trend growth and transitory shocks, we define a
single productivity shock
represents the long run mean growth
rate. Combining trend growth and transitory shocks, we define a
single productivity shock ![]() :16
:16
| (6) |
and growth rate of ![]() as
as ![]() :
:
|
(7) |
The representative agent's utility function is in Cobb-Douglas form:
|
(8) |
The agent maximizes expected present discounted value of utility subject to the following resource constraint:
|
(9) |
![]() ,
, ![]() ,
, ![]() , and
, and ![]() denote consumption, the capital
stock, price of debt and the level of debt, respectively. We assume
that capital depreciates at the rate
denote consumption, the capital
stock, price of debt and the level of debt, respectively. We assume
that capital depreciates at the rate ![]() , and
adjustments to capital stock requires quadratic adjustment cost
where
, and
adjustments to capital stock requires quadratic adjustment cost
where ![]() is adjustment cost parameter.
is adjustment cost parameter.
![]() denotes the unconditional mean of the
growth rate of
denotes the unconditional mean of the
growth rate of ![]() .
.
We assume that the small open economy faces a debt-elastic interest-rate premium, such that the interest rate paid is given by:
![$\displaystyle \frac{1}{q_t}=1+r_t=1+r^*+\psi\left[e^{\frac{B_{t+1}}{A_t}-b}-1\right],$](img51.gif)
|
(10) |
where ![]() is the aggregate level of debt that the
representative agent takes as given.17
is the aggregate level of debt that the
representative agent takes as given.17
Since realizations of shock ![]() permanently
affect
permanently
affect ![]() , output is nonstationary. To induce
stationarity, we normalize all the variables by
, output is nonstationary. To induce
stationarity, we normalize all the variables by ![]() .18 We use the notation that a variable
with a hat denotes its detrended counterpart. After detrending, the
resource constraint becomes:
.18 We use the notation that a variable
with a hat denotes its detrended counterpart. After detrending, the
resource constraint becomes:
|
(11) |
The recursive representation of the representative agent's problem can be formulated as follows:

|
(12) |
where
![]() and
and
![]() are the beliefs
regarding the transitory and permanent shock, respectively.
are the beliefs
regarding the transitory and permanent shock, respectively.
subject to the budget constraint:

|
(13) |
Defining investment as ![]() , we can summarize
the evolution of the capital stock as follows:
, we can summarize
the evolution of the capital stock as follows:
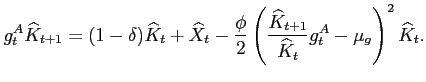
|
(14) |
The first order conditions for the competitive equilibrium are:
|
(15) |
|
(16) |
|
(17) |
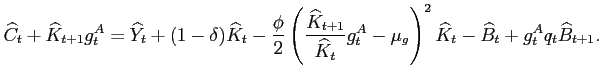
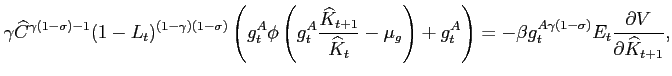
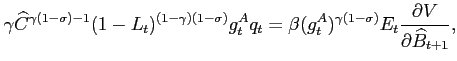
Equation (15) is the Euler Equation that relates the marginal benefit of investing an additional unit of resource in capital to marginal cost of not consuming that unit. Equation (16) is the Euler Equation related to the level of debt and equation (17) is the first order condition concerning the labor-leisure choice.
3.1 Filtering Problem
In our emerging market economy model, we assume that the
representative agent is imperfectly informed about the true
decomposition of the TFP shocks into its trend growth and cycle
components and forms expectations about this decomposition using
the Kalman filter. Her information set as of time ![]() includes the entire history of TFP shocks;
includes the entire history of TFP shocks;
![]() . We also assume
that underlying probabilistic distributions of
. We also assume
that underlying probabilistic distributions of ![]() and
and ![]() are known to the agent. Thus, we
abstract from any consideration regarding model uncertainty to
concentrate exclusively on the implications of learning under
imperfect information about the nature of the shocks.
are known to the agent. Thus, we
abstract from any consideration regarding model uncertainty to
concentrate exclusively on the implications of learning under
imperfect information about the nature of the shocks.
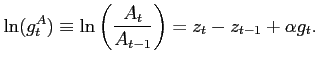
In order to use the Kalman filter, we express the filtering
problem in state space form as described in Harvey (1989). This
form is composed of a measurement equation and a transition
equation. The measurement equation describes the relationship
between the observed variable ![]() , and the
unobserved variables
, and the
unobserved variables ![]() and
and ![]() , and is
given by:
, and is
given by:
![$\displaystyle \ln(g_t^A)=\underbrace{\left[ \begin{array}{c c c} 1& -1 &\alpha\end{array}\right]}_{\textbf{Z}} \underbrace{\left[ \begin{array}{c} z_t \\ z_{t-1}\\ g_t \end{array}\right]}_{\boldsymbol{\alpha}_t}.$](img80.gif)
|
(18) |
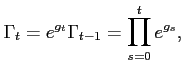
The measurement equation is in fact just a restatement of Equation (7). The transition equation summarizes the evolution of unobserved variables and is given by:
![$\displaystyle \underbrace{\left[ \begin{array}{c} z_t \\ z_{t-1}\\ g_t \end{array}\right]}_{\boldsymbol{\alpha}_t}= \underbrace{\left[ \begin{array}{c c c} \rho_z& 0 &0 \\ 1&0&0 \\ 0&0&\rho_g \end{array}\right]}_{\textbf{T}} \underbrace{\left[ \begin{array}{c} z_{t-1} \\ z_{t-2} \\ g_{t-1} \end{array}\right]}_{\boldsymbol{\alpha}_{t-1}}+ \underbrace{\left[ \begin{array}{c} 0 \\ 0\\ (1-\rho_g) \mu_g \end{array}\right]}_{\textbf{c}}+ \underbrace{\left[ \begin{array}{c c} 1 &0 \\ 0 & 0\\ 0&1\end{array}\right]}_{\textbf{R}} \underbrace{\left[ \begin{array}{c} \epsilon_t^z \\ \epsilon_t^g \end{array}\right]}_{\boldsymbol{\eta}_t}$](img81.gif)
|
(19) |
where
![]() and
and
![$ \textbf{Q}\equiv\left[ \begin{array}{c c} \sigma^2_z & 0\\ 0 & \sigma^2_g \end{array}\right]$](img83.gif) . Equation (19) simply
summarizes the autoregressive processes of trend growth and
transitory components of TFP in matrix notation. Given the
normality of the disturbances, the optimal estimator that minimizes
the mean squared error is linear. The matrices Z, d,
T, c, R and Q are the system
matrices. Following the notation of Harvey (1989), we denote
the optimal estimator of
. Equation (19) simply
summarizes the autoregressive processes of trend growth and
transitory components of TFP in matrix notation. Given the
normality of the disturbances, the optimal estimator that minimizes
the mean squared error is linear. The matrices Z, d,
T, c, R and Q are the system
matrices. Following the notation of Harvey (1989), we denote
the optimal estimator of
![]() based on information
set,
based on information
set, ![]() by
by
![]() :
:
| (20) |
The covariance matrix of the estimation error is given by
![]() :
:
| (21) |
In this setting, the updating rule converges monotonically to the steady state and the error covariance matrix becomes time-invariant.19 In addition, the steady state error covariance matrix can be calculated as a solution to the following algebraic Riccati equation:
| (22) |
Finally, based on ![]() and the transition
equation, we have:
and the transition
equation, we have:
| (23) |
The updating rule sets the posteriors
![]() to be a convex combination of
prior beliefs
to be a convex combination of
prior beliefs
![]() and the new signal
and the new signal
![]() :
:
![$\displaystyle \textbf{a}_t=\underbrace{[\textbf{I}-\textbf{P}\textbf{Z}'(\textbf{Z}\textbf{P}\textbf{Z}')^{-1} \textbf{Z}]}_{k^1}\textbf{a}_{t\vert t-1}+\underbrace{[\textbf{P}\textbf{Z}'(\textbf{Z}\textbf{P}\textbf{Z}')^{-1}]}_{k^2}\ln(g_t^A)$](img96.gif)
|
(24) |
where
![]() is an identity matrix of size 3
is an identity matrix of size 3
![]() 1. Equations (23) and (24) fully
characterize learning.
1. Equations (23) and (24) fully
characterize learning.
Equation (24) deserves a
closer look. This equation consists of two parts. The first part is
priors,
![]() or
or
![]() , multiplied by their corresponding weights summarized in the
matrix
, multiplied by their corresponding weights summarized in the
matrix
![]() . The second part is the new
signal,
. The second part is the new
signal, ![]() or
or ![]() , multiplied by
the Kalman gain
, multiplied by
the Kalman gain
![]() . Weights assigned to priors
and new signals (
. Weights assigned to priors
and new signals (![]() and
and ![]() ) depend
mainly on the relative variance of trend to cycle,
) depend
mainly on the relative variance of trend to cycle,
![]() . For example, in an
extreme case where
. For example, in an
extreme case where
![]() , the agent would optimally
attribute all of the fluctuations in the signal
, the agent would optimally
attribute all of the fluctuations in the signal ![]() to trend shocks. This would imply that posterior beliefs
of
to trend shocks. This would imply that posterior beliefs
of ![]() and
and ![]() (the first
two elements of
(the first
two elements of
![]() ) would be inelastic with
respect to fluctuations in
) would be inelastic with
respect to fluctuations in ![]() . In other words,
. In other words,
![]() and
and ![]() would
be small, whereas
would
be small, whereas ![]() and the weights
assigned to the priors of
and the weights
assigned to the priors of ![]() and
and ![]() (
(![]() and
and ![]() )
would be large.20
)
would be large.20
4 Quantitative Analysis
This section explains the calibration and estimation procedure of the parameters, documents the estimated parameters, and business cycle moments for both Mexico and Canada. In addition, for Mexico, it plots impulse response functions and explains in detail the implications of introducing imperfect information.
4.1 Emerging Market Business Cycles: Application to Mexico
We calibrate our model to quarterly Mexican data. We use a
combination of calibrated and estimated parameters. For ![]() ,
, ![]() ,
, ![]() ,
, ![]() ,
, ![]() ,
, ![]() , and
, and
![]() , we use values that are standard in
the literature (see e.g., Mendoza, 1991; AG; Schmitt-Grohé
and Uribe, 2003; Neumeyer and Perri, 2005). The parameter
, we use values that are standard in
the literature (see e.g., Mendoza, 1991; AG; Schmitt-Grohé
and Uribe, 2003; Neumeyer and Perri, 2005). The parameter
![]() is set to 0.36 which implies that
around one-third of agent's time is devoted to labor in the
steady-state. Note that the coefficient on the interest rate
premium is set to a small value, 0.001. The full set of calibrated
parameters is summarized in Table 2.
is set to 0.36 which implies that
around one-third of agent's time is devoted to labor in the
steady-state. Note that the coefficient on the interest rate
premium is set to a small value, 0.001. The full set of calibrated
parameters is summarized in Table 2.
We set ![]() to the average growth rate of
output from the data and estimate the remaining structural
parameters,
to the average growth rate of
output from the data and estimate the remaining structural
parameters, ![]() ,
, ![]() ,
,
![]() ,
, ![]() , and
, and
![]() using a GMM estimation applied to the
imperfect information model.21 Our estimation, reported in Table
3, yields a
standard deviation of transitory component higher than the standard
deviation of the trend growth component. The autocorrelation
coefficients for both the trend growth and the transitory
components are close to 0.6. Next, we summarize our findings and
relate them to those in the literature.
using a GMM estimation applied to the
imperfect information model.21 Our estimation, reported in Table
3, yields a
standard deviation of transitory component higher than the standard
deviation of the trend growth component. The autocorrelation
coefficients for both the trend growth and the transitory
components are close to 0.6. Next, we summarize our findings and
relate them to those in the literature.
4.1.1 Business Cycle Moments
We solve our model using a first order approximation around the deterministic steady state following the "brute-force iterative procedure" proposed by Binder and Pesaran (1997).22 Table 4 compares the business cycle moments of the imperfect information model with Mexican data as well as with those of the benchmark perfect information model calibrated to AG's Mexico parameters. For comparison, we also calculate the moments of the perfect information model using the imperfect information model's parameters. We calculate all moments using simulated data series. Simulated data is HP-filtered with a smoothing parameter of 1600, the standard value for quarterly data.
Before examining the model with imperfect information, it is worth revisiting the dynamics of the benchmark model with perfect information. In the perfect information model, when there is a positive transitory shock to output, the representative agent increases her consumption but this increase is lower than the increase in output. Because the agent knows that the output will gradually decline back to its previous level, she saves a portion of the increase in output. This is the standard consumption-smoothing effect in the presence of transitory shocks. When the shock is permanent, however, i.e., there is a positive shock to trend growth rate, the agent observes an increase in output today but she also realizes that future output will be even higher. The agent's optimal response to such positive permanent shocks is to increase her consumption more than the increase in current output. When both shocks are present in such an environment with perfect information, whether the effects of trend growth shocks dominate the transitory shocks depends on the relative variance of each shock. With imperfect information, however, the model can generate permanent-like responses even with lower relative variability of permanent components as agents can assign certain probability of transitory shocks being permanent or vice versa.
The imperfect information model matches the key moments of the Mexican data very closely (Table 4). The ratio of consumption variability to income variability is 1.17, compared to 1.26 in the data. The correlation of net-export with output is -0.69, which compares quite well with the value of -0.75 in the data. The model also matches the other moments closely as illustrated in Table 4. The GMM estimation reveals a relative variability of 0.78 suggesting that the imperfect information model matches the data without a predominance of trend growth shocks. With this parametrization, the detrended output is less volatile than in the data, which also implies a higher relative variability of investment and the trade balance compared to the data. This latter result might be due to the dampening of the shocks in models with imperfect information, also found by Boz (2007), among others.
The imperfect information model performs well with AG parameters, too. When those parameters are fed into the imperfect information model, the model can match key moments reasonably well as illustrated in the fourth column of Table 4. Therefore, the imperfect information model does not hinge on a specific value for relative variability of trend shocks as we explain further below.
In contrast, the perfect information model requires strong
predominance of permanent shocks. AG estimate a variability for
trend growth shocks of 2.55 percent and a variability for
transitory shocks of 0.54 percent, which implies a relative
variance of trend shock,
![]() , of 4.02. To illustrate
the resulting implications of the perfect information model when
permanent shocks are not predominant, we also report in the last
column of Table 4 the moments of
this model using the imperfect information model's parametrization.
When permanent shocks are not predominant, the perfect information
model implies a consumption variability less than that of output
and procyclical net-exports, which is clearly at odds with the
empirical moments. Also, the correlation of output with consumption
and investment is significantly smaller than in the data.
, of 4.02. To illustrate
the resulting implications of the perfect information model when
permanent shocks are not predominant, we also report in the last
column of Table 4 the moments of
this model using the imperfect information model's parametrization.
When permanent shocks are not predominant, the perfect information
model implies a consumption variability less than that of output
and procyclical net-exports, which is clearly at odds with the
empirical moments. Also, the correlation of output with consumption
and investment is significantly smaller than in the data.
4.1.2 Impulse Response Functions
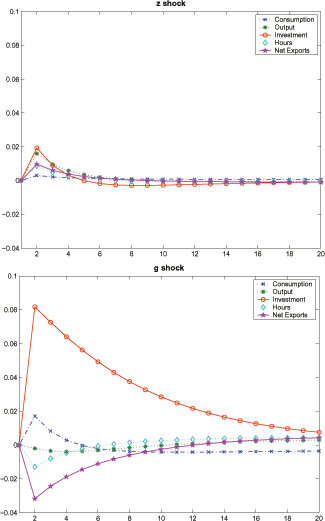
Figure 3 plots the impulse response functions to 1-percent shocks to transitory as well as permanent components of TFP in the perfect information model. With a 1-percent transitory shock, as illustrated by the first panel, the model displays consumption smoothing: taking into account that output would gradually move back to its initial value, the agent saves a portion of the current increase in output; hence, consumption increases less than output and net exports becomes positive. When the economy is hit by a 1-percent permanent shock as illustrated in the second panel, however, consumption increases more than output and net export becomes significantly negative.
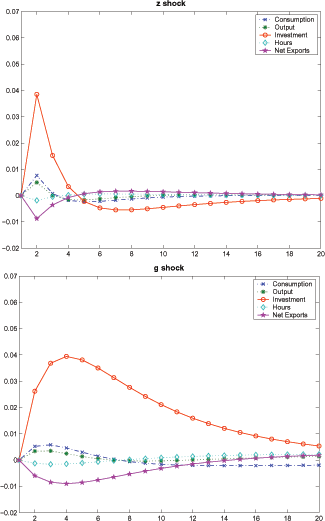
Figure 4 plots the response of the imperfect information model to transitory and permanent shocks. In response to a 1-percent transitory shock (top panel), the model displays "permanent-like" responses: consumption increases more than output; net export declines significantly. In response to a 1-percent permanent shock (bottom panel), the model again displays permanent-like responses: consumption responds more than output; net-export declines significantly. Even though imperfect information dampens the response of all variables, for the case of transitory shocks, there is an amplification effect, driven by the fact that the agent assigns a positive probability to the event that the shock might be permanent and, therefore, increases investment and consumption by more than in the perfect information case. In addition, comparing the perfect information model impulse responses depicted in Figure 3 to those of imperfect information model, learning introduces persistence.
To illustrate the learning dynamics implied by the model, we
plot beliefs for permanent and transitory components along with TFP
in Figure 5.
The crossed solid line depicts TFP, the diamond-dashed line plots
the evolution of the belief about the permanent component, while
the star-dashed line represents the evolution of the belief for the
transitory component. In the top panel, the source of fluctuations
in TFP is a 1-percent transitory component shock, whereas in the
bottom panel, it is a trend shock of the same magnitude. In the
first panel, interestingly, TFP shock turns negative after the
initial positive shock. This is in fact intuitive. Rewriting
Equation (7), we
have:
![]() . Thus,
. Thus,
![]() is zero as only the transitory component
is shocked in the first panel, while
is zero as only the transitory component
is shocked in the first panel, while ![]() increases
by 1-percent on impact and
increases
by 1-percent on impact and ![]() because we
start from the steady state. As the shock dies out after the first
period,
because we
start from the steady state. As the shock dies out after the first
period,
![]() becomes smaller than
becomes smaller than
![]() implying a negative value for
implying a negative value for
![]() . With
. With
![]() and
and ![]() , we
have
, we
have
![]() turning negative after the
initial period as depicted in the top panel of Figure 5.
turning negative after the
initial period as depicted in the top panel of Figure 5.
The Kalman Filter assigns slightly higher probability to trend component. This appears counterintuitive considering that the cycle component is more volatile than trend according to our GMM estimations of the imperfect information model. However, the experiment explained next clarifies the intuition for this finding.
We simulate a case where both 1% permanent shock
and 1% transitory shock are given at the same
time to perfect and imperfect information economies. Table 5 documents the
true values of shocks in perfect information case and the beliefs
calculated by the agent in imperfect information case. As expected,
under perfect information, the shocks are 1 % each for ![]() and
and ![]() leading to 1.68 % growth in TFP,
given that
leading to 1.68 % growth in TFP,
given that
![]() . Under imperfect information,
however, while decomposing TFP between
. Under imperfect information,
however, while decomposing TFP between ![]() and
and
![]() , the agent assigns
, the agent assigns ![]() to
to
![]() ,
, ![]() to
to
![]() , and
, and ![]() to
to
![]() . In other words, the
agent, using the Kalman filter, increases
. In other words, the
agent, using the Kalman filter, increases
![]() while decreasing
while decreasing
![]() , part of the increase in
, part of the increase in
![]() coming from an update
of
coming from an update
of
![]() . This leads to the
increase in
. This leads to the
increase in
![]() to be larger than
to be larger than
![]() inducing a dampening of the
contemporaneous cyclical component in imperfect information model.
Considering that the policy decisions of time
inducing a dampening of the
contemporaneous cyclical component in imperfect information model.
Considering that the policy decisions of time ![]() are already executed at the time when the signal
are already executed at the time when the signal
![]() arrives, the reduction in
arrives, the reduction in
![]() does not impact the
imperfect information model's long run moments directly. However,
as mentioned earlier, the reduction in
does not impact the
imperfect information model's long run moments directly. However,
as mentioned earlier, the reduction in
![]() allows the agent to
increase
allows the agent to
increase
![]() by increasing
by increasing
![]() by a smaller amount than she
would otherwise under perfect information scenario. This has a
significant impact on the long run moments because it induces the
agent to give more weight to permanent shocks relative to
transitory in the imperfect information model. Moreover, note that
both
by a smaller amount than she
would otherwise under perfect information scenario. This has a
significant impact on the long run moments because it induces the
agent to give more weight to permanent shocks relative to
transitory in the imperfect information model. Moreover, note that
both
![]() and
and
![]() under imperfect information
are lower than
under imperfect information
are lower than ![]() and
and ![]() under
perfect information. This leads to a dampening in the overall
volatilities in imperfect information setting as evident in perfect
information setting predicting higher output variability (3.21 vs
2.18, Table 4)
compared to imperfect information scenario using GMM estimated
parameters of the imperfect information model.
under
perfect information. This leads to a dampening in the overall
volatilities in imperfect information setting as evident in perfect
information setting predicting higher output variability (3.21 vs
2.18, Table 4)
compared to imperfect information scenario using GMM estimated
parameters of the imperfect information model.
The revision of
![]() in case of a positive
shock at time
in case of a positive
shock at time ![]() is downwards. This is because the
agent assigns positive probability to a scenario with a negative
transitory shock in period
is downwards. This is because the
agent assigns positive probability to a scenario with a negative
transitory shock in period ![]() . A close
investigation of the top panel of Figure 5 reveals that for
example in the case of a positive transitory shock in period 1,
. A close
investigation of the top panel of Figure 5 reveals that for
example in the case of a positive transitory shock in period 1,
![]() increases in
period 1 with unchanged
increases in
period 1 with unchanged ![]() and
and ![]() . However, starting with the second period,
. However, starting with the second period, ![]() turns negative with
turns negative with
![]() as the shock dies out
gradually. The mirror image of these dynamics occur in the case of
a negative shock. Going back to Table 5, observing a
positive signal in period
as the shock dies out
gradually. The mirror image of these dynamics occur in the case of
a negative shock. Going back to Table 5, observing a
positive signal in period ![]() , the agent
realizes that a positive transitory or permanent shock might have
hit at time
, the agent
realizes that a positive transitory or permanent shock might have
hit at time ![]() , or a negative transitory shock might
have hit in period
, or a negative transitory shock might
have hit in period ![]() and
and ![]() went up in period
went up in period ![]() as this negative
shock dies out. Assigning some probability to each of these
scenarios, the agent increases her belief about
as this negative
shock dies out. Assigning some probability to each of these
scenarios, the agent increases her belief about ![]() ,
, ![]() , and reduces the one about
, and reduces the one about
![]() .
.
4.1.3 Sensitivity Analysis on the Relative Variability of Trend Shocks
Figure 6
shows how key moments change as we change the relative variability
of the trend shocks,
![]() , while keeping the other
parameters constant. As the first panel illustrates, as long as the
relative variability of the permanent component relative to the
transitory component is higher than approximately 0.7, the model
can generate a higher consumption variability relative to output
variability. In order for the model to match counter-cyclicality of
the trade balance, the relative variability of trend shocks needs
to be less than 2. Hence, the imperfect information model can match
these two key moments with
, while keeping the other
parameters constant. As the first panel illustrates, as long as the
relative variability of the permanent component relative to the
transitory component is higher than approximately 0.7, the model
can generate a higher consumption variability relative to output
variability. In order for the model to match counter-cyclicality of
the trade balance, the relative variability of trend shocks needs
to be less than 2. Hence, the imperfect information model can match
these two key moments with
![]() in 0.7 to 2 range,
considering
in 0.7 to 2 range,
considering
![]() . However, this does not imply
that the imperfect information model requires a
. However, this does not imply
that the imperfect information model requires a
![]() in the range of
in the range of
![]() . Our analysis suggests that once we
allow the other estimated parameters (
. Our analysis suggests that once we
allow the other estimated parameters (![]() ,
,
![]() ,
, ![]() ) to change, the
imperfect information model is able to match the data fairly
closely for a wide range of values for
) to change, the
imperfect information model is able to match the data fairly
closely for a wide range of values for
![]() .23
.23
The ability of the imperfect information model to match the key
moments (
![]() and
and
![]() ) for a wide range of relative
variability of trend shocks is evident in Figure 7. The top panel
of this figure plots
) for a wide range of relative
variability of trend shocks is evident in Figure 7. The top panel
of this figure plots
![]() for different values of
relative variability of trend shocks (y-axis) and
for different values of
relative variability of trend shocks (y-axis) and ![]() (x-axis).24 We keep the remaining parameters (
(x-axis).24 We keep the remaining parameters (
![]() ) at their original values
from the baseline parametrization of imperfect information model.
Similarly, the bottom panel shows
) at their original values
from the baseline parametrization of imperfect information model.
Similarly, the bottom panel shows
![]() for the same sets of parameters.
The top panel suggests that, in general,
for the same sets of parameters.
The top panel suggests that, in general,
![]() increases with the
relative variability of trend shocks and
increases with the
relative variability of trend shocks and ![]() .
.
![]() of 1.26 observed in the
data can be matched with
of 1.26 observed in the
data can be matched with
![]() . That is, the model can match this moment with higher relative
variability of trend shocks if one allows for lower
. That is, the model can match this moment with higher relative
variability of trend shocks if one allows for lower ![]() . Similarly, the correlation between output and net
exports,
. Similarly, the correlation between output and net
exports,
![]() of
of ![]() , in the
data is implied by the imperfect information model for
, in the
data is implied by the imperfect information model for
![]()
![]() ,
,
![]() . Likewise, the model
can match this moment with several values for relative variability
of trend shocks and
. Likewise, the model
can match this moment with several values for relative variability
of trend shocks and ![]() combinations if lower
combinations if lower
![]() 's are combined with higher relative
variability of trend shocks.
's are combined with higher relative
variability of trend shocks.
Figure 8 displays the
results of the same exercise for the perfect information model with
AG parametrization. The perfect information model is able to
generate
![]() and
and
![]() that are similar to those in the
data only with high variability for trend component and low
that are similar to those in the
data only with high variability for trend component and low
![]() . In this model,
. In this model,
![]() monotonically increases
with relative variability of trend shocks. However, with respect to
monotonically increases
with relative variability of trend shocks. However, with respect to
![]() , it does not display a monotonic
relationship. It generates
, it does not display a monotonic
relationship. It generates
![]() when relative
variability of trend shocks is greater than 3.5 with
when relative
variability of trend shocks is greater than 3.5 with ![]() , and when relative variability of trend shocks is
greater than around 2 for higher values of
, and when relative variability of trend shocks is
greater than around 2 for higher values of ![]() .
For the perfect information model to predict
.
For the perfect information model to predict
![]() ,
, ![]() needs
to be lower than 0.6, and for it to reach the levels of
countercyclicality in the data (lower than
needs
to be lower than 0.6, and for it to reach the levels of
countercyclicality in the data (lower than ![]() ),
),
![]() has to be in the close neighborhood
of zero and relative variability of trend shocks needs to be higher
than 2.5.
has to be in the close neighborhood
of zero and relative variability of trend shocks needs to be higher
than 2.5.
Summing up, so far our results show the ability of the imperfect information model to match the business cycle fluctuations in emerging market countries for a large range of key parameter values. Motivated by the observation that there is greater degree of uncertainty faced in emerging markets compared to developed economies, a model that incorporates learning problem regarding the decomposition of TFP to its components performs remarkably well. To illustrate the importance of this layer of uncertainty that distinguishes emerging market economies from their developed counterparts, we next revisit the implications of the perfect information model for an developed economy business cycles, Canada.
4.2 Developed Economy Business Cycles: Application to Canada
Next, we revisit the perfect information model calibrated to match Canadian business cycles. Calibrated parameters, estimation and solution methods are the same as those used for Mexico. Estimated parameters are summarized in Table 6. These parameters are similar to those documented by AG. Notice that the implied relative variability of the trend shock is 0.78, which is similar to the corresponding value in the imperfect information model calibrated to match Mexican business cycles. As Table 7 illustrates, with these estimated parameters, perfect information model matches Canadian business cycles closely. Thus, an important result that our analysis conveys is that simply introducing an additional layer of uncertainty can explain the observed differences in the business cycles of developed and emerging market economies remarkably well without reliance on differences in relative variance of trend shocks.
5 Conclusion
In this paper, we explained the differences in key business cycle characteristics of developed and emerging market economies based on differences in the information available to the agents. In the emerging market economy, agents are imperfectly informed about the trend-cycle decomposition of productivity shocks, and they solve a learning problem using the Kalman Filter to estimate the components of the TFP. In the developed economy, however, we assume that agents are fully informed about this decomposition based on our empirical findings. In particular, large errors in Consensus Forecasts for real GDP growth in emerging markets relative to their developed counterparts suggest that emerging market countries differ significantly in the degree of uncertainty faced by agents when formulating expectations.
We estimated both models using GMM and showed that the imperfect information model can generate higher volatility of consumption relative to output and strongly counter-cyclical trade balance without reliance on higher variability of trend shocks. In fact, the implied relative variability of trend shocks across these models are similar. This result is consistent with our empirical analysis based on data from 21 developed and 25 emerging market countries which suggests that emerging market countries do not differ from their developed counterparts in this respect confirming the relevance of our theoretical findings.
The mechanism that drives the results in the imperfect information model relies on the learning dynamics. While formulating expectations, the Kalman Filter decomposes the beliefs into trend growth shocks and changes in level of cyclical shocks. For example, considering a positive signal, while updating the beliefs about the changes in the level of the cyclical shock, agents increase the value of their beliefs about the contemporaneous component whereas revising their beliefs about the first lag downward (i.e., part of the increase in changes comes from an increase in contemporaneous component and the remaining part is due to a backward revision of the first lag). Therefore, the learning mechanism dampens the effect of cycle shocks relative to the trend. In addition, permanent shocks have stronger effects on policy decisions compared to the transitory ones. Hence, a slightly higher probability assigned to the trend component relative to the contemporaneous cycle component is sufficient for the imperfect information model to produce "permanent-like" responses. Our results also showed that the imperfect information model can account for stylized facts for a wide range of relative variability of trend shocks to transitory, including those less than one.
Our analysis underscores the uncertainty regarding the decomposition of TFP into its trend-cycle components in explaining the differences between emerging market and developed economy real business cycles. We showed that explicitly modeling this friction improves business cycle models' ability to explain fluctuations in emerging markets significantly. In particular, with those frictions in place, the model can generate the key features of emerging market business cycles for a wide range of relative variability of trend shocks.
Appendix
A.1 TFP computation
Assume that output (![]() ) can be represented by
the following Cobb-Douglas production function:
) can be represented by
the following Cobb-Douglas production function:
where ![]() is the capital stock,
is the capital stock, ![]() is labor which is augmented its relative efficiency due
to schooling (
is labor which is augmented its relative efficiency due
to schooling (![]() ), and
), and ![]() is TFP.
is TFP.
For capital, we use annual investment data from the Penn World Tables, version 6.2. The capital stock series are constructed via the perpetual inventory approach following Easterly and Levine (2001). In particular, the law of motion for the capital stock is given by:
where ![]() denotes investment and the rate of
depreciation of the capital stock which is set to 0.07. In steady
state, the initial capital-output ratio is:
denotes investment and the rate of
depreciation of the capital stock which is set to 0.07. In steady
state, the initial capital-output ratio is:
 |
where ![]() is the steady state investment-output
ratio and
is the steady state investment-output
ratio and ![]() the steady state growth rate. In order
to calibrate
the steady state growth rate. In order
to calibrate ![]() , we approximate
, we approximate ![]() by the country's average investment-output ratio in the first ten
years of the sample and
by the country's average investment-output ratio in the first ten
years of the sample and ![]() by a weighted average
between world growth (75%) and the country's average growth in the
first ten years of the sample. The initial capital level
by a weighted average
between world growth (75%) and the country's average growth in the
first ten years of the sample. The initial capital level
![]() is obtained by multiplying the
three-year average output at the beginning of the sample.
is obtained by multiplying the
three-year average output at the beginning of the sample.
For labor, we use the labor force implied by the real GDP per
worker and real GDP (chain) series from the Penn World Tables. To
calibrate human capital ![]() , we follow Hall and Jones
(1999) and consider
, we follow Hall and Jones
(1999) and consider ![]() to be the relative
efficiency of a unit of labor with
to be the relative
efficiency of a unit of labor with ![]() years of
schooling. In particular,
years of
schooling. In particular, ![]() is constructed
by:
is constructed
by:
where
![]() is a function that maps the
years of schooling into efficiency of labor with
is a function that maps the
years of schooling into efficiency of labor with
![]() and
and
![]() equal to the Mincerian return to
schooling. We assume the same rates of return to schooling for all
countries: 13.4% for the first four years, 10.1% for the next four,
and 6.8% for all years of schooling above eight years (following
Psacharopoulos, 1994). The data on years of schooling is obtained
from the Barro-Lee database and linear extrapolations are used to
complete the five-year data.
equal to the Mincerian return to
schooling. We assume the same rates of return to schooling for all
countries: 13.4% for the first four years, 10.1% for the next four,
and 6.8% for all years of schooling above eight years (following
Psacharopoulos, 1994). The data on years of schooling is obtained
from the Barro-Lee database and linear extrapolations are used to
complete the five-year data.
Output per worker is given by:
|
Taking logs and reorganizing terms yields:
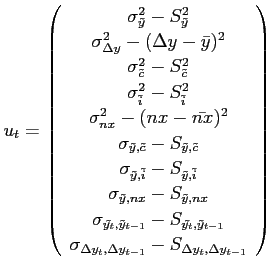
A.2 GMM Estimation
This subsection presents the GMM moment conditions and
procedures used in our estimations. The estimated structural
parameters are
![]() . In terms of
notation, all lower-case variables are in logs and
. In terms of
notation, all lower-case variables are in logs and ![]() refers to the Hodrick-Prescott filtered series of
refers to the Hodrick-Prescott filtered series of
![]() . Net exports,
. Net exports, ![]() , is
expressed as a fraction of output. Furthermore,
, is
expressed as a fraction of output. Furthermore, ![]() refers to the theoretical variance-covariance terms,
while
refers to the theoretical variance-covariance terms,
while ![]() refers to the moments in the data. The
moments conditions are given by:
refers to the moments in the data. The
moments conditions are given by:
|
Let ![]() be the sample mean of
be the sample mean of ![]() and
and
![]() , with
, with ![]() being a symmetric positive definite weighting matrix. The
GMM estimate of
being a symmetric positive definite weighting matrix. The
GMM estimate of ![]() is given by the vector that
minimizes
is given by the vector that
minimizes ![]() . The matrix
. The matrix ![]() is estimated using the two-step procedure outlined by Burnside
(1999).
is estimated using the two-step procedure outlined by Burnside
(1999).
References
Aguiar, Mark and Gita Gopinath, 2007, "Emerging Market Business Cycles: The Cycle is the Trend," Journal of Political Economy, Vol. 115(1), pp. 69-102.
Binder, Michael and M. Hashem Pesaran, 1997, "Multivariate Linear Rational Expectations Models: Characterization of the Nature of the Solution and Their Fully Recursive Computation," Econometric Theory, Vol. 13, pp. 877-888.
Blyde, Juan, Christian Daude and Eduardo Fernandez-Arias, 2007. "Output Collapses and Total Factor Productivity Destruction," mimeo, Inter-American Development Bank.
Boz, Emine, 2007, "Can Miracles Lead to Crises? The Role of Optimism in Emerging Market Crises," IMF Working Paper No. 07/223.
Burnside, Craig, 1999, "Real Business Cycle Models: Linear Approximation and GMM Estimation," manuscript, The World Bank, May.
Cochrane, John, 1988, "How Big is the Random Walk in GNP?,"Journal of Political Economy, 96, pp. 893-920.
Easterly, William and Ross Levine, 2001, "It's Not Factor Accumulation: Stylized Facts and Growth Models," World Bank Economic Review, Vol. 15, No. 2.
Edge, Rochelle M., Thomas Laubach, and John C. Williams, 2007, "Learning and Shifts in Long-Run Productivity Growth," Journal of Monetary Economics, forthcoming.
Evans, George W. and Seppo Honkapohja, 1999. "Chapter 7 Learning Dynamics" in Kenneth J. Arrow and Michael D. Intriligator (editors), Handbook of Marcoeconomics, North-Holland, pp. 449-542.
Garcia-Cicco, Javier, Roberto Pancrazzi and Martin Uribe, 2006, "Real Business Cycles in Emerging Countries?," NBER Working paper No. 12629.
Guerrieri, Luca, Dale Henderson, and Jinill Kim, 2005. "Investment-Specific and Multifactor Productivity in Multi-sector Open Economies: Data and Analysis," International Finance Discussion Papers No. 828, Board of Governors of the Federal Reserve System.
Hall, Robert E. and Charles I. Jones, 1999, "Why Do Some Countries Produce So Much More Output Per Worker Than Others?," Quarterly Journal of Economics, Vol. 114, No. 1, pp. 83-116.
Harvey, Andrew C., 1989, Forecasting, Structural Time Series Models and the Kalman Filter, Cambridge: Cambridge University Press.
Jaimovich, Nir and Sergio Rebelo, 2006, "Can News About the Future Drive the Business Cycle?," NBER Working paper No. 12537.
Kalman, R. E., 1960, "A New Approach to Linear Filtering and Prediction Problems," Journal of Basic Engineering, Transactions ASME Series D, Vol. 82, pp. 35-45.
Lorenzoni, Guido, 2006,"A Theory of Demand Shocks," NBER Working paper No. 12477.
Mendoza, Enrique G., 1991, "Real Business Cycles in a Small Open Economy," American Economic Review, Vol. 81, pp. 797-818, September.
Mendoza, Enrique and Katherine A. Smith, 2006, "Quantitative Implications of a Debt-Deflation Theory of Sudden Stops and Asset Prices," Journal of International Economics.
Neumeyer, Pablo A. and Fabrizio Perri, 2005, "Business Cycles in Emerging Economies: the Role of Interest Rates," Journal of Monetary Economics, Vol. 52, pp. 345-380.
Nieuwerburgh, Stijn and Laura Veldkamp, 2006, "Learning Asymmetries in Real Business Cycles," Journal of Monetary Economics, Vol.53(4) pp. 753-772.
Obstfeld, Maurice and Kenneth Rogoff, 1996, Foundations of International Macroeconomics, Cambridge: MIT University Press.
Oviedo, Marcelo, 2005, "The World Interest Rate, Business Cycles, and Financial Intermediation in Small Open Economies," mimeo.
Psacharopoulos, George, 1994, "Returns to Investment in Education: A Global Update," World Development, Vol. 22, pp. 1325-1343.
Schmitt-Grohé, Stephanie and Martin Uribe, 2003, "Closing Small Open Economy Models," Journal of International Economics, Vol. 61, pp. 163-185.
Timmermann, Allan, 2006, "An Evaluation of the World Economic Outlook Forecasts," IMF Working Paper WP/06/59.
Uribe, Martin and Vivian Z. Yue, 2006. "Country Spreads and Emerging Countries: Who Drives Whom?," Journal of International Economics, Vol. 69, pp. 6-36.
Figure 1: Relative Variance of Random Walk Component
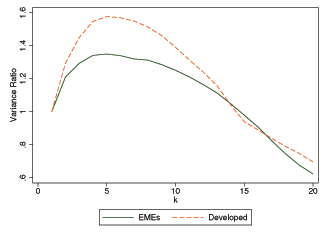
Figure 2: Densities of the Relative Variances of the Random Walk Component
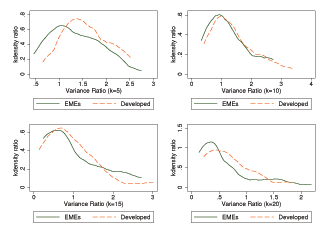
Figure 3: Impulse Responses in the Perfect Information Model
Note: This figure illustrates the response of the endogenous variables to a 1-percent shock to the transitory (top panel) vs. trend growth component (bottom panel) of the TFP.
Figure 4: Impulse Responses in the Imperfect Information Model
Note: This figure illustrates the response of the endogenous variables to a 1-percent shock to the transitory (top panel) vs. trend growth component (bottom panel) of the TFP.
Figure 5: Beliefs Attached to TFP Components
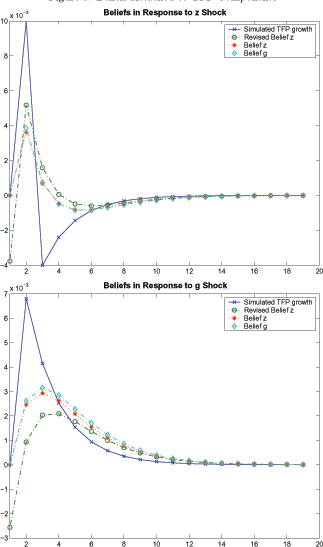
Figure 6: Sensitivity of Moments to the Relative Variability of Trend Shocks Ratios
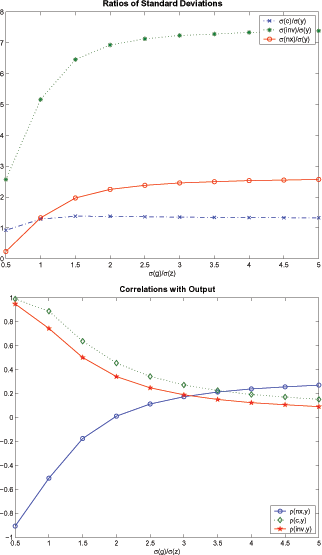
Figure 7: Imperfect
Information Model Moments with Different
![]() and
and ![]() 's
's
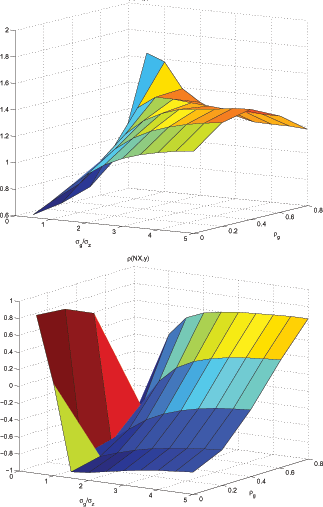
Figure 8: Perfect
Information Model Moments with Different
![]() and
and ![]() 's
's
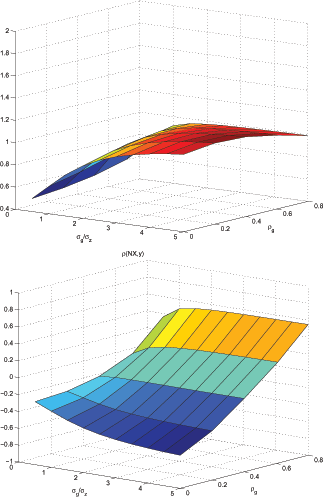
Table 1: Moments of Forecast Errors in EMEs vs. Developed Economies - Panel A: Developed Countries
| Country | No. of observations | Mean | Std | corr (et + 1, t , et, t - 1) |
|---|---|---|---|---|
| Australia | 33 | -0.01 | 0.87 | 0.27 |
| Denmark | 23 | 0.11 | 0.94 | 0.22 |
| Finland | 11 | 0.35* | 0.60 | -0.41 |
| France | 25 | -0.02 | 0.30 | -0.35 |
| Italy | 18 | -0.11 | 0.38 | -0.02 |
| Netherlands | 16 | -0.02 | 0.36 | 0.32 |
| Spain | 20 | 0.04 | 0.15 | -0.13 |
| Switzerland | 14 | 0.14 | 0.44 | 0.08 |
| United Kingdom | 36 | 0.05* | 0.13 | 0.01 |
| Average | 21.78 |
0.06 |
0.46 |
0.00 |
Table 1: Moments of Forecast Errors in EMEs vs. Developed Economies - Panel B: EMEs
| Country | No. of observations | Mean | Std | corr (et + 1, t , et, t - 1) |
|---|---|---|---|---|
| Argentina | 26 | -0.57 | 2.23 | 0.57* |
| Brazil | 28 | -0.28* | 0.83 | 0.06 |
| Chile | 14 | 0.10 | 0.28 | 0.21 |
| China | 21 | 0.30* | 0.55 | -0.33 |
| Colombia | 17 | 0.23 | 0.87 | 0.03 |
| India | 21 | 0.30 | 0.85 | 0.06 |
| Indonesia | 20 | 0.18* | 0.43 | 0.18 |
| Hong Kong | 26 | 0.70* | 0.80 | -0.16 |
| Korea | 23 | 0.23 | 0.86 | -0.10 |
| Malaysia | 28 | 0.44 | 2.74 | 0.04 |
| Mexico | 33 | 0.05 | 0.59 | 0.31* |
| Peru | 61 | 0.43* | 1.45 | -0.13 |
| Philippines | 17 | -0.35* | 0.65 | -0.13 |
| Singapore | 18 | -0.37* | 0.46 | -0.21 |
| South Africa | 23 | -0.01 | 0.80 | 0.28 |
| Taiwan | 22 | -0.16 | 0.86 | 0.21 |
| Thailand | 18 | -0.19* | 0.42 | 0.16 |
| Turkey | 28 | -0.13 | 3.12 | 0.10 |
| Average | 24.67 |
0.05 |
1.04 |
0.06 |
Source: Bloomberg. * Significantly different from 0 at 10% level.
Table 2: Calibrated Parameters
β |
Discount factor | 0.98 |
γ |
Consumption exponent of utility | 0.36 |
b |
Steady state normalized debt | 10 |
ψ |
Coefficient on interest rate premium | 0.001 |
α |
Labor exponent | 0.68 |
σ |
Risk aversion | 2 |
δ |
Depreciation rate | 0.05 |
Table 3: Estimated Parameters of the Imperfect Information Model for Mexico
σg |
Stdev of permanent component noise | 1.06 (0.00) |
σz |
Stdev of transitory component noise | 1.35 (0.00) |
ρg |
Persistence of permanent component | 0.61 (0.02) |
ρz |
Persistence of transitory component | 0.60 (0.03) |
| Capital adjustment cost | 1.27 (0.03) |
|
μg |
Growth rate | 0.66 |
σg / σz |
Relative variance of trend shocks | 0.78 |
Note: This table summarizes the parameter estimates calculated using generalized method of moments. The moment conditions are provided in the Appendix. The numbers in parentheses are standard errors in percent.
Table 4: Business Cycle Moments for Mexico
Moments |
Data |
AG |
GMM with II |
II with AG |
PI with II param |
|---|---|---|---|---|---|
σ(y) |
2.40 |
2.13 |
2.18 |
1.46 |
3.21 |
σ(Δy) |
1.52 |
1.42 |
1.55 |
1.33 |
2.68 |
σ(c) / σ(y) |
1.26 |
1.10 |
1.17 |
1.17 |
0.75 |
σ(I) / σ(y) |
4.15 |
3.83 |
4.17 |
6.74 |
3.71 |
σ(NX) / σ(y) |
0.90 |
0.95 |
0.89 |
1.44 |
1.31 |
ρ(y) |
0.83 |
0.82 |
0.77 |
0.66 |
0.68 |
ρ(Δy) |
0.27 |
0.18 |
0.27 |
0.04 |
0.10 |
ρ(y, NX) |
-0.75 |
-0.50 |
-0.69 |
-0.69 |
0.38 |
ρ(y, c) |
0.92 |
0.91 |
0.97 |
0.95 |
0.44 |
ρ(y, I) |
0.91 |
0.80 |
0.85 |
0.83 |
0.31 |
Notes: Moments are calculated using the simulated and HP-filtered data generated by the corresponding model. AG refers to the perfect information model using the parameter values from Aguiar and Gopinath (2007), II refers to the imperfect information model. The column "II with AG param" refers to the imperfect information model using AG parameters, while the column 'PI with II param' reports the moments of the perfect information setup generated using the estimated parameters of the imperfect information setup.
Table 5: Perfect vs Imperfect Information
| Model | ||||
| PI | 1.68 % | 1 % | 1 % | 0 % |
|---|---|---|---|---|
| II | 1.68 % | 0.65 % | 0.60 % | -0.63 % |
Note:
![]() ,
,
![]() , and
, and
![]() are equal to their true values in the perfect information case.
are equal to their true values in the perfect information case.
Table 6: Estimated Parameters of the Perfect Information Model for Canada
σg |
Stdev of permanent component noise | 0.52 (0.00) |
σz |
Stdev of transitory component noise | 0.67 (0.00) |
ρg |
Persistence of permanent component | 0.33 (0.01) |
ρz |
Persistence of transitory component | 0.96 (0.02) |
| Capital adjustment cost | 2.15 (0.03) |
|
μg |
Growth rate | 0.73 |
σg / σz |
Relative variance of trend shocks | 0.78 |
Notes: This table summarizes the parameter estimates calculated using generalized method of moments to match Canadian business cycles. The numbers in parentheses are standard errors in percent.
Table 7: Business Cycle Moments for Canada
Moments | Data | Model |
|---|---|---|
σ(y) | 1.55 | 1.29 |
σ(Δy) | 0.80 | 0.92 |
σ(c) / σ(y) | 0.74 | 0.71 |
σ(I) / σ(y) | 2.67 | 3.72 |
σ(NX) / σ(y) | 0.57 | 0.68 |
ρ(y) | 0.93 | 0.76 |
ρ(Δy) | 0.55 | 0.23 |
ρ(y, NX) | -0.12 | -0.13 |
ρ(y, c) | 0.87 | 0.83 |
ρ(y, I) | 0.74 | 0.83 |
Footnotes
* We would like to thank Eduardo Fernandez-Arias, Luca Guerrieri, Dale Handerson, Nan Li, Ben Malin, Enrique Mendoza, Marcelo Oviedo, Andrea Raffo, Stephanie Schmitt-Grohè, Martín Uribe, Laura Veldkamp, and Rob Vigfusson, as well as the seminar participants of Duke, the Federal Reserve Board, Ohio State, and the Society for Computational Economics Meetings in Montreal. Paul S. Eitelman provided excellent research assistance. All remaining errors are exclusively our responsibility. Correspondence: [email protected], [email protected], [email protected]. Return to text
† The views expressed in this paper are those of the authors and should not be attributed to the International Monetary Fund, the Inter-American Development Bank, or the Board of Governors of the Federal Reserve System. Return to text
1. It has been shown by Kalman (1960) that this filter is the optimal linear predictor in our setup, which resembles the assumption of rationality in the sense that the agent makes the most efficient use of the information available. Return to text
2. An early contribution in this literature includes Mendoza (1991), who provides a workhorse real business cycle model for small open economies. Mendoza's model calibrated to Canada proves successful in explaining the observed persistence and variability of output fluctuations as well as counter-cyclicality of trade balance. Return to text
3. The intuition for this result relies on the response of the current account to permanent changes in income, (see e.g., Chapter 2 in Obstfeld and Rogoff, 1996) which, has its roots in the permanent-income theory of consumption. If faced with a positive trend growth shock to output, the agent increases her consumption by more than the increase in current output since she expects an even higher output in the following period. This mechanism generates a consumption profile that is more volatile than output and also a trade balance deficit in response to a positive trend growth shock for the agent to finance a consumption level above output. Return to text
4. Throughout the paper, we loosely use the terms "trend shocks" and "cycle shocks" to refer to the trend growth shocks and the transitory shocks, respectively. Return to text
5. See AG page 84: "...Furthermore, the standard errors are large, and accordingly there is limited power in distinguishing between the random walk components of the two series. In short, a univariate approach to this issue is bound to be inconclusive..." Return to text
6. See also Uribe and Yue (2006), and Oviedo (2005) on this issue. Return to text
7. See Evans and Honkapohja (1999) for a comprehensive survey on the role of learning dynamics in macroeconomic models. Return to text
8. See also Guerrieri et. al., 2005 for an analysis of importance of learning in a multisector open economy model. Return to text
9. Developed countries include Australia, Austria, Belgium, Canada, Denmark, Finland, France, Greece, Ireland, Iceland, Italy, Japan, Netherlands, Norway, New Zealand, Portugal, Spain, Sweden, Switzerland, UK, USA. Emerging market countries include Algeria, Argentina, Brazil, Chile, Colombia, Costa Rica, Dominican Republic, Ecuador, El Salvador, India, Indonesia, Israel, Korea, Malaysia, Mexico, Pakistan, Panama, Peru, Philippines, South Africa, Thailand, Trinidad and Tobago, Turkey, Uruguay, and Venezuela. Return to text
10. See Appendix for more details on the construction of the TFP series. Return to text
11. While not reported here, using GDP data instead of TFP yield qualitatively similar results which are available upon request. Return to text
12. The GDP growth data are taken from Bloomberg and refer to quarterly year-on-year growth rates. We report only those countries for which we have at least 10 quarters of forecasts available. Return to text
13. More detailed results on the ARMA estimations are available upon request. Return to text
14. For both Argentina and Mexico, quarters of extreme collapses in output are not included due to lack of Consensus Forecast data. We conjecture the results would be much stronger in the case of Argentina, if the two quarters of 2002 where output collapsed at year-on-year rates greater than -10% were included in our sample. Consensus Forecasts are unavailable for these particular quarters, which per se is an indicative of the degree of uncertainty surrounding this kind of episodes. Return to text
15. Schmitt-Grohé and Uribe (2003) show that this is a useful way, although somewhat mechanical, to induce a well-defined stationary distribution of net foreign assets in small open economy models. Return to text
16. This follows directly from the fact
that the production function could be written alternatively as
![]() , where
, where
![]() . Return to text
. Return to text
17. The debt elastic interest rate premium is introduced so as to induce stationarity to the asset holdings in the stochastic steady state. Other formulations used in the literature for this purpose include Mendoza (1991)'s endogenous discounting, and Aiyagari (1994)'s preferences with the rate of time preference higher than the interest rate. Schmitt-Grohé and Uribe (2003) survey some of the alternative methods used for this purpose and concludes that quantitative differences among the approaches applied to linearized systems are negligible. Return to text
18. Note that AG normalize by
![]() . In our imperfect information
setting,
. In our imperfect information
setting,
![]() is not in the information set of
the agent.
is not in the information set of
the agent. ![]() and
and ![]() are
other plausible candidates for normalization as they grow at the
same rate as
are
other plausible candidates for normalization as they grow at the
same rate as ![]() and are in emerging market
representative agent's information set. We choose to normalize by
and are in emerging market
representative agent's information set. We choose to normalize by
![]() , but normalizing by
, but normalizing by ![]() would yield identical results. Return to text
would yield identical results. Return to text
19. See Harvey (1989) pp. 123 for a proof of this statement. Return to text
20. ![]() refers to
refers to
![]() row and
row and ![]() column
of matrix
column
of matrix ![]() . Return to
text
. Return to
text
21. See the appendix for more details, as well as Burnside (1999) for the description and application of the GMM methodology. Return to text
22. The log-linearized system is provided in an Appendix available upon request. See Binder and Pesaran (1997) for a detailed description of the solution method. Return to text
23. Comparing Figure 6 with Figure 4 of
AG, in both setups,
![]() increases with
increases with
![]() . However,
. However,
![]() increases with
increases with
![]() in the imperfect
information setup, whereas it decreases in the perfect information
model with AG parameters. Return to
text
in the imperfect
information setup, whereas it decreases in the perfect information
model with AG parameters. Return to
text
24. We conducted similar analysis by
allowing ![]() and
and ![]() to vary
along with the relative variability of trend shocks and found that
variation in those parameters do not change the relationship
between
to vary
along with the relative variability of trend shocks and found that
variation in those parameters do not change the relationship
between
![]() ,
,
![]() , and the relative variability of
trend shocks. In other words, regardless of
, and the relative variability of
trend shocks. In other words, regardless of ![]() and
and ![]() ,
,
![]() and
and
![]() increase with relative
variability of trend shocks. Simulations are available upon
request. Return to text
increase with relative
variability of trend shocks. Simulations are available upon
request. Return to text
This version is optimized for use by screen readers. Descriptions for all mathematical expressions are provided in LaTex format. A printable pdf version is available. Return to text