
Board of Governors of the Federal Reserve System
International Finance Discussion Papers
Number 1008, September 2010 --- Screen Reader
Version*
Entry Dynamics and the Decline in Exchange-Rate Pass-Through1
NOTE: International Finance Discussion Papers are preliminary materials circulated to stimulate discussion and critical comment. References in publications to International Finance Discussion Papers (other than an acknowledgment that the writer has had access to unpublished material) should be cleared with the author or authors. Recent IFDPs are available on the Web at http://www.federalreserve.gov/pubs/ifdp/. This paper can be downloaded without charge from the Social Science Research Network electronic library at http://www.ssrn.com/.
Abstract:
The degree of exchange-rate pass-through to import prices is low. An average pass-through estimate for the 1980s would be roughly 50 percent for the United States implying that, following a 10 percent depreciation of the dollar, a foreign exporter selling to the U.S. market would raise its price in the United States by 5 percent. Moreover, substantial evidence indicates that the degree of pass-through has since declined to about 30 percent.
Gust, Leduc, and Vigfusson (2010) demonstrate that, in the presence of pricing complementarity, trade integration spurred by lower costs for importers can account for a significant portion of the decline in pass-through. In our framework, pass-through declines solely because of markup adjustments along the intensive margin.
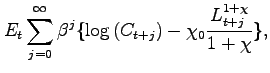
In this paper, we model how the entry and exit decisions of exporting firms affect pass-through. This is particularly important since the decline in pass-through has occurred as a greater concentration of foreign firms are exporting to the United States.
We find that the effect of entry on pass-through is quantitatively small and is more than offset by the adjustment of markups that arise only along the intensive margin. Even though entry has a relatively small impact on pass-through, it nevertheless plays an important role in accounting for the secular rise in imports relative to GDP. In particular, our model suggests that over 3/4 of the rise in the U.S. import share since the early 1980s is due to trade in new goods.
Thus, a key insight of this paper is that adjustment of markups that occur along the intensive margin are quantitatively more important in accounting for secular changes in pass-through than adjustments that occur along the extensive margin.
Keywords: Pass-through, trade integration, strategic complementarity, intensive margin
JEL classification: F15, F41
1 Introduction
It is well known that the degree of exchange-rate pass-through (pass-through herein) to import prices is low. The evidence surveyed in Goldberg and Knetter (1997) suggest that an average pass-through estimate for the 1980s would be roughly 50 percent for the United States, implying that, following a 10 percent depreciation of the dollar, a foreign exporter selling to the U.S. market would raise its price in the United States by 5 percent. Moreover, there is substantial evidence that the degree of pass-through to U.S. import prices has declined considerably since the early 1990s, to a level of about 30 percent.
In Gust, Leduc, and Vigfusson (2010), we attempt to explain these findings by demonstrating that, in the presence of pricing complementarity, trade integration spurred by lower tariffs, transport costs, and changes in relative productivities accounts for a significant portion of the decline in pass-through. In our framework, trade integration reduces pass-though because pricing complementarity induces an exporter to set a relatively high and variable markup when its costs are lower than its competitors and a low and unresponsive markup when its costs are relatively high. Pass-through thus declines solely because of markup adjustments along the intensive margin, as we abstracted from the entry and exit decisions of exporting firms.
In this paper, we instead examine how entry dynamics affect pass-through in the presence of declines in trade costs and changes in relative productivities across countries that help account for greater U.S. openness. This is particularly important since the decline in pass-through has occurred at a time when the U.S. economy has become increasingly open with a greater concentration of foreign firms exporting to the United States. Dornbusch (1987), for instance, shows that an increasing presence of foreign firms should reduce firms' pricing power in U.S. markets, result in less variable markups, and therefore put upward pressure on pass-through to import prices.
Once we extend our model to incorporate such a mechanism, we find that the effect of entry on pass-through is quantitatively small and is more than offset by the adjustment of markups that arise only along the intensive margin. Even though entry has a relatively small impact on pass-through, it nevertheless plays an important role in accounting for the secular rise in imports relative to GDP. In particular, our model suggests that over 3/4 of the rise in the U.S. import share since the early 1980s is due to trade in new goods. To have a more significant impact on pass-through, firms' entry in our framework would need to generate a much larger increase in the share of imports than is observed empirically. Thus, a key insight of this paper is that adjustment of markups that occur along the intensive margin are quantitatively more important in accounting for secular changes in pass-through than adjustments that occur along the extensive margin.
The paper is organized as follows. The next section presents evidence on the decline in pass-through in the United States, while Section 3 describes the time-series properties of trade costs and documents changes in productivities in different regions of the world. The model is described in Section 4, and we relate our statistical measure of pass-through to the model in Section 5. Section 6 discusses the model's calibration and our results are presented in Section 7. The last section concludes.
2 U.S. Import Prices and the Real Exchange Rate
We first examine the statistical relationship between import prices and the exchange rate and document the increasing disconnect between these variables. Our analysis closely follows Gust, Leduc, and Vigfusson (2010), who provide a more detailed treatment of this relationship.
In our analysis, we focus on imports that are included in the end-use categories of automotive products, consumer goods, and capital goods, excluding computers and semiconductors. We will refer to these categories as finished goods, which account for 45 percent of the nominal value of total imports since 1987.
We concentrate on this more narrowly defined measure of import prices for two reasons. First, we exclude import prices of services, computers, and semiconductors because of concerns about price measurement. Second, our preferred measure excludes import prices of foods, feeds, beverages, and industrial supplies, because we view our model as less applicable to these categories. In particular, we model the determination of import prices as arising from the decisions of firms that are monopolistic competitors and have the ability to price discriminate across countries. In the context of our model, excluding these goods is sensible since for many of these goods the extent of monopolistic behavior and price discrimination is limited.
We argue that the decline in pass-through can be understood using a real model and thus focus on real import prices and real exchange rates. Accordingly, we define the real price of imports as the ratio of the finished goods import price deflator to the U.S. CPI deflator. Henceforth we will refer to our relative price index of finished goods as the relative price of imports. For our measure of the real exchange rate, we use the Federal Reserve's real effective exchange rate, which is constructed from data on nominal exchange rates and consumer price indices for 39 countries.
We use the following statistic to summarize the relationship between these two series is:
 |
(1) |
where ![]() denotes the relative price of imports
and
denotes the relative price of imports
and ![]() denotes the real exchange rate. This
statistic takes into account the correlation between the two series
as well as their relative volatility and can be derived as the
estimate from a univariate least squares regression of the real
exchange rate on the relative import price. As shown in Table 1, our estimate of
denotes the real exchange rate. This
statistic takes into account the correlation between the two series
as well as their relative volatility and can be derived as the
estimate from a univariate least squares regression of the real
exchange rate on the relative import price. As shown in Table 1, our estimate of
![]() has declined in the 1990s,
reflecting both the decline in the relative volatility of import
prices and the lower correlation between the two series. Further
evidence of the increasing disconnect between these variable is
shown in the bottom panel of Figure 1 which plots
estimates of
has declined in the 1990s,
reflecting both the decline in the relative volatility of import
prices and the lower correlation between the two series. Further
evidence of the increasing disconnect between these variable is
shown in the bottom panel of Figure 1 which plots
estimates of
![]() for the log-differenced data
based on 10-year, rolling windows (The line with stars indicates
the point estimate and the shaded region denotes the 95 percent
confidence region.) There is a gradual decline in
for the log-differenced data
based on 10-year, rolling windows (The line with stars indicates
the point estimate and the shaded region denotes the 95 percent
confidence region.) There is a gradual decline in
![]() beginning in the mid-1980s.
beginning in the mid-1980s.
Our summary statistic,
![]() , is closely related to
estimates of pass-through in empirical studies. For instance, we
get comparable estimates to Marazzi, Sheets, and Vigfusson (2005) regarding the change in
the relationship between import prices and the exchange rate.
5 When estimating pass-through,
Marazzi, Sheets, and Vigfusson (2005) control for movements in marginal costs using
foreign CPIs and commodity prices. The results are also similar if
different control variables are used. For instance, pass-through
declines to the same extent when unit labor costs and domestic
output are respectively used to control for changes in marginal
costs and import demand, as in Campa and Goldberg (2004) Overall, the evidence
suggests that there has been an increasing disconnect between the
price of imported finished goods and the exchange rate. 6
, is closely related to
estimates of pass-through in empirical studies. For instance, we
get comparable estimates to Marazzi, Sheets, and Vigfusson (2005) regarding the change in
the relationship between import prices and the exchange rate.
5 When estimating pass-through,
Marazzi, Sheets, and Vigfusson (2005) control for movements in marginal costs using
foreign CPIs and commodity prices. The results are also similar if
different control variables are used. For instance, pass-through
declines to the same extent when unit labor costs and domestic
output are respectively used to control for changes in marginal
costs and import demand, as in Campa and Goldberg (2004) Overall, the evidence
suggests that there has been an increasing disconnect between the
price of imported finished goods and the exchange rate. 6
3 Trade Costs and Productivity
In this section, we address the time series evidence regarding whether tariffs and transport costs have fallen over time as well as discuss the behavior for other forms of trade costs. We also examine the data on changes in the relative productivity of the United States vis-à-vis its trading partners.
Barriers to international trade take many forms, some less tangible than others. Typically, tariffs and transport costs come to mind as factors impeding the flow of goods across countries. However, international trade can also be hindered by the presence of legal and regulatory costs, distribution costs, and institutional and cultural barriers. Although tariffs and transport costs make up only a fraction of overall trade costs, they remain an important factor underlying the movement towards greater trade integration. For instance, Baier and Bergstrand (2001) find that the decline in tariff rates and transport costs played an important role in post-World-War-II expansion in international trade for OECD countries. 7
Data on tariffs and transport costs support the notion that trade costs have been falling over time. For the United States, detailed information on tariffs and transport costs are available from Feenstra (1996) and Feenstra, Romalis, and Schott (2002) who have compiled product-level import data. Using this data, we compute tariffs and transport costs for finished-goods industries from 1980 to 2001. For each available industry, we measure trade costs as the sum of transport costs and tariffs and compute an industry-weighted average trade cost measure. (See the appendix of Gust, Leduc, and Vigfusson (2010), for the details of these calculations.)
Figure 2 reports that, over our sample period, the average trade cost across industries fell from 11.1 percent of the custom value of the goods in 1980 to 5.2 percent in 2001. The figure also decomposes our average trade cost measure into its tariffs and transport costs components. It shows that transport costs have declined somewhat since 1980 but that the fall in trade costs has been driven mostly by a reduction in tariffs.
Although tariffs and transport costs have the advantage of being relatively easier to quantify, it is more difficult to measure precisely other forms of trade costs, since they are often not directly observable. As a result, researchers infer these costs by estimating gravity models of international trade. This literature finds mixed evidence regarding a possible decline in overall trade costs. 8 As a result, we take a conservative approach and focus only on the evidence regarding transport costs and tariffs.
Since trade integration can also be triggered by improved productivity of exporting firms, we document changes in relative productivity across countries. The top panel of Figure 3 displays the annualized percentage change in GDP per employee for the United States ('US'), its foreign counterpart ('ROW'), and other regions around the world for the 1980-2003 period. 9 These indices are constructed using data on GDP per employee, and the ROW index is based on data for OECD and major developing countries. Growth in GDP per employee outside the United States outpaced U.S. growth largely due to faster productivity growth in developing Asia ('DA'), which includes a number of rapidly-developing countries such as China and South Korea. Productivity growth in Europe ('EU') was roughly on par with growth in the United States, while Japanese ('JA') productivity growth was somewhat faster than in the United States, despite a marked deceleration in Japanese productivity in the 1990s.
With foreign labor productivity growth higher than U.S. productivity growth over the last two decades, there has been considerable convergence of foreign productivity to the level of U.S. productivity. The bottom panel of Figure 3 shows that GDP per employee outside the United States roughly doubled over the 1980-2003 period, while U.S. GDP per employee rose about 40 percent over this period. As a consequence, the level of foreign productivity has increased by 40 percent relative to U.S. productivity over the past twenty-five years.
4 The Model
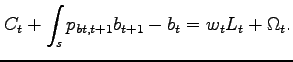
Our model is based on Gust, Leduc, and Vigfusson (2010), and consists of a home and a foreign economy. These two economies have isomorphic structures so in our exposition we focus on describing only the domestic economy. The domestic economy consists of two types of agents: households and firms. Households have utility that depends on the consumption of both domestically-produced goods and imported goods. These goods are purchased from monopolistically competitive firms, who set prices flexibly each period. While the range of goods produced by these firms is exogenously given, the fraction of firms that export is determined endogenously. In particular, because a firm must pay both a fixed and variable cost to export its good, it may choose to sell its good only in the domestic economy. The key element we introduce into this environment is that a firm's demand curve has a non-constant elasticity so that exchange-rate pass-through to import prices may be incomplete.
4.1 Households
The utility function of the representative household in the home country is
 |
(2) |
where the discount factor ![]() satisfies
satisfies
![]() and
and ![]() is the expectation operator conditional on information
available at time
is the expectation operator conditional on information
available at time ![]() . The period utility function
depends on consumption
. The period utility function
depends on consumption ![]() and labor
and labor ![]() . A household also purchases state-contingent assets
. A household also purchases state-contingent assets
![]() that are traded internationally so
that asset markets are complete.
that are traded internationally so
that asset markets are complete.
Household's receive income from working and an aliquot share of
profits of all the domestic firms,
![]() . In choosing its contingency
plans for
. In choosing its contingency
plans for ![]() ,
, ![]() ,
, ![]() , a household takes into account its budget constraint
at each date:
, a household takes into account its budget constraint
at each date:
 |
(3) |
In equation (3),
![]() is household's real
wage and
is household's real
wage and
![]() denotes the price of an asset that
pays one unit of the domestic consumption good in a particular
state of nature at date
denotes the price of an asset that
pays one unit of the domestic consumption good in a particular
state of nature at date ![]() . (For convenience, we have
suppressed that variables depend on the state of nature.).
. (For convenience, we have
suppressed that variables depend on the state of nature.).
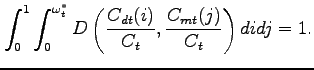
4.2 Demand Aggregator
There is a continuum of goods indexed by
![]() in each economy. While a
domestic household purchases all of the domestically-produced
goods, there are only
in each economy. While a
domestic household purchases all of the domestically-produced
goods, there are only
![]() that are
available for imports, where
that are
available for imports, where
![]() denotes the endogenously
determined fraction of traded foreign goods. A household chooses
domestically-produced goods,
denotes the endogenously
determined fraction of traded foreign goods. A household chooses
domestically-produced goods, ![]() , and
imported goods,
, and
imported goods, ![]() , to minimize their total
expenditures:
, to minimize their total
expenditures:
![$\displaystyle \left[ \int_{0}^{1}P_{dt}(i)C_{dt}(i)di+\int_{0}^{\omega _{t}^{\ast }}P_{mt}(j)C_{mt}(j)dj\right] ,$](img29.gif) |
(4) |
subject to
In minimizing its expenditures, a household takes the prices of the
domestic, ![]() , and imported goods,
, and imported goods,
![]() , as given. (For convenience, we
denote these prices in nominal terms, although prices are flexible
in the model and we solve only for real variables.) In our model,
there are no distribution services required to sell the imported
goods to households. Accordingly,
, as given. (For convenience, we
denote these prices in nominal terms, although prices are flexible
in the model and we solve only for real variables.) In our model,
there are no distribution services required to sell the imported
goods to households. Accordingly, ![]() denotes both the retail import price for good
denotes both the retail import price for good ![]() and price charged at the point of entry.
and price charged at the point of entry.
The household's demand aggregator for producing a unit of
![]() and is defined by:
and is defined by:
![$\displaystyle \int^{1}_0 \int^{\omega^{*}_t}_0 D\left(\frac{C_{dt}(i)}{C_t},\frac{C_{mt}(j) }{C_t}\right)di \hspace{0.1cm} dj= \left[\frac{1}{1+\omega^*_t}V_{dt}^{\frac{ 1}{\rho}}+ \frac{\omega^*_t}{1+\omega^*_t}V_{mt}^{\frac{1}{\rho}}\right] ^{\rho}-\frac{1}{(1+\eta)\gamma}+1,$](img36.gif) |
(5) |
In this expression, ![]() is an aggregator for
domestic goods given by:
is an aggregator for
domestic goods given by:
![$\displaystyle V_{dt} = \int^{1}_{0}\frac{1}{(1+\eta)\gamma} \left[(1+\omega^{*}_t)(1+\eta) \frac{C_{dt}(i)}{C_t}-\eta\right]^{\gamma}di,$](img38.gif) |
(6) |
and ![]() is an aggregator for imported goods
given by:
is an aggregator for imported goods
given by:
![$\displaystyle V_{mt} = \frac{1}{\omega^*_t} \int^{\omega^*_t}_{0}\frac{1}{(1+\eta)\gamma} \left[(1+\omega^{*}_t)(1+\eta)\frac{C_{mt}(j)}{C_t}-\eta\right]^{\gamma}dj.$](img40.gif) |
(7) |
Our demand aggregator adapts the one discussed in Dotsey and King (2005)
to an international environment and is discussed in more detail in
Gust, Leduc, and Vigfusson (2010),. It shares the central feature
that the elasticity of demand is nonconstant (NCES) with
![]() , and the (absolute value of the)
demand elasticity can be expressed as an increasing function of a
firm's relative price when
, and the (absolute value of the)
demand elasticity can be expressed as an increasing function of a
firm's relative price when ![]()
Expenditure minimization by a domestic household implies that the demand curve for an imported good is given by:
![$\displaystyle \frac{C_{mt}(j)}{C_t} = \frac{1}{1+\omega^{*}_t}\left[\frac{1}{1+\eta}\left( \frac{P_{mt}(j)}{P_{mt}}\right)^{\frac{1}{\gamma-1}} \left(\frac{P_{mt}}{ \Gamma_t}\right)^{\frac{\rho}{\gamma-\rho}} +\frac{\eta}{1+\eta}\right].$](img43.gif) |
(8) |
In the above, ![]() is a price index consisting of
the prices of a firm's competitors defined as:
is a price index consisting of
the prices of a firm's competitors defined as:
![$\displaystyle \Gamma_t = \left[\left(\frac{1}{1+\omega^*_t}\right) P_{dt}^{\frac{\gamma}{ \gamma-\rho}} + \left(\frac{\omega^{*}_t}{1+\omega^*_t}\right) P_{mt}^{\frac{ \gamma}{\gamma-\rho}} \right]^{\frac{\gamma-\rho}{\gamma}},$](img45.gif) |
(9) |
and ![]() and
and ![]() are indices of
domestic and import prices defined as:
are indices of
domestic and import prices defined as:
 |
(10) |
 |
(11) |
Expenditure minimization also implies an analogous expression for
the demand curve of domestic good ![]() , which
depends on prices,
, which
depends on prices, ![]() ,
, ![]() , and
, and ![]() .
.
A property of our aggregator is that it nests an Armington
aggregator so that the elasticity of substitution between a home
and foreign good can differ from the demand elasticity for two home
goods. 10 This separate elasticity for goods
occurs when
![]() , which gives the model more
flexibility to match estimates of the elasticity of substitution
between home and foreign tradeables as well as estimates of
economy-wide markups. More importantly, when
, which gives the model more
flexibility to match estimates of the elasticity of substitution
between home and foreign tradeables as well as estimates of
economy-wide markups. More importantly, when
![]() , the demand curve has an additive
linear term, which implies that the elasticity of demand depends on
the price of good
, the demand curve has an additive
linear term, which implies that the elasticity of demand depends on
the price of good ![]() relative to other prices. It
is this feature that helps give rise to incomplete pass-through to
import prices and implies that pass-through depends on the
economy's structure including the underlying shocks.
relative to other prices. It
is this feature that helps give rise to incomplete pass-through to
import prices and implies that pass-through depends on the
economy's structure including the underlying shocks.
The aggregate consumer price level is given by
![$\displaystyle P_{t}=\frac{1}{1+\eta }\Gamma _{t}+\frac{\eta }{1+\eta }\left[ \frac{1}{ 1+\omega^*_t}\int_{0}^{1}P_{dt}(i)di+\frac{1}{1+\omega^*_t} \int_{0}^{\omega^*_t }P_{mt}(j)dj\right] .$](img62.gif) |
(12) |
From this expression, it is clear that the consumer price level is
equal to the competitive pricing bundle,
![]() , when
, when ![]() . In
general, the consumer price level is the sum of
. In
general, the consumer price level is the sum of
![]() with a linear aggregator of prices
for individual goods. 11
with a linear aggregator of prices
for individual goods. 11
4.3 Firms
The production function for firm i is linear in labor so that
| (13) |
In the above, ![]() is an aggregate, iid
technology shock that affects the production function for all firms
in the home country. A firm hires labor in a competitive market in
which labor is completely mobile within a country but immobile
across countries. Marginal cost is therefore the same for all firms
in the home country so that real marginal cost of firm i is
given by
is an aggregate, iid
technology shock that affects the production function for all firms
in the home country. A firm hires labor in a competitive market in
which labor is completely mobile within a country but immobile
across countries. Marginal cost is therefore the same for all firms
in the home country so that real marginal cost of firm i is
given by
![]() .
.
Firms in each country are monopolistically competitive and each firm sells its good to households located in its country. Profit maximization implies that a firm chooses to set its price as a markup over marginal cost. As a result, the price of good i in the domestic market satisfies:
![$\displaystyle \frac{P_{dt}(i)}{P_{t}}=\mu _{dt}(i)\frac{w_t}{Z_t}, \hspace{1cm} i \in \left[0,1\right],$](img71.gif) |
(14) |
with
![]() . The markup
. The markup
![]() can be expressed as:
can be expressed as:
![$\displaystyle \mu _{dt}(i)= \mu_{dt} = \left[ 1-\frac{1}{\left\vert \epsilon _{dt}\right\vert }\right] ^{-1}=\left[ \gamma +\eta (\gamma -1)\left( \frac{ P_{dt}}{\Gamma _{t}}\right) ^{\frac{\rho}{\rho-\gamma }}\right] ^{-1},$](img74.gif) |
(15) |
where
![]() , is the absolute
value of the elasticity of a domestic good given by:
, is the absolute
value of the elasticity of a domestic good given by:
![$\displaystyle \epsilon _{dt}=\left[ \left( \gamma -1\right) \left( 1+\eta \left( \frac{ P_{dt}}{\Gamma _{t}}\right)^{\frac{\rho}{\rho-\gamma }} \right) \right] ^{-1}.$](img76.gif) |
(16) |
In the above, we have dropped the index ![]() , since we
restrict our attention to a symmetric equilibrium in which all
firms set the same price in the domestic market (i.e.,
, since we
restrict our attention to a symmetric equilibrium in which all
firms set the same price in the domestic market (i.e.,
![]()
![]() and
and
![]() .)
.)
Equation (15)
shows that a firm's markup depends on the price it sets relative to
its competitors price
![]() . When the (absolute value of) the
demand elasticity is increasing in
. When the (absolute value of) the
demand elasticity is increasing in
![]() , the markup will
be a decreasing function of this relative price. Consequently, a
firm will respond to a fall in the price of its competitors by
lowering its markup and price. A firm finds it desirable to do so,
because otherwise it will experience a relatively large fall in its
market share. An important exception to this pricing behavior is
the CES demand curve in which
, the markup will
be a decreasing function of this relative price. Consequently, a
firm will respond to a fall in the price of its competitors by
lowering its markup and price. A firm finds it desirable to do so,
because otherwise it will experience a relatively large fall in its
market share. An important exception to this pricing behavior is
the CES demand curve in which ![]() . In this
case, a firm's markup does not depend on the relative price of its
competitors.
. In this
case, a firm's markup does not depend on the relative price of its
competitors.
4.3.1 Entry
Following Melitz (2003), Ghironi and Melitz (2005) and Bergin and Glick (2007), we allow for the endogenous entry and exit of firms into the export market. In particular, we assume that each period a firm faces a fixed and per-unit export cost and decides whether to export or not. Unlike these previous papers, which allow productivity to vary with a good's type, we assume that the fixed cost varies with the variety of the good. 12 In particular, we assume that the fixed cost is given by:
 |
(17) |
and is paid in units of labor. We view this fixed cost as reflecting the cost to a firm of making consumers aware of its product, setting up a distribution system, and understanding the legal and regulatory environment of a foreign market. It seems reasonable to assume that these costs differ depending on the type of good.
Since an exporter must make its entry decision before the
realization of shocks in period ![]() , a firm will choose
to export if its expected profits from exporting exceed its fixed
cost:
, a firm will choose
to export if its expected profits from exporting exceed its fixed
cost:
| (18) |
where exporter ![]() 's per-unit profits in the foreign
market are given by:
's per-unit profits in the foreign
market are given by:
 |
(19) |
In the above, ![]() is the real exchange rate expressed
in units of the home consumption bundle per units of foreign
consumption,
is the real exchange rate expressed
in units of the home consumption bundle per units of foreign
consumption,
![]() is the nominal price of home good
is the nominal price of home good
![]() denominated in foreign currency, and
denominated in foreign currency, and
![]() is the demand for home good
is the demand for home good
![]() by foreign households. (We use a star to
denote foreign variables.) Also,
by foreign households. (We use a star to
denote foreign variables.) Also, ![]() is an iceberg
shipping cost which we assume to be a stochastic iid
process. 13 Finally, our functional form for the
fixed cost implies that only firms on the interval
is an iceberg
shipping cost which we assume to be a stochastic iid
process. 13 Finally, our functional form for the
fixed cost implies that only firms on the interval
![]() will export their good
where the marginal good
will export their good
where the marginal good ![]() satisfies equation
(18) as an
equality.
satisfies equation
(18) as an
equality.
Similar to a firm's pricing decision in the domestic market, profit maximization implies that a firm chooses its export price as a markup over marginal cost:
![$\displaystyle q_t \frac{P_{mt}^{\ast }(i)}{P_{t}^{\ast }}=\mu_{mt}^{\ast }(i)\frac{ D_{t}w_{t}}{Z_t}, \hspace{1cm} i \in [0,\omega_t].$](img98.gif) |
(20) |
In a symmetric equilibrium, all exporting firms will choose the
same price and markup (i.e.,
![]() and
and
![]() ). An
exporter's markup is given by:
). An
exporter's markup is given by:
![$\displaystyle \mu^*_{mt}(i)= \mu^*_{mt} = \left[ 1-\frac{1}{\left\vert \epsilon^*_{mt}\right\vert }\right] ^{-1}=\left[ \gamma +\eta (\gamma -1)\left( \frac{P^*_{mt}}{\Gamma^*_{t}}\right) ^{\frac{\rho}{\rho-\gamma }} \right] ^{-1},$](img101.gif) |
(21) |
where
![]() is the absolute
value of the elasticity of a domestic good in the foreign market.
is the absolute
value of the elasticity of a domestic good in the foreign market.
Comparing equations (14) and (20), we note that
the law of one price (i.e.,
![]() ) will not hold when
) will not hold when ![]() . In addition,
because the demand elasticity can differ across markets (i.e.,
. In addition,
because the demand elasticity can differ across markets (i.e.,
![]() ), a firm
will optimally choose to price discriminate. Price discrimination
by firms is possible due to the presence of fixed and per-unit
trade costs.
), a firm
will optimally choose to price discriminate. Price discrimination
by firms is possible due to the presence of fixed and per-unit
trade costs.
5 Defining Pass-Through
We consider two alternative definitions for import price
pass-through. For the first, we define pass-through from the
perspective of an individual exporter who views the exchange rate
as exogenous. This definition considers how much an individual
exporter changes his price in response to a one percent change in
the exchange rate, holding constant the other factors a firm takes
as given: its marginal cost and the prices of other firms. Letting
![]() and
and
![]() denote
the relative price of exporter i and the relative price of
its competitors, respectively, a foreign exporter's pricing
equation can be written as:
denote
the relative price of exporter i and the relative price of
its competitors, respectively, a foreign exporter's pricing
equation can be written as:
 |
(22) |
where
![]() is given by an analagous
expression to equation (21). The direct
effect of an exchange rate change on the price of foreign exporter
i is given by
is given by an analagous
expression to equation (21). The direct
effect of an exchange rate change on the price of foreign exporter
i is given by
![]() :
:
 |
(23) |
Because
![]() measures only the direct
effect of an exchange rate change on an exporter's price, we refer
to it as the direct pass-through measure.
measures only the direct
effect of an exchange rate change on an exporter's price, we refer
to it as the direct pass-through measure.
From the expression directly after the equality, we can see that
if ![]() then direct pass-through will be
incomplete. 14 In this case, a one percent increase
in
then direct pass-through will be
incomplete. 14 In this case, a one percent increase
in ![]() drives up a foreign exporter's cost
when denominated in dollars; however, a firm does not raise its
price a full one percent because as the exporter's price rises
relative to its competitors, it induces the exporter to accept a
lower markup rather than give up market share.
drives up a foreign exporter's cost
when denominated in dollars; however, a firm does not raise its
price a full one percent because as the exporter's price rises
relative to its competitors, it induces the exporter to accept a
lower markup rather than give up market share.
Alternatively, the expression after the second equality in
equation (23) indicates
that direct pass-through depends on the level of the markup and the
elasticity of the elasticity of demand,
![]() . This expression is similar to the one derived by
Eichenbaum and Fisher (2007) in a closed economy context. With
. This expression is similar to the one derived by
Eichenbaum and Fisher (2007) in a closed economy context. With ![]() , the elasticity of the elasticity of demand is
positive and as a result
, the elasticity of the elasticity of demand is
positive and as a result
![]() .
.
To facilitate comparisons of our model with the data, in
addition to our direct pass-through measure, we also examine our
model's implications for the second moment
![]() previously defined (in
log-differences) as:
previously defined (in
log-differences) as:
 |
(24) |
The relationship between
![]() and
and
![]() can be seen by
log-linearizing equation (22) around the
non-stochastic steady state to write a foreign exporter's pricing
decision as:
can be seen by
log-linearizing equation (22) around the
non-stochastic steady state to write a foreign exporter's pricing
decision as:
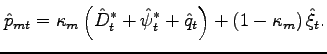 |
(25) |
The symbol ' ![]() ' denotes the log-deviation of a
variable from its steady state value and
' denotes the log-deviation of a
variable from its steady state value and
![]() evaluated at
nonstochastic steady state. Using this equation, we can relate
evaluated at
nonstochastic steady state. Using this equation, we can relate
![]() and
and
![]() via:
via:
According to equation (26), the univariate
regression statistic,
![]() , is related to
, is related to
![]() except that
except that
![]() takes into account any
correlation of the real exchange rate with an exporter's costs and
the pricing index of an exporter's competitors that occurs in
general equilibrium. Thus,
takes into account any
correlation of the real exchange rate with an exporter's costs and
the pricing index of an exporter's competitors that occurs in
general equilibrium. Thus,
![]() takes into account both
direct and indirect effects of an exchange rate change on an
exporter's price.
takes into account both
direct and indirect effects of an exchange rate change on an
exporter's price.
In our analysis, we focus on comparing our model results to the
data for
![]() rather than
rather than
![]() . This reflects that
. This reflects that
![]() is a second moment that is
easily measured in the data. In contrast, measuring
is a second moment that is
easily measured in the data. In contrast, measuring
![]() is complicated by finding good
measures of marginal costs and the prices of a firm's competitors
as well as correctly specifying the equations for estimating
is complicated by finding good
measures of marginal costs and the prices of a firm's competitors
as well as correctly specifying the equations for estimating
![]() and dealing with the endogeneity of
the exchange rate and the prices of other firms.
and dealing with the endogeneity of
the exchange rate and the prices of other firms.
6 Calibration
In order to investigate the role of trade costs and productivity differentials on pass-through, we log-linearize and solve the model around two different steady states. In the first, the home and foreign economies are identical, and both economies have relatively high trade costs. We call this our benchmark calibration. In the second, we lower trade costs as well as raise the level of foreign productivity, keeping the remaining parameters constant. 15 We call this the 2004 calibration. 16
The value of ![]() , which governs the curvature of
the demand curve, is critical for our analysis. Faced with sparse
independent evidence regarding this parameter, we calibrate it as a
part of a simulated method of moments procedure. Specifically, we
choose
, which governs the curvature of
the demand curve, is critical for our analysis. Faced with sparse
independent evidence regarding this parameter, we calibrate it as a
part of a simulated method of moments procedure. Specifically, we
choose ![]() along with the standard deviations of
the iid technology and trade cost shocks so that the model's
implications for the volatility of output, the ratio of the
volatility of relative import prices to the real exchange rate, and
the correlation between relative import prices and the real
exchange rate match those observed in the 1980-1989 period. In
doing so, we constrain the standard deviation of the technology
shocks and trade costs shocks to be the same in both countries
(i.e.,
along with the standard deviations of
the iid technology and trade cost shocks so that the model's
implications for the volatility of output, the ratio of the
volatility of relative import prices to the real exchange rate, and
the correlation between relative import prices and the real
exchange rate match those observed in the 1980-1989 period. In
doing so, we constrain the standard deviation of the technology
shocks and trade costs shocks to be the same in both countries
(i.e.,
![]() and
and
![]() . By
construction, our model matches the observed value of
. By
construction, our model matches the observed value of
![]() for the 1980s. With
for the 1980s. With
![]() pinned down based on the pre-1990s
data, we then examine the fall in
pinned down based on the pre-1990s
data, we then examine the fall in
![]() arising from a fall in
trade costs and a higher level of foreign productivity.
arising from a fall in
trade costs and a higher level of foreign productivity.
Tables 2 show our calibrated value of ![]() as well as the
calibrated values of other important parameters of the model. We
choose
as well as the
calibrated values of other important parameters of the model. We
choose ![]() to be consistent with an exporter's
markup over marginal cost of around 20 percent in the benchmark
calibration. We set
to be consistent with an exporter's
markup over marginal cost of around 20 percent in the benchmark
calibration. We set
![]() , which implies an aggregate
trade-price elasticity for the benchmark calibration of 2. 17 The
discount factor
, which implies an aggregate
trade-price elasticity for the benchmark calibration of 2. 17 The
discount factor
![]() , and the utility
function parameter
, and the utility
function parameter ![]() is set to 1.5, which
implies a Frisch elasticity of labor supply of 2/3. We set
is set to 1.5, which
implies a Frisch elasticity of labor supply of 2/3. We set
![]() and
and
![]() to imply
to imply
![]() in the benchmark
calibration.
in the benchmark
calibration.
For the initial levels of technology, we choose
![]() . As shown in Figure
. As shown in Figure ![]() , foreign
productivity rose about 35 percent relative to the level of U.S.
productivity from 1980 to 2000. Thus, we set
, foreign
productivity rose about 35 percent relative to the level of U.S.
productivity from 1980 to 2000. Thus, we set
![]() in the 2004 calibration.
Consistent with Figure
in the 2004 calibration.
Consistent with Figure ![]() , we set
, we set
![]() in the benchmark calibration
and lowered
in the benchmark calibration
and lowered
![]() in the 2004
calibration.
in the 2004
calibration.
For the fixed costs of trade we set
![]() which implies that the
import share in the home economy is about 10 percent. Since we
assume that trade is balanced in the initial steady state, the
foreign economy has the same import share. We choose
which implies that the
import share in the home economy is about 10 percent. Since we
assume that trade is balanced in the initial steady state, the
foreign economy has the same import share. We choose
![]() so that after the
fall in trade costs and increase in foreign productivity, the home
country's import share rises about 4 percentage points.
so that after the
fall in trade costs and increase in foreign productivity, the home
country's import share rises about 4 percentage points.
We also compare our benchmark calibration to one with CES
preferences (i.e., ![]() ). Table 2 reports the
parameter values used for the CES calibration, which were selected
in an analogous manner to our benchmark calibration. Table 3 shows that both
the CES and benchmark calibration (by construction) match the
observed volatility of output and correlation between import prices
and the exchange rate in the 1980s. However, only the benchmark
calibration with
). Table 2 reports the
parameter values used for the CES calibration, which were selected
in an analogous manner to our benchmark calibration. Table 3 shows that both
the CES and benchmark calibration (by construction) match the
observed volatility of output and correlation between import prices
and the exchange rate in the 1980s. However, only the benchmark
calibration with
![]() has the flexibility to match the
observed value of
has the flexibility to match the
observed value of
![]() in the 1980s. Although the
benchmark calibration implies slightly more exchange rate
volatility than the CES calibration, both versions of the model
understate the amount of volatility relative to the data. Thus,
while the NCES demand curves better account for the observed
relationship between the relative import price and the real
exchange rate, they do not by themselves explain other important
aspects of the data emphasized in the international business cycle
literature. 18
in the 1980s. Although the
benchmark calibration implies slightly more exchange rate
volatility than the CES calibration, both versions of the model
understate the amount of volatility relative to the data. Thus,
while the NCES demand curves better account for the observed
relationship between the relative import price and the real
exchange rate, they do not by themselves explain other important
aspects of the data emphasized in the international business cycle
literature. 18
7 Results
In this section, we first discuss the effects of falling trade costs and higher foreign productivity on pass-through. 19 We then present our main finding regarding how pass-through is influenced by firms' entry in the export market.
7.1 Trade Integration and Declining Pass-Through
Table 4 shows the effects of lowering per-unit trade costs and higher
foreign productivity on pass-through and important steady state
prices and quantities. The table shows the value of the variables
in steady state except for
![]() , which is obtained from
log-linearizing the model and computing the population moments of
the model's variables given the shock processes. We start by
looking at the effects of changing one variable at a time (columns
2, 3 and 5), before analyzing their combined impacts (last column).
As shown in the second column, a five percentage point fall in the
trade costs of foreign exporters reduces the real marginal cost of
exporting (denominated in terms of the home consumption bundle) by
3.5 percent. Note that the fall in foreign exporters' real marginal
cost,
, which is obtained from
log-linearizing the model and computing the population moments of
the model's variables given the shock processes. We start by
looking at the effects of changing one variable at a time (columns
2, 3 and 5), before analyzing their combined impacts (last column).
As shown in the second column, a five percentage point fall in the
trade costs of foreign exporters reduces the real marginal cost of
exporting (denominated in terms of the home consumption bundle) by
3.5 percent. Note that the fall in foreign exporters' real marginal
cost,
![]() , is
less than the decline in
, is
less than the decline in ![]() as increased demand
for the foreign good puts upward pressure on the real exchange
rate,
as increased demand
for the foreign good puts upward pressure on the real exchange
rate, ![]() , and on foreign wages. With lower costs,
foreign exporters reduce their prices and the home country's import
share rises 0.7 percentage point. Because foreign exporters' prices
fall relative to their competitors (i.e., the domestic firms), they
are able to increase their markups and still gain market share.
Conversely, the prices for domestic goods rise relative to their
competitors, and domestic firms are forced to cut their markups in
reaction to stiffer competition from abroad.
, and on foreign wages. With lower costs,
foreign exporters reduce their prices and the home country's import
share rises 0.7 percentage point. Because foreign exporters' prices
fall relative to their competitors (i.e., the domestic firms), they
are able to increase their markups and still gain market share.
Conversely, the prices for domestic goods rise relative to their
competitors, and domestic firms are forced to cut their markups in
reaction to stiffer competition from abroad.
With higher markups on foreign goods, the strategic
complementarity intensifies and foreign exporters become more
willing to vary their markups in response to cost shocks. Thus, the
5 percentage point decline in trade costs causes the direct
pass-through measure
![]() to fall from 0.48 to 0.462, or
1.8 percentage points. This fall in
to fall from 0.48 to 0.462, or
1.8 percentage points. This fall in
![]() also leads to a reduction in our
statistical measure of pass-through,
also leads to a reduction in our
statistical measure of pass-through,
![]() , of 2.3 percentage points.
To understand the fall in
, of 2.3 percentage points.
To understand the fall in
![]() , recall that equation
(26, reproduced
below) implies a fall in
, recall that equation
(26, reproduced
below) implies a fall in
![]() directly lowers
directly lowers
![]() :
:
![$\displaystyle \beta _{p_{m},q}=\kappa _{m}+\kappa _{m}\left[ \frac{\text{cov}(\Delta \psi _{t}^{\ast },\Delta q_{t})}{\text{var}\left( \Delta q_{t}\right) }+\frac{ \text{cov}(\Delta D_{t}^{\ast },\Delta q_{t})}{\text{var}\left( \Delta q_{t}\right) }\right] +\left( 1-\kappa _{m}\right) \left[ \frac{\text{cov} (\Delta \xi _{t},\Delta q_{t})}{\text{var}\left( \Delta q_{t}\right) }\right] .$](img178.gif) |
Moreover, the decline in
![]() implies that there is less
weight on the marginal cost term (the first term in square
brackets) and more weight on the price competitiveness term (the
second term in square brackets). The marginal cost term is larger
than the price competitiveness term because
implies that there is less
weight on the marginal cost term (the first term in square
brackets) and more weight on the price competitiveness term (the
second term in square brackets). The marginal cost term is larger
than the price competitiveness term because ![]() has little variation. As a result, a
fall in
has little variation. As a result, a
fall in
![]() , by shifting a firm's emphasis
in pricing away from cost considerations to considerations of price
competitiveness, induces an even larger decline in
, by shifting a firm's emphasis
in pricing away from cost considerations to considerations of price
competitiveness, induces an even larger decline in
![]() .
.
A fall in ![]() , the trade cost on domestic goods sold
to the foreign economy, also lowers pass-through (third column of
Table 4). In
general equilibrium, increased foreign demand for home goods causes
an appreciation of the home currency that reduces the cost of
foreign exporters and leads to a fall in pass-through. The
appreciation of the currency results in the real cost of foreign
exporters (in home currency) falling by 0.7 percent. This decline
in costs triggers a fall in foreign exporters' prices relative to
prices of domestic goods in the home market. As a result, exporters
increase their markups and prices of foreign goods decline only 0.3
percent. At these higher markups,
, the trade cost on domestic goods sold
to the foreign economy, also lowers pass-through (third column of
Table 4). In
general equilibrium, increased foreign demand for home goods causes
an appreciation of the home currency that reduces the cost of
foreign exporters and leads to a fall in pass-through. The
appreciation of the currency results in the real cost of foreign
exporters (in home currency) falling by 0.7 percent. This decline
in costs triggers a fall in foreign exporters' prices relative to
prices of domestic goods in the home market. As a result, exporters
increase their markups and prices of foreign goods decline only 0.3
percent. At these higher markups,
![]() declines 0.4 percentage point
and
declines 0.4 percentage point
and
![]() declines 0.6 percentage
points.
declines 0.6 percentage
points.
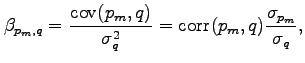
The fourth column of Table 4 shows the combined effects of lowering trade costs in the home and foreign economies. In this case, foreign exporters' share of the domestic market expands by 0.9 percentage point and our statistical measure of pass-through declines about 3 percentage points.
The fifth column of Table 4 displays the
effects of raising the level of foreign productivity by 35 percent.
Although there is a substantial increase in foreign real wages in
response to the higher level of productivity, marginal costs in
foreign currency fall. The foreign currency also depreciates; so,
an exporter's marginal cost in home currency units falls almost 19
percent. This large decline in foreign costs allows foreign
exporters to both substantially reduce prices and expand their
markups at the expense of their domestic competitors. Consequently,
the decline in
![]() is a sizeable 12.5
percentage points.
is a sizeable 12.5
percentage points.
The last column of Table 4 displays the
decline in pass-through from the benchmark calibration to 2004
calibration in which the increase in foreign productivity is
combined with the decline in ![]() and
and ![]() . Higher productivity and lower trade costs have a
substantial impact on pass-through. Overall,
. Higher productivity and lower trade costs have a
substantial impact on pass-through. Overall,
![]() falls almost 15 percentage
points, which accounts for about one third of the observed decline.
The fall in pass-through occurs even though the home market is
simultaneously becoming more competitive: markups on domestic goods
fall 1.7 percentage points (see Table 2 for a more
detailed comparison of the properties of the benchmark and 2004
calibrations). These results broadly capture the view that
pass-through has fallen in the United States because of increased
foreign competition, which in turn has reduced profit margins of
domestic producers in the U.S. market. 20
falls almost 15 percentage
points, which accounts for about one third of the observed decline.
The fall in pass-through occurs even though the home market is
simultaneously becoming more competitive: markups on domestic goods
fall 1.7 percentage points (see Table 2 for a more
detailed comparison of the properties of the benchmark and 2004
calibrations). These results broadly capture the view that
pass-through has fallen in the United States because of increased
foreign competition, which in turn has reduced profit margins of
domestic producers in the U.S. market. 20
7.2 The Impact of Entry on Pass-Through
We now assess the interaction of the intensive and extensive trade margins with the variable demand elasticity strategic and their role in accounting for the decline in pass-through. To do this, we consider a version of our model that abstracts from entry altogether and then consider a version in which only foreign exporters make entry decisions. In each case, we consider a fall in domestic and foreign trade costs of 5 percentage points and an increase in foreign productivity of 35 percent.
To better understand the relative importance of the intensive and extensive margins, Figure 4 plots a number of key variables as a function of the number of foreign exporters. We do so for three different cases: the benchmark calibration with relatively high trade costs and low foreign productivity (the dashed blue line), the 2004 calibration with low trade costs and high foreign productivity (the dotted red line), and the 2004 calibration except only foreign exporters make entry decisions (the dashed-dotted green line). The corresponding numerical results to Figure 4 are shown in Table 5.
Consider first the dashed blue lines in each panel. As the
number of foreign exporters increases, per-unit profits of export
good ![]() decline due to lower demand for each
individual good and a decline in an exporter's markup. This markup
decline reflects that an increase in the number of foreign
exporters drives up wages and production costs in the foreign
economy, inducing a real home currency depreciation and a rise in
the relative import price,
decline due to lower demand for each
individual good and a decline in an exporter's markup. This markup
decline reflects that an increase in the number of foreign
exporters drives up wages and production costs in the foreign
economy, inducing a real home currency depreciation and a rise in
the relative import price, ![]() . Conversely, the
markups of domestic firms in the domestic market increase.
. Conversely, the
markups of domestic firms in the domestic market increase.
Both measures of pass-through increase as the number of foreign
exporters rises. As discussed earlier, this increase reflects that
a reduction in an exporter's markup is associated with an increase
in direct pass-through, ![]() . Also, an increase
in the number of exporters in the domestic economy implies that
there are more firms who change their prices in response to
exchange-rate movements, which also increases pass-through in
general equilibrium,
. Also, an increase
in the number of exporters in the domestic economy implies that
there are more firms who change their prices in response to
exchange-rate movements, which also increases pass-through in
general equilibrium,
![]() . Thus, as in
Dornbusch (1987), our model implies that other things equal, an
increase in the number of foreign exporters leads to higher
pass-through of exchange rate changes to import prices.
. Thus, as in
Dornbusch (1987), our model implies that other things equal, an
increase in the number of foreign exporters leads to higher
pass-through of exchange rate changes to import prices.
Returning to the upper left panel, the equilibrium number of foreign exporters in the benchmark calibration is given by point A where per-unit profits intersect with the fixed cost (the solid black line). What happens when we lower trade costs and raise foreign productivity but completely abstract from the extensive trade margin? The equilibrium shifts from point A to point B, as the fall in export production costs raises the demand for an exporter's good as well as his profits. As shown in the upper right panel, the import share in the home economy also rises from about 10 percent to 10.7 percent. Lower production costs are also associated with an increase in the markups of foreign exporters and, as shown in the second column of Table 5, a decline in pass-through of about 15.1 percentage points. Consequently, most of the decline in pass-through occurs along the intensive trade margin.
Now consider the case in which we allow for the entry of foreign exporters in response to the decline in the cost of exporting. In this case, the equilibrium shifts from point B to point C, as the increase in profits induces more exporters to pay their fixed entry cost. Accordingly, the import share now rises to about 14.6 percent, so that the bulk of the increase in imports reflects new goods. There is some decline in the markups of foreign exporters relative to point B. Although the two measures of pass-through rise from point C to point B, the effect is small relative to the decline in pass-through associated with the intensive margin.
When we further endogenize home exporters' entry decisions, the
equilibrium moves from point C to point D, which corresponds to the
last column in Table 5. Since foreign
firms are 35 percent more productive than in the initial
equilibrium (point A), foreign demand for domestic goods falls and
domestic exporters decide to exit the foreign market. Table 5 shows that this
reduction in the number of domestic exporters implies a smaller
appreciation of the domestic real exchange rate and as a result the
profit and markup functions for a foreign exporter shifts down to
the red dotted line. At equilibrium point D, foreign exporters
markups are smaller and, in turn, the direct measure of
pass-through,
![]() , is higher than at point C.
Despite this increase in
, is higher than at point C.
Despite this increase in ![]() ,
,
![]() falls, reflecting that there
is less co-movement between the real exchange rate and foreign
marginal cost (see equation (see equation (26)) with a decline
in the number of domestic exporters in the foreign economy.
falls, reflecting that there
is less co-movement between the real exchange rate and foreign
marginal cost (see equation (see equation (26)) with a decline
in the number of domestic exporters in the foreign economy.
Overall, the entry of foreign exporters plays an important role in accounting for the large rise in the import share associated with a decline in trade costs and higher foreign productivity. An increase in the number of foreign exporters also has the ceteris paribus effect of raising pass-through. However, this effect is small relative to the decline in pass-through that results from markup adjustments that occurs along the intensive margin in response to factors that increase trade integration.
8 Conclusion
We assessed the impact of firm entry on exchange-rate pass-through to import prices. This question is particularly important given the increased openness of the U.S. economy and the considerable decline in the degree of pass-through to U.S. import prices. Such a decline in pass-through implies that foreign exporters have become more willing to vary their markups in order to keep their local prices competitive and maintain market share in the wake of large exchange rate fluctuations. One argument put forward by those more skeptical of the decline in pass-through is that the entry of foreign exporters associated with greater openness should reduce markups, make them less variable, and raise the degree of exchange rate pass-through.
In our framework, we find that firm entry does indeed push up exchange-rate pass-through and is essential in accounting for the secular rise in the U.S. import share. However, increased entry of foreign exporters has a relatively small impact on exchange rate pass-through. The effects of higher foreign productivity and a reduction in trade costs on markup behavior along the intensive margin are much more important quantitatively and appear to explain a considerable portion of the observed decline in pass-through to U.S. import prices. Thus, it is not surprising that pass-through has declined as the U.S. economy has become more open.
References
Baier, S. L. and J. H. Bergstrand (2001). The growth of world trade: Tariffs, transport costs, and income similarity. Journal of International Economics 53, 1–27.
Bergin, P. R. and R. C. Feenstra (2001). Pricing-to-market, staggered contracts, and real exchange rate persistence. Journal of International Economics 54, 333–59.
Bergin, P. R. and R. Glick (2007). Tradability, productivity, and international economic integration. Journal of International Economics 73, 128–151.
Berthelon, M. and C. Freund (2004). On the conservation of distance in international trade. World Bank Policy Research Working Paper 3293.
Brun, J.-F., C. Carrere, P. Guillaumont, and J. de Melo (2005). Has distance died? evidence from a panel gravity model. World Bank Economic Review 19, 99–120.
Campa, J. M. and L. S. Goldberg (2004). Exchange rate pass-through into import prices. Centre for Economic Policy Research Discussion Papers 4391.
Coe, D. T., A. Subramanian, N. T. Tamirisa, and R. Bhavnani (2002). The missing globalization puzzle. International Monetary Fund Working Paper 02/171.
Dornbusch, R. (1987). Exchange rates and prices. American Economic Review 77, 93–106.
Dotsey, M. and R. G. King (2005). Implications of state-dependent pricing for dynamic macroeconomic models. Journal of Monetary Economics 52, 213–42.
Eichenbaum, M. and J. D. M. Fisher (2007). Estimating the frequency of price reoptimization in calvo style models. Journal of Monetary Economics 54, 2032–2047.
Feenstra, R. C. (1996). U.s. imports 1972-1994: Data and concordances. National Bureau of Economic Research Working Paper 5515.
Feenstra, R. C., J. Romalis, and P. Schott (2002). U.s. imports, exports and tariff data, 1989-2001. National Bureau of Economic Research Working Paper 9387.
Frankel, J. A. (1997). Regional Trading Blocs in the World Economic System. Washington, D.C.: Institute for International Economics.
Ghironi, F. and M. J. Melitz (2005). International trade and macroeconomic dynamics with heterogeneous firms. Quarterly Journal of Economics 120, 865–915.
Goldberg, P. K. and M. M. Knetter (1997). Goods prices and exchange rates: What have we learned? Journal of Economic Literature 35, 1243–72.
Gust, C., S. Leduc, and R. Vigfusson (2010). Trade integration, competition, and the decline in exchange rate pass-through. Journal of Monetary Economics 57, 309–324.
Marazzi, M., N. Sheets, and R. J. Vigfusson (2005). Exchange rate pass-through to u.s. import prices: Some new evidence. Board of Governors of the Federal Reserve System International Finance Discussion Papers 833.
Melitz, M. J. (2003). The impact of trade on intra-industry reallocations and aggregate industry productivity. Econometrica 71, 1695–1725.
Rauch, J. E. (1999). Networks versus markets in international trade. Journal of International Economics 48, 7–35.
Table 1: Volatility and Correlation of Relative Import Price and Real Exchange Ratea
| Full Sample | 1980:1-1989:4 | 1990:1-2004:4 | |
|---|---|---|---|
| Moment (Differenced): a. (a = b*c) | 0.35 | 0.55 | 0.13 |
| Moment (Differenced): b. | 0.47 | 0.60 | 0.25 |
| Moment (Differenced): c. corr | 0.75 | 0.92 | 0.51 |
| Moment (HP-Filtered): a. (a = b*c) | 0.46 | 0.59 | 0.17 |
| Moment (HP-Filtered): b. | 0.54 | 0.61 | 0.29 |
| Moment (HP-Filtered): c. corr | 0.85 | 0.95 | 0.60 |
![]()
![]() denotes the regression
coefficient from a univariate least squares regression of the real
exchange rate on the relative import price. Differenced refers to
data that has been log-differenced. HP-filtered series were
computed by transforming the log of the variables (with
denotes the regression
coefficient from a univariate least squares regression of the real
exchange rate on the relative import price. Differenced refers to
data that has been log-differenced. HP-filtered series were
computed by transforming the log of the variables (with
![]() ).
).
Table 2: Parameter Values and Properties of Calibrated Models
| NCES Demand: Benchmark Calibration | NCES Demand: 2004 Calibration | CES Calibration | |
|---|---|---|---|
| 0.85 | 0.85 | 1.7 | |
| -3.05 | -3.05 | 0 | |
| 1.1 | 1.1 | 0.835 | |
| 0.9926 | 0.9926 | 0.9926 | |
| 1.5 | 1.5 | 1.5 | |
| 0.79 | 0.79 | 0.83 | |
| 1.1 | 1.05 | 1.1 | |
| 1 | 1 | 1 | |
| 1 | 1.35 | 1 | |
| 0.46 | 0.46 | 0.37 | |
| 2.5 | 2.5 | 2.5 | |
| | 0.0178 | 0.0178 | 0.0191 |
| | 0.0094 | 0.0094 | 0.008 |
| Home Trade Share | 10.0% | 14.0% | 10.0% |
| Home Firms' Domestic Markup ( | 1.27 | 1.24 | 1.20 |
| Foreign Exporters' Markup ( | 1.20 | 1.38 | 1.20 |
| Home Trade-Price Elasticity | -2.0 | -1.2 | -2.0 |
| Direct Pass-Through ( | 0.48 | 0.36 | 1 |
Table 3: Selected Moments of Data and Calibrated Modelsa
| Moment | Data: 1980-1989 | Data: 1990-2004 | Model: Benchmark Calibration | Model: 2004 Calibration | Model: CES Calibration |
|---|---|---|---|---|---|
| a. (a = b*c) | 0.55 | 0.13 | 0.55 | 0.40 | 1.08 |
| b. | 0.60 | 0.25 | 0.60 | 0.43 | 1.17 |
| c. corr | 0.92 | 0.51 | 0.92 | 0.92 | 0.92 |
| | 1.74 | 0.98 | 1.74 | 1.71 | 1.74 |
| | 4.98 | 2.70 | 1.91 | 1.96 | 1.74 |
![]() The subscript 'hp' denotes that a variable was transformed
using the HP-filter (with
The subscript 'hp' denotes that a variable was transformed
using the HP-filter (with
![]() ).
).
Table 4: The Effect of Permanently Lower Trade Costs and Higher Foreign Productivitya,b
| Lower | Lower | Lower | Higher | Higher Lower | |
|---|---|---|---|---|---|
| Foreign Exporter Trade Cost ( | -5 | 0 | -5 | 0 | -5 |
| Home Exporter Trade Cost ( | 0 | -5 | -5 | 0 | -5 |
| Foreign Productivity ( | 0 | 0 | 0 | 35 | 35 |
| Home Import Share | 0.7 | 0.2 | 0.9 | 3.3 | 4.0 |
| Home Firm Markup at Home ( | -0.3 | -0.1 | -0.3 | -1.4 | -1.7 |
| a. Home Import Price ( (a = b+c) | -1.6 | -0.3 | -1.9 | -8.2 | -9.9 |
| b. Foreign Exporter's Markup ( | 1.8 | 0.3 | 2.2 | 10.9 | 13.9 |
| c. Foreign Marginal Cost ( | -3.5 | -0.7 | -4.1 | -19.1 | -23.8 |
| Real Exchange Rate ( | 1.1 | -1.1 | 0 | -17.5 | -17.7 |
| Direct Pass-Through ( | -1.8 | -0.4 | -2.2 | -9.5 | -11.6 |
| Pass-Through ( | -2.3 | -0.6 | -2.9 | -12.5 | -14.7 |
![]() Entry refers to the log-difference for a variable from its
value in the benchmark calibration. For the trade costs, home trade
share,
Entry refers to the log-difference for a variable from its
value in the benchmark calibration. For the trade costs, home trade
share, ![]() , and
, and
![]() , we report the percentage
point difference. For
, we report the percentage
point difference. For ![]() , we report the
arithmetic percentage change instead of the log-difference.
, we report the
arithmetic percentage change instead of the log-difference.
![]() Row a equals row b
plus row c with any discrepancy due to rounding.
Row a equals row b
plus row c with any discrepancy due to rounding.
Table 5: The Effect of Permanently Lower Trade Costs and Higher Foreign Productivity for Alternative Model Versionsa,b
| Without Entry | With Only Foreign Exporter Entry | With Entry | |
|---|---|---|---|
| Foreign Exporter Trade Cost ( | -5 | -5 | -5 |
| Home Exporter Trade Cost ( | -5 | -5 | -5 |
| Foreign Productivity ( | 35 | 35 | 35 |
| Home Import Share | 0.7 | 4.6 | 4.0 |
| Home Firm Markup at Home ( | -1.7 | -1.9 | -1.7 |
| a. Home Import Price ( (a = b+c) | -12.9 | -11.0 | -9.9 |
| b. Foreign Exporter's Markup ( | 19.8 | 16.1 | 13.9 |
| c. Foreign Marginal Cost ( | -23.7 | -19.2 | -17.7 |
| Real Exchange Rate ( | -15.2 | -13.0 | -11.6 |
| Direct Pass-Through ( | -15.2 | -13.0 | -11.6 |
| Pass-Through ( | -15.1 | -13.4 | -14.7 |
![]() Entry refers to the log-difference for a variable from its
value in the benchmark calibration. For the trade costs, home trade
share,
Entry refers to the log-difference for a variable from its
value in the benchmark calibration. For the trade costs, home trade
share, ![]() , and
, and
![]() , we report the percentage
point difference. For
, we report the percentage
point difference. For ![]() , we report the
arithmetic percentage change instead of the log-difference.
, we report the
arithmetic percentage change instead of the log-difference.
![]() Row a equals row b
plus row c with any discrepancy due to rounding.
Row a equals row b
plus row c with any discrepancy due to rounding.
Figure 1: The Real Exchange Rate and Relative Import Prices
Data for Figure 1
Year |
Estimate |
Confidence Interval: Lower Bound |
Confidence Interval: Upper Bound |
|---|---|---|---|
| 1983.25 | 0.50 | 0.25 | 0.76 |
| 1983.5 | 0.54 | 0.28 | 0.80 |
| 1983.75 | 0.54 | 0.28 | 0.80 |
| 1984 | 0.55 | 0.30 | 0.80 |
| 1984.25 | 0.51 | 0.25 | 0.77 |
| 1984.5 | 0.54 | 0.32 | 0.76 |
| 1984.75 | 0.53 | 0.32 | 0.75 |
| 1985 | 0.51 | 0.30 | 0.72 |
| 1985.25 | 0.48 | 0.29 | 0.68 |
| 1985.5 | 0.46 | 0.28 | 0.65 |
| 1985.75 | 0.47 | 0.29 | 0.64 |
| 1986 | 0.51 | 0.34 | 0.67 |
| 1986.25 | 0.53 | 0.37 | 0.69 |
| 1986.5 | 0.53 | 0.38 | 0.68 |
| 1986.75 | 0.53 | 0.38 | 0.68 |
| 1987 | 0.53 | 0.38 | 0.68 |
| 1987.25 | 0.52 | 0.38 | 0.67 |
| 1987.5 | 0.51 | 0.37 | 0.65 |
| 1987.75 | 0.50 | 0.37 | 0.64 |
| 1988 | 0.51 | 0.37 | 0.64 |
| 1988.25 | 0.50 | 0.38 | 0.62 |
| 1988.5 | 0.53 | 0.41 | 0.65 |
| 1988.75 | 0.52 | 0.40 | 0.64 |
| 1989 | 0.53 | 0.42 | 0.65 |
| 1989.25 | 0.52 | 0.41 | 0.64 |
| 1989.5 | 0.53 | 0.45 | 0.61 |
| 1989.75 | 0.54 | 0.46 | 0.62 |
| 1990 | 0.54 | 0.47 | 0.62 |
| 1990.25 | 0.54 | 0.47 | 0.61 |
| 1990.5 | 0.50 | 0.42 | 0.58 |
| 1990.75 | 0.49 | 0.41 | 0.58 |
| 1991 | 0.49 | 0.40 | 0.57 |
| 1991.25 | 0.49 | 0.41 | 0.58 |
| 1991.5 | 0.47 | 0.38 | 0.56 |
| 1991.75 | 0.46 | 0.37 | 0.54 |
| 1992 | 0.46 | 0.37 | 0.55 |
| 1992.25 | 0.47 | 0.37 | 0.56 |
| 1992.5 | 0.45 | 0.35 | 0.54 |
| 1992.75 | 0.42 | 0.33 | 0.52 |
| 1993 | 0.42 | 0.33 | 0.52 |
| 1993.25 | 0.43 | 0.33 | 0.52 |
| 1993.5 | 0.42 | 0.32 | 0.52 |
| 1993.75 | 0.42 | 0.32 | 0.51 |
| 1994 | 0.41 | 0.32 | 0.51 |
| 1994.25 | 0.42 | 0.33 | 0.51 |
| 1994.5 | 0.42 | 0.32 | 0.52 |
| 1994.75 | 0.42 | 0.32 | 0.52 |
| 1995 | 0.39 | 0.28 | 0.49 |
| 1995.25 | 0.37 | 0.27 | 0.47 |
| 1995.5 | 0.37 | 0.26 | 0.47 |
| 1995.75 | 0.35 | 0.25 | 0.46 |
| 1996 | 0.33 | 0.23 | 0.42 |
| 1996.25 | 0.29 | 0.20 | 0.39 |
| 1996.5 | 0.28 | 0.19 | 0.37 |
| 1996.75 | 0.28 | 0.19 | 0.37 |
| 1997 | 0.27 | 0.18 | 0.36 |
| 1997.25 | 0.26 | 0.17 | 0.35 |
| 1997.5 | 0.26 | 0.17 | 0.35 |
| 1997.75 | 0.23 | 0.14 | 0.31 |
| 1998 | 0.19 | 0.11 | 0.28 |
| 1998.25 | 0.19 | 0.10 | 0.27 |
| 1998.5 | 0.17 | 0.09 | 0.25 |
| 1998.75 | 0.15 | 0.07 | 0.22 |
| 1999 | 0.14 | 0.07 | 0.22 |
| 1999.25 | 0.13 | 0.06 | 0.21 |
| 1999.5 | 0.13 | 0.06 | 0.20 |
| 1999.75 | 0.13 | 0.06 | 0.20 |
| 2000 | 0.13 | 0.06 | 0.21 |
| 2000.25 | 0.13 | 0.06 | 0.20 |
| 2000.5 | 0.16 | 0.09 | 0.23 |
| 2000.75 | 0.16 | 0.08 | 0.23 |
| 2001 | 0.16 | 0.09 | 0.23 |
| 2001.25 | 0.16 | 0.09 | 0.23 |
| 2001.5 | 0.16 | 0.10 | 0.23 |
| 2001.75 | 0.15 | 0.08 | 0.22 |
| 2002 | 0.15 | 0.09 | 0.22 |
| 2002.25 | 0.14 | 0.08 | 0.21 |
| 2002.5 | 0.13 | 0.06 | 0.19 |
| 2002.75 | 0.14 | 0.07 | 0.20 |
| 2003 | 0.12 | 0.06 | 0.18 |
| 2003.25 | 0.12 | 0.06 | 0.17 |
| 2003.5 | 0.11 | 0.06 | 0.17 |
| 2003.75 | 0.12 | 0.07 | 0.17 |
| 2004 | 0.12 | 0.07 | 0.17 |
| 2004.25 | 0.12 | 0.07 | 0.17 |
| 2004.5 | 0.12 | 0.07 | 0.18 |
| 2004.75 | 0.11 | 0.06 | 0.16 |
Figure 2: The Decline in Average Transport Costs and Tariffs for U.S. Imported Goods
Data for Figure 2
| Year | Total Trade Costs | Transport Costs | Duty Costs |
|---|---|---|---|
| 1980 | 11.102 | 4.554 | 6.548 |
| 1981 | 11.436 | 4.528 | 6.908 |
| 1982 | 10.630 | 4.448 | 6.182 |
| 1983 | 10.439 | 4.456 | 5.983 |
| 1984 | 10.459 | 4.658 | 5.801 |
| 1985 | 10.124 | 4.602 | 5.522 |
| 1986 | 8.882 | 4.019 | 4.863 |
| 1987 | 8.543 | 3.943 | 4.599 |
| 1988 | 8.051 | 3.516 | 4.535 |
| 1989 | 8.037 | 3.408 | 4.630 |
| 1990 | 7.965 | 3.380 | 4.585 |
| 1991 | 7.810 | 3.295 | 4.515 |
| 1992 | 7.520 | 3.194 | 4.326 |
| 1993 | 7.253 | 3.140 | 4.113 |
| 1994 | 6.932 | 3.033 | 3.898 |
| 1995 | 6.315 | 2.962 | 3.353 |
| 1996 | 5.713 | 2.638 | 3.075 |
| 1997 | 5.404 | 2.526 | 2.878 |
| 1998 | 5.335 | 2.638 | 2.697 |
| 1999 | 5.400 | 2.940 | 2.461 |
| 2000 | 5.345 | 2.977 | 2.368 |
| 2001 | 5.204 | 2.844 | 2.359 |
Figure 3: Growth in GDP per Employee in the United States and the Rest of the World
Data for Figure 3 - Growth in GDP per Employee for Selected Regions
| US | ROW | JA | EU | DA | LA |
|---|---|---|---|---|---|
| 1.63 | 3.07 | 1.89 | 1.55 | 4.62 | -0.16 |
Data for Figure 3 - GDP per Employee in the United States and ROW (1980 = 100)
| Year | US | ROW |
|---|---|---|
| 1980 | 100.00 | 100.00 |
| 1981 | 101.38 | 100.90 |
| 1982 | 100.35 | 102.18 |
| 1983 | 103.20 | 104.35 |
| 1984 | 106.31 | 107.99 |
| 1985 | 108.23 | 111.00 |
| 1986 | 109.45 | 113.33 |
| 1987 | 110.44 | 116.61 |
| 1988 | 112.55 | 120.67 |
| 1989 | 114.09 | 122.72 |
| 1990 | 114.67 | 125.23 |
| 1991 | 115.36 | 128.07 |
| 1992 | 118.29 | 132.24 |
| 1993 | 119.55 | 137.46 |
| 1994 | 121.42 | 143.51 |
| 1995 | 122.53 | 149.77 |
| 1996 | 125.16 | 155.47 |
| 1997 | 127.76 | 160.23 |
| 1998 | 131.01 | 162.23 |
| 1999 | 134.61 | 168.24 |
| 2000 | 137.54 | 175.47 |
| 2001 | 138.44 | 181.07 |
| 2002 | 141.39 | 189.71 |
| 2003 | 144.99 | 200.55 |
Figure 4: The Effect of the Intensive and Extensive Entry Margins on Pass-Through
Data for Figure 4 - Foreign Export Profits
| Percentage of Exporting Firms | Fixed Cost | Initial Values | New Values | New Values (Only Foreign Exporter Entry) |
|---|---|---|---|---|
| 0.11 | 0.17 | 0.20 | 0.35 | 0.38 |
| 0.11 | 0.17 | 0.20 | 0.35 | 0.38 |
| 0.11 | 0.18 | 0.19 | 0.35 | 0.38 |
| 0.11 | 0.18 | 0.19 | 0.34 | 0.38 |
| 0.11 | 0.18 | 0.19 | 0.34 | 0.37 |
| 0.12 | 0.18 | 0.18 | 0.34 | 0.37 |
| 0.12 | 0.19 | 0.18 | 0.34 | 0.37 |
| 0.12 | 0.19 | 0.18 | 0.34 | 0.37 |
| 0.12 | 0.19 | 0.17 | 0.34 | 0.37 |
| 0.12 | 0.19 | 0.17 | 0.34 | 0.37 |
| 0.12 | 0.20 | 0.17 | 0.34 | 0.37 |
| 0.12 | 0.20 | 0.17 | 0.34 | 0.37 |
| 0.12 | 0.20 | 0.16 | 0.33 | 0.37 |
| 0.12 | 0.20 | 0.16 | 0.33 | 0.36 |
| 0.12 | 0.20 | 0.16 | 0.33 | 0.36 |
| 0.13 | 0.21 | 0.15 | 0.33 | 0.36 |
| 0.13 | 0.21 | 0.15 | 0.33 | 0.36 |
| 0.13 | 0.21 | 0.15 | 0.33 | 0.36 |
| 0.13 | 0.21 | 0.15 | 0.33 | 0.36 |
| 0.13 | 0.22 | 0.14 | 0.33 | 0.36 |
| 0.13 | 0.22 | 0.14 | 0.33 | 0.36 |
| 0.13 | 0.22 | 0.14 | 0.32 | 0.36 |
| 0.13 | 0.22 | 0.14 | 0.32 | 0.35 |
| 0.13 | 0.23 | 0.14 | 0.32 | 0.35 |
| 0.13 | 0.23 | 0.13 | 0.32 | 0.35 |
| 0.14 | 0.23 | 0.13 | 0.32 | 0.35 |
| 0.14 | 0.23 | 0.13 | 0.32 | 0.35 |
| 0.14 | 0.24 | 0.13 | 0.32 | 0.35 |
| 0.14 | 0.24 | 0.13 | 0.32 | 0.35 |
| 0.14 | 0.24 | 0.12 | 0.32 | 0.35 |
| 0.14 | 0.25 | 0.12 | 0.32 | 0.35 |
| 0.14 | 0.25 | 0.12 | 0.31 | 0.34 |
| 0.14 | 0.25 | 0.12 | 0.31 | 0.34 |
| 0.14 | 0.25 | 0.12 | 0.31 | 0.34 |
| 0.14 | 0.26 | 0.11 | 0.31 | 0.34 |
| 0.15 | 0.26 | 0.11 | 0.31 | 0.34 |
| 0.15 | 0.26 | 0.11 | 0.31 | 0.34 |
| 0.15 | 0.26 | 0.11 | 0.31 | 0.34 |
| 0.15 | 0.27 | 0.11 | 0.31 | 0.34 |
| 0.15 | 0.27 | 0.11 | 0.31 | 0.34 |
| 0.15 | 0.27 | 0.10 | 0.30 | 0.33 |
| 0.15 | 0.28 | 0.10 | 0.30 | 0.33 |
| 0.15 | 0.28 | 0.10 | 0.30 | 0.33 |
| 0.15 | 0.28 | 0.10 | 0.30 | 0.33 |
| 0.15 | 0.28 | 0.10 | 0.30 | 0.33 |
| 0.16 | 0.29 | 0.10 | 0.30 | 0.33 |
| 0.16 | 0.29 | 0.10 | 0.30 | 0.33 |
| 0.16 | 0.29 | 0.09 | 0.30 | 0.33 |
| 0.16 | 0.30 | 0.09 | 0.30 | 0.33 |
| 0.16 | 0.30 | 0.09 | 0.30 | 0.32 |
| 0.16 | 0.30 | 0.09 | 0.29 | 0.32 |
| 0.16 | 0.31 | 0.09 | 0.29 | 0.32 |
| 0.16 | 0.31 | 0.09 | 0.29 | 0.32 |
| 0.16 | 0.31 | 0.09 | 0.29 | 0.32 |
| 0.16 | 0.32 | 0.09 | 0.29 | 0.32 |
| 0.17 | 0.32 | 0.08 | 0.29 | 0.32 |
| 0.17 | 0.32 | 0.08 | 0.29 | 0.32 |
| 0.17 | 0.33 | 0.08 | 0.29 | 0.32 |
| 0.17 | 0.33 | 0.08 | 0.29 | 0.32 |
| 0.17 | 0.33 | 0.08 | 0.29 | 0.31 |
| 0.17 | 0.34 | 0.08 | 0.28 | 0.31 |
Data for Figure 4 - Import Share
| Percentage of Exporting Firms | Initial Values | New Values | New Values (Only Foreign Exporter Entry) |
|---|---|---|---|
| 0.11 | 0.10 | 0.10 | 0.10 |
| 0.11 | 0.10 | 0.10 | 0.10 |
| 0.11 | 0.10 | 0.10 | 0.10 |
| 0.11 | 0.10 | 0.10 | 0.10 |
| 0.11 | 0.10 | 0.11 | 0.11 |
| 0.12 | 0.10 | 0.11 | 0.11 |
| 0.12 | 0.10 | 0.11 | 0.11 |
| 0.12 | 0.10 | 0.11 | 0.11 |
| 0.12 | 0.10 | 0.11 | 0.11 |
| 0.12 | 0.10 | 0.11 | 0.11 |
| 0.12 | 0.10 | 0.11 | 0.11 |
| 0.12 | 0.10 | 0.11 | 0.11 |
| 0.12 | 0.10 | 0.11 | 0.11 |
| 0.12 | 0.10 | 0.11 | 0.11 |
| 0.12 | 0.10 | 0.11 | 0.11 |
| 0.13 | 0.11 | 0.11 | 0.11 |
| 0.13 | 0.11 | 0.12 | 0.12 |
| 0.13 | 0.11 | 0.12 | 0.12 |
| 0.13 | 0.11 | 0.12 | 0.12 |
| 0.13 | 0.11 | 0.12 | 0.12 |
| 0.13 | 0.11 | 0.12 | 0.12 |
| 0.13 | 0.11 | 0.12 | 0.12 |
| 0.13 | 0.11 | 0.12 | 0.12 |
| 0.13 | 0.11 | 0.12 | 0.12 |
| 0.13 | 0.11 | 0.12 | 0.12 |
| 0.14 | 0.11 | 0.12 | 0.12 |
| 0.14 | 0.11 | 0.12 | 0.12 |
| 0.14 | 0.11 | 0.12 | 0.12 |
| 0.14 | 0.11 | 0.12 | 0.13 |
| 0.14 | 0.11 | 0.13 | 0.13 |
| 0.14 | 0.11 | 0.13 | 0.13 |
| 0.14 | 0.11 | 0.13 | 0.13 |
| 0.14 | 0.11 | 0.13 | 0.13 |
| 0.14 | 0.11 | 0.13 | 0.13 |
| 0.14 | 0.11 | 0.13 | 0.13 |
| 0.15 | 0.12 | 0.13 | 0.13 |
| 0.15 | 0.12 | 0.13 | 0.13 |
| 0.15 | 0.12 | 0.13 | 0.13 |
| 0.15 | 0.12 | 0.13 | 0.13 |
| 0.15 | 0.12 | 0.13 | 0.13 |
| 0.15 | 0.12 | 0.13 | 0.13 |
| 0.15 | 0.12 | 0.13 | 0.14 |
| 0.15 | 0.12 | 0.14 | 0.14 |
| 0.15 | 0.12 | 0.14 | 0.14 |
| 0.15 | 0.12 | 0.14 | 0.14 |
| 0.16 | 0.12 | 0.14 | 0.14 |
| 0.16 | 0.12 | 0.14 | 0.14 |
| 0.16 | 0.12 | 0.14 | 0.14 |
| 0.16 | 0.12 | 0.14 | 0.14 |
| 0.16 | 0.12 | 0.14 | 0.14 |
| 0.16 | 0.12 | 0.14 | 0.14 |
| 0.16 | 0.12 | 0.14 | 0.14 |
| 0.16 | 0.12 | 0.14 | 0.14 |
| 0.16 | 0.12 | 0.14 | 0.14 |
| 0.16 | 0.12 | 0.14 | 0.15 |
| 0.17 | 0.12 | 0.15 | 0.15 |
| 0.17 | 0.12 | 0.15 | 0.15 |
| 0.17 | 0.12 | 0.15 | 0.15 |
| 0.17 | 0.12 | 0.15 | 0.15 |
| 0.17 | 0.12 | 0.15 | 0.15 |
| 0.17 | 0.12 | 0.15 | 0.15 |
Data for Figure 4 - Foreign Exporter Markup
| Percentage of Exporting Firms | Initial Values | New Values | New Values (Only Foreign Exporter Entry) |
|---|---|---|---|
| 0.11 | 1.21 | 1.43 | 1.47 |
| 0.11 | 1.21 | 1.43 | 1.47 |
| 0.11 | 1.21 | 1.43 | 1.47 |
| 0.11 | 1.21 | 1.43 | 1.47 |
| 0.11 | 1.20 | 1.42 | 1.47 |
| 0.12 | 1.20 | 1.42 | 1.46 |
| 0.12 | 1.20 | 1.42 | 1.46 |
| 0.12 | 1.20 | 1.42 | 1.46 |
| 0.12 | 1.19 | 1.42 | 1.46 |
| 0.12 | 1.19 | 1.42 | 1.46 |
| 0.12 | 1.19 | 1.42 | 1.46 |
| 0.12 | 1.19 | 1.42 | 1.46 |
| 0.12 | 1.19 | 1.42 | 1.46 |
| 0.12 | 1.18 | 1.42 | 1.46 |
| 0.12 | 1.18 | 1.41 | 1.45 |
| 0.13 | 1.18 | 1.41 | 1.45 |
| 0.13 | 1.18 | 1.41 | 1.45 |
| 0.13 | 1.17 | 1.41 | 1.45 |
| 0.13 | 1.17 | 1.41 | 1.45 |
| 0.13 | 1.17 | 1.41 | 1.45 |
| 0.13 | 1.17 | 1.41 | 1.45 |
| 0.13 | 1.17 | 1.41 | 1.45 |
| 0.13 | 1.17 | 1.41 | 1.45 |
| 0.13 | 1.16 | 1.41 | 1.44 |
| 0.13 | 1.16 | 1.40 | 1.44 |
| 0.14 | 1.16 | 1.40 | 1.44 |
| 0.14 | 1.16 | 1.40 | 1.44 |
| 0.14 | 1.16 | 1.40 | 1.44 |
| 0.14 | 1.15 | 1.40 | 1.44 |
| 0.14 | 1.15 | 1.40 | 1.44 |
| 0.14 | 1.15 | 1.40 | 1.44 |
| 0.14 | 1.15 | 1.40 | 1.44 |
| 0.14 | 1.15 | 1.40 | 1.43 |
| 0.14 | 1.15 | 1.40 | 1.43 |
| 0.14 | 1.15 | 1.39 | 1.43 |
| 0.15 | 1.14 | 1.39 | 1.43 |
| 0.15 | 1.14 | 1.39 | 1.43 |
| 0.15 | 1.14 | 1.39 | 1.43 |
| 0.15 | 1.14 | 1.39 | 1.43 |
| 0.15 | 1.14 | 1.39 | 1.43 |
| 0.15 | 1.14 | 1.39 | 1.43 |
| 0.15 | 1.14 | 1.39 | 1.43 |
| 0.15 | 1.13 | 1.39 | 1.42 |
| 0.15 | 1.13 | 1.39 | 1.42 |
| 0.15 | 1.13 | 1.38 | 1.42 |
| 0.16 | 1.13 | 1.38 | 1.42 |
| 0.16 | 1.13 | 1.38 | 1.42 |
| 0.16 | 1.13 | 1.38 | 1.42 |
| 0.16 | 1.13 | 1.38 | 1.42 |
| 0.16 | 1.13 | 1.38 | 1.42 |
| 0.16 | 1.13 | 1.38 | 1.42 |
| 0.16 | 1.12 | 1.38 | 1.42 |
| 0.16 | 1.12 | 1.38 | 1.41 |
| 0.16 | 1.12 | 1.38 | 1.41 |
| 0.16 | 1.12 | 1.38 | 1.41 |
| 0.17 | 1.12 | 1.37 | 1.41 |
| 0.17 | 1.12 | 1.37 | 1.41 |
| 0.17 | 1.12 | 1.37 | 1.41 |
| 0.17 | 1.12 | 1.37 | 1.41 |
| 0.17 | 1.12 | 1.37 | 1.41 |
| 0.17 | 1.11 | 1.37 | 1.41 |
Data for Figure 4 - Domestic Firm Markup
| Percentage of Exporting Firms | Initial Values | New Values | New Values (Only Foreign Exporter Entry) |
|---|---|---|---|
| 0.11 | 1.26 | 1.25 | 1.24 |
| 0.11 | 1.26 | 1.25 | 1.24 |
| 0.11 | 1.26 | 1.25 | 1.24 |
| 0.11 | 1.26 | 1.25 | 1.24 |
| 0.11 | 1.27 | 1.25 | 1.24 |
| 0.12 | 1.27 | 1.25 | 1.24 |
| 0.12 | 1.27 | 1.25 | 1.24 |
| 0.12 | 1.27 | 1.25 | 1.24 |
| 0.12 | 1.27 | 1.25 | 1.24 |
| 0.12 | 1.27 | 1.25 | 1.24 |
| 0.12 | 1.27 | 1.25 | 1.24 |
| 0.12 | 1.27 | 1.25 | 1.24 |
| 0.12 | 1.27 | 1.25 | 1.24 |
| 0.12 | 1.27 | 1.25 | 1.24 |
| 0.12 | 1.27 | 1.25 | 1.24 |
| 0.13 | 1.27 | 1.25 | 1.24 |
| 0.13 | 1.27 | 1.25 | 1.24 |
| 0.13 | 1.27 | 1.25 | 1.24 |
| 0.13 | 1.27 | 1.25 | 1.24 |
| 0.13 | 1.27 | 1.25 | 1.24 |
| 0.13 | 1.27 | 1.25 | 1.24 |
| 0.13 | 1.28 | 1.25 | 1.24 |
| 0.13 | 1.28 | 1.25 | 1.24 |
| 0.13 | 1.28 | 1.25 | 1.24 |
| 0.13 | 1.28 | 1.25 | 1.24 |
| 0.14 | 1.28 | 1.25 | 1.24 |
| 0.14 | 1.28 | 1.24 | 1.24 |
| 0.14 | 1.28 | 1.24 | 1.24 |
| 0.14 | 1.28 | 1.24 | 1.24 |
| 0.14 | 1.28 | 1.24 | 1.24 |
| 0.14 | 1.28 | 1.24 | 1.24 |
| 0.14 | 1.28 | 1.24 | 1.24 |
| 0.14 | 1.28 | 1.24 | 1.24 |
| 0.14 | 1.28 | 1.24 | 1.24 |
| 0.14 | 1.29 | 1.24 | 1.24 |
| 0.15 | 1.29 | 1.24 | 1.24 |
| 0.15 | 1.29 | 1.24 | 1.24 |
| 0.15 | 1.29 | 1.24 | 1.24 |
| 0.15 | 1.29 | 1.24 | 1.24 |
| 0.15 | 1.29 | 1.24 | 1.24 |
| 0.15 | 1.29 | 1.24 | 1.24 |
| 0.15 | 1.29 | 1.24 | 1.24 |
| 0.15 | 1.29 | 1.24 | 1.24 |
| 0.15 | 1.29 | 1.24 | 1.24 |
| 0.15 | 1.29 | 1.24 | 1.24 |
| 0.16 | 1.29 | 1.24 | 1.24 |
| 0.16 | 1.30 | 1.24 | 1.24 |
| 0.16 | 1.30 | 1.24 | 1.24 |
| 0.16 | 1.30 | 1.24 | 1.24 |
| 0.16 | 1.30 | 1.24 | 1.24 |
| 0.16 | 1.30 | 1.24 | 1.24 |
| 0.16 | 1.30 | 1.24 | 1.24 |
| 0.16 | 1.30 | 1.24 | 1.24 |
| 0.16 | 1.30 | 1.24 | 1.24 |
| 0.16 | 1.30 | 1.24 | 1.24 |
| 0.17 | 1.30 | 1.24 | 1.24 |
| 0.17 | 1.30 | 1.24 | 1.24 |
| 0.17 | 1.31 | 1.24 | 1.24 |
| 0.17 | 1.31 | 1.24 | 1.24 |
| 0.17 | 1.31 | 1.24 | 1.24 |
| 0.17 | 1.31 | 1.24 | 1.24 |
Data for Figure 4 - Direct Pass-Through
| Percentage of Exporting Firms | Initial Values | New Values | New Values (Only Foreign Exporter Entry) |
|---|---|---|---|
| 0.11 | 0.47 | 0.34 | 0.32 |
| 0.11 | 0.47 | 0.34 | 0.32 |
| 0.11 | 0.47 | 0.34 | 0.32 |
| 0.11 | 0.47 | 0.34 | 0.32 |
| 0.11 | 0.48 | 0.34 | 0.32 |
| 0.12 | 0.48 | 0.34 | 0.33 |
| 0.12 | 0.48 | 0.34 | 0.33 |
| 0.12 | 0.48 | 0.34 | 0.33 |
| 0.12 | 0.48 | 0.34 | 0.33 |
| 0.12 | 0.49 | 0.34 | 0.33 |
| 0.12 | 0.49 | 0.34 | 0.33 |
| 0.12 | 0.49 | 0.34 | 0.33 |
| 0.12 | 0.49 | 0.35 | 0.33 |
| 0.12 | 0.49 | 0.35 | 0.33 |
| 0.12 | 0.50 | 0.35 | 0.33 |
| 0.13 | 0.50 | 0.35 | 0.33 |
| 0.13 | 0.50 | 0.35 | 0.33 |
| 0.13 | 0.50 | 0.35 | 0.33 |
| 0.13 | 0.50 | 0.35 | 0.33 |
| 0.13 | 0.51 | 0.35 | 0.33 |
| 0.13 | 0.51 | 0.35 | 0.33 |
| 0.13 | 0.51 | 0.35 | 0.33 |
| 0.13 | 0.51 | 0.35 | 0.33 |
| 0.13 | 0.51 | 0.35 | 0.33 |
| 0.13 | 0.51 | 0.35 | 0.33 |
| 0.14 | 0.52 | 0.35 | 0.33 |
| 0.14 | 0.52 | 0.35 | 0.33 |
| 0.14 | 0.52 | 0.35 | 0.33 |
| 0.14 | 0.52 | 0.35 | 0.34 |
| 0.14 | 0.52 | 0.35 | 0.34 |
| 0.14 | 0.52 | 0.35 | 0.34 |
| 0.14 | 0.53 | 0.35 | 0.34 |
| 0.14 | 0.53 | 0.35 | 0.34 |
| 0.14 | 0.53 | 0.35 | 0.34 |
| 0.14 | 0.53 | 0.36 | 0.34 |
| 0.15 | 0.53 | 0.36 | 0.34 |
| 0.15 | 0.53 | 0.36 | 0.34 |
| 0.15 | 0.54 | 0.36 | 0.34 |
| 0.15 | 0.54 | 0.36 | 0.34 |
| 0.15 | 0.54 | 0.36 | 0.34 |
| 0.15 | 0.54 | 0.36 | 0.34 |
| 0.15 | 0.54 | 0.36 | 0.34 |
| 0.15 | 0.54 | 0.36 | 0.34 |
| 0.15 | 0.54 | 0.36 | 0.34 |
| 0.15 | 0.55 | 0.36 | 0.34 |
| 0.16 | 0.55 | 0.36 | 0.34 |
| 0.16 | 0.55 | 0.36 | 0.34 |
| 0.16 | 0.55 | 0.36 | 0.34 |
| 0.16 | 0.55 | 0.36 | 0.34 |
| 0.16 | 0.55 | 0.36 | 0.34 |
| 0.16 | 0.55 | 0.36 | 0.35 |
| 0.16 | 0.55 | 0.36 | 0.35 |
| 0.16 | 0.56 | 0.36 | 0.35 |
| 0.16 | 0.56 | 0.36 | 0.35 |
| 0.16 | 0.56 | 0.36 | 0.35 |
| 0.17 | 0.56 | 0.36 | 0.35 |
| 0.17 | 0.56 | 0.37 | 0.35 |
| 0.17 | 0.56 | 0.37 | 0.35 |
| 0.17 | 0.56 | 0.37 | 0.35 |
| 0.17 | 0.56 | 0.37 | 0.35 |
| 0.17 | 0.57 | 0.37 | 0.35 |
Data for Figure 4 - General Equilibrium Pass-Through
| Percentage of Exporting Firms | Initial Values | New Values | New Values (Only Foreign Exporter Entry) |
|---|---|---|---|
| 0.11 | 0.54 | 0.38 | 0.40 |
| 0.11 | 0.54 | 0.39 | 0.40 |
| 0.11 | 0.54 | 0.39 | 0.40 |
| 0.11 | 0.55 | 0.39 | 0.40 |
| 0.11 | 0.55 | 0.39 | 0.40 |
| 0.12 | 0.55 | 0.39 | 0.40 |
| 0.12 | 0.55 | 0.39 | 0.40 |
| 0.12 | 0.55 | 0.39 | 0.40 |
| 0.12 | 0.56 | 0.39 | 0.40 |
| 0.12 | 0.56 | 0.39 | 0.40 |
| 0.12 | 0.56 | 0.39 | 0.40 |
| 0.12 | 0.56 | 0.39 | 0.40 |
| 0.12 | 0.56 | 0.39 | 0.40 |
| 0.12 | 0.56 | 0.39 | 0.40 |
| 0.12 | 0.57 | 0.39 | 0.40 |
| 0.13 | 0.57 | 0.39 | 0.40 |
| 0.13 | 0.57 | 0.39 | 0.40 |
| 0.13 | 0.57 | 0.39 | 0.40 |
| 0.13 | 0.57 | 0.39 | 0.40 |
| 0.13 | 0.58 | 0.39 | 0.40 |
| 0.13 | 0.58 | 0.39 | 0.40 |
| 0.13 | 0.58 | 0.39 | 0.40 |
| 0.13 | 0.58 | 0.39 | 0.40 |
| 0.13 | 0.58 | 0.39 | 0.40 |
| 0.13 | 0.58 | 0.39 | 0.41 |
| 0.14 | 0.59 | 0.39 | 0.41 |
| 0.14 | 0.59 | 0.39 | 0.41 |
| 0.14 | 0.59 | 0.39 | 0.41 |
| 0.14 | 0.59 | 0.39 | 0.41 |
| 0.14 | 0.59 | 0.40 | 0.41 |
| 0.14 | 0.59 | 0.40 | 0.41 |
| 0.14 | 0.60 | 0.40 | 0.41 |
| 0.14 | 0.60 | 0.40 | 0.41 |
| 0.14 | 0.60 | 0.40 | 0.41 |
| 0.14 | 0.60 | 0.40 | 0.41 |
| 0.15 | 0.60 | 0.40 | 0.41 |
| 0.15 | 0.60 | 0.40 | 0.41 |
| 0.15 | 0.60 | 0.40 | 0.41 |
| 0.15 | 0.61 | 0.40 | 0.41 |
| 0.15 | 0.61 | 0.40 | 0.41 |
| 0.15 | 0.61 | 0.40 | 0.41 |
| 0.15 | 0.61 | 0.40 | 0.41 |
| 0.15 | 0.61 | 0.40 | 0.41 |
| 0.15 | 0.61 | 0.40 | 0.41 |
| 0.15 | 0.61 | 0.40 | 0.41 |
| 0.16 | 0.61 | 0.40 | 0.41 |
| 0.16 | 0.62 | 0.40 | 0.41 |
| 0.16 | 0.62 | 0.40 | 0.41 |
| 0.16 | 0.62 | 0.40 | 0.41 |
| 0.16 | 0.62 | 0.40 | 0.41 |
| 0.16 | 0.62 | 0.40 | 0.41 |
| 0.16 | 0.62 | 0.40 | 0.41 |
| 0.16 | 0.62 | 0.40 | 0.41 |
| 0.16 | 0.62 | 0.40 | 0.41 |
| 0.16 | 0.63 | 0.40 | 0.42 |
| 0.17 | 0.63 | 0.40 | 0.42 |
| 0.17 | 0.63 | 0.41 | 0.42 |
| 0.17 | 0.63 | 0.41 | 0.42 |
| 0.17 | 0.63 | 0.41 | 0.42 |
| 0.17 | 0.63 | 0.41 | 0.42 |
| 0.17 | 0.63 | 0.41 | 0.42 |
Footnotes
1. The views expressed in this paper are solely the responsibility of the authors and should not be interpreted as reflecting the views of the Board of Governors of the Federal Reserve System, the Federal Reserve Bank of San Francisco or of any other person associated with the Federal Reserve System. Return to text
2. Federal Reserve Board. Email: [email protected]. Return to text
3. Federal Reserve Bank of San Francisco. Email: [email protected]. Return to text
4. Federal Reserve Board. Email: [email protected]. Return to text
5. When estimating pass-through, Marazzi, Sheets, and Vigfusson (2005) control for movements in marginal costs using foreign CPIs and commodity prices. The results are also similar if different control variables are used. For instance, pass-through declines to the same extent when unit labor costs and domestic output are respectively used to control for changes in marginal costs and import demand, as in Campa and Goldberg (2004). Return to text
6. This decline in pass-through is most evident for finished goods. The decline in pass-through for total imports is smaller and less precisely estimated. Return to text
7. The fact that tariff and transport costs have been declining throughout the post-war period yields the implication in our model that, other things equal, exchange-rate pass-through to import prices should have declined throughout the post-war period. Unfortunately, our measure of import prices for finished goods industries does not extend back far enough to investigate this possibility. Return to text
8. Using different datasets and methodologies, Rauch (1999), Coe, Subramanian, Tamirisa, and Bhavnani (2002), and Brun, Carrere, Guillaumont, and de Melo (2005) find that trade costs have fallen continuously since the 1970s. On the other hand, Frankel (1997) and Berthelon and Freund (2004) find no evidence of a significant decline in trade costs. Return to text
9. Although we would prefer a more disaggregated measure, we focus on productivity at the aggregate level due to data limitations for developing countries. Return to text
10. More
specifically, with ![]() , our demand aggregator
can be thought of as the combination of a Dixit-Stiglitz and
Armington aggregator. To see this, note that in this case we can
rewrite our aggregator as:
, our demand aggregator
can be thought of as the combination of a Dixit-Stiglitz and
Armington aggregator. To see this, note that in this case we can
rewrite our aggregator as:
![$\displaystyle C_{t}=(1+\omega _{t}^{*})\left[ \frac{1}{1+\omega _{t}^{*}}C_{dt}^{\frac{ \gamma }{\rho }}+\frac{\omega _{t}^{*}}{1+\omega _{t}^{*}}C_{mt}^{\frac{ \gamma }{\rho }}\right] ^{\frac{\rho }{\gamma }},$](img55.gif) |
where
 and
and
 . As in Bergin and Glick (2007), our specification of the demand aggregator
also rules out the '' love of variety'' effect. However, a change
in
. As in Bergin and Glick (2007), our specification of the demand aggregator
also rules out the '' love of variety'' effect. However, a change
in
![]() does increase the number of
foreign varieties relative to home varieties in the consumption
bundle, and thus '' home'' bias in household preferences is
endogenously determined in the model. Return to text
does increase the number of
foreign varieties relative to home varieties in the consumption
bundle, and thus '' home'' bias in household preferences is
endogenously determined in the model. Return to text
11. The
consumer price level can be derived from equating equation
(4) to
![]() and substituting in the relative
demand curves. The price
and substituting in the relative
demand curves. The price
![]() can be derived from substituting
the relative demand curves into equation (5).
Return to text
can be derived from substituting
the relative demand curves into equation (5).
Return to text
12. In our environment with variable markups, heterogeneity in the technologies of firms would considerably complicate the analysis, since computing aggregate prices and quantities would involve accounting for a distribution of markups. In contrast, because the fixed cost does not affect a firm's marginal pricing condition, we can still analyze a symmetric equilibrium in which all firms who decide to export choose the same price and markup. Return to text
13. This
assumption is not critical for our analysis. We assume that
![]() is stochastic mainly to illustrate how
pass-through differs depending on the type of shock.
Return to text
is stochastic mainly to illustrate how
pass-through differs depending on the type of shock.
Return to text
14. With
![]() the demand curve is less convex
than the CES case. Return to
text
the demand curve is less convex
than the CES case. Return to
text
15. While the level of foreign productivity is actually lower than U.S. productivity, for simplicity we begin with a calibration in which the two economies are identical. This simplification seems reasonable, since our results for the decline in pass-through depend critically on the change in relative productivity in the two countries rather than their initial levels. Return to text
16. In the initial steady state, each country's net foreign asset position is zero. Given this initial position, we then allow a country's net foreign asset position to respond endogenously in the second steady state to the deterministic change in trade costs and foreign productivity. Return to text
17. We define the aggregate trade-price elasticity by differentiating aggregate import demand:
![$\displaystyle \omega^*_t C_{mt} = \frac{\omega^*_t}{1+\omega^*_t}\left[\frac{1}{1+\eta} \left(\frac{P_{mt}}{\Gamma_t}\right)^{\frac{\rho}{\gamma-\rho}} + \frac{\eta }{1+\eta}\right]C_t,$](img148.gif) |
with respect to
![]() holding
holding ![]() and
and
![]() constant. With
constant. With ![]() in our benchmark calibration, this aggregate
elasticity is lower than the elasticity of demand for individual
good i,
in our benchmark calibration, this aggregate
elasticity is lower than the elasticity of demand for individual
good i,
![]() . Return to text
. Return to text
18. See Bergin and Feenstra (2001) for a discussion of how the interaction of NCES demand curves with sticky prices denominated in local currency can be helpful in accounting for exchange rate dynamics. Return to text
19. More details on the theoretical link between trade integration and pass-through can be found in Gust, Leduc, and Vigfusson (2010). Return to text
20. In
recent years, U.S. producers have experienced increased profits. If
we allowed U.S. productivity to rise as in Figure 3 instead of
fixing ![]() in both steady states, U.S. profits
would also rise despite a fall in domestic markups of U.S
producers. Return to
text
in both steady states, U.S. profits
would also rise despite a fall in domestic markups of U.S
producers. Return to
text
This version is optimized for use by screen readers. Descriptions for all mathematical expressions are provided in LaTex format. A printable pdf version is available. Return to text