

Profits and Balance Sheet Developments at U.S. Commercial Banks in 2008
Morten L. Bech and Tara Rice, of the Board's Division of Monetary Affairs, prepared this article. Thomas C. Allard and Mary E. Muething assisted in developing the database underlying much of the analysis. Zénide Avellaneda and Robert Kurtzman provided research assistance.
The continued fallout from the ongoing financial turmoil and the economic downturn weighed heavily on the performance of the U.S. commercial banking industry in 2008.1 As house prices continued to decline, the performance of mortgage-related assets deteriorated further, and, with the onset of recession, credit problems spread to other asset classes and to a wider range of financial institutions. Delinquent loans (those whose payments are 30 days or more past due) on banks' books continued to mount in all major loan categories, particularly among residential mortgages and construction and land development loans related to residential projects. Sizable losses and write-downs deepened concerns about the condition of some very large financial institutions, including some of their large commercial bank subsidiaries. When the financial strains intensified in the second half of 2008, the ensuing turmoil in global credit markets contributed to a steep decline in economic activity late in the year. At the same time, interest rate spreads on a wide range of private debt instruments widened further, and the functioning of many credit markets was, at times, significantly impaired. Credit default swap (CDS) premiums for banking organizations, which reflect investors' assessments of the likelihood of a default, shot up.2 The stock prices of bank holding companies (BHCs) fell steeply for the year, underperforming the overall market by a wide margin.
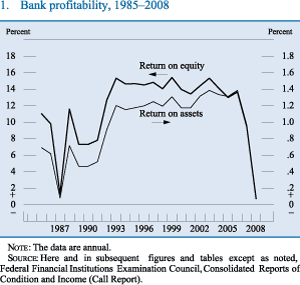
Against this backdrop, the net income of the commercial banking industry contracted substantially in 2008, and the industry return on equity for the full year fell to less than 1 percent (figure 1). Industry profits were particularly hard hit in the fourth quarter, when banks in all size groups experienced losses. The primary drivers of the profitability slump were sizable provisions for loan losses in response to further deterioration in asset quality, goodwill impairment losses, heavy write-downs on securities holdings, and a sharp drop in trading revenue. For the year as a whole, losses were especially acute at some of the largest commercial banks.
The ongoing financial turmoil resulted in a steady stream of acquisitions and reorganizations in 2008, as financial institutions failed or required government assistance amid growing losses on mortgage-related and other assets. In March, a liquidity crisis at The Bear Stearns Companies, Inc., a major investment bank, led to its acquisition (with government assistance) by JPMorgan Chase & Co. In July, Countrywide Financial Corporation, a thrift institution and the largest U.S. mortgage originator, was acquired by Bank of America Corporation. In addition, the failure that month of IndyMac Bank, F.S.B., a large thrift institution, raised further concerns about the profitability and asset quality of financial institutions. The failure also raised depositors' concerns about the safety of deposits held by banks.
In early September, the Treasury Department and the Federal Housing Finance Agency announced that the housing-related government-sponsored enterprises (GSEs), Fannie Mae and Freddie Mac, had been placed into conservatorship. The GSEs' equity prices dropped considerably in response, and, as a result, many smaller banks that held sizable amounts of the preferred stock of the two GSEs had to recognize substantial losses in the third quarter. Amid plummeting investor confidence, and after posting sizable losses, several large nonbank financial institutions came under extreme pressure: Lehman Brothers Holdings filed for bankruptcy on September 15, 2008; during the same tumultuous period, Bank of America announced its intention to acquire Merrill Lynch & Co., Inc.; the Federal Reserve, with the full support of the Treasury, agreed to provide liquidity support to American International Group, Inc., or AIG; and the Federal Reserve approved the applications by Goldman Sachs Group, Inc., and Morgan Stanley to become BHCs.3 Upon its collapse on September 25, 2008, Washington Mutual Bank, a large thrift institution, became the largest failure ever of a financial institution in the United States; its stakeholders absorbed significant losses.4 Soon after, Wachovia Corporation, the fourth-largest commercial bank at the time, experienced acute funding pressures and agreed to merge with Wells Fargo & Company. In addition, a number of smaller banks, many located in states that had experienced the largest house price fluctuations in recent years (most notably California, Florida, Georgia, and Nevada), failed in 2008. At year-end, the total number of banking institution failures reached 25, the highest since 1993. The list of problem banks compiled by the Federal Deposit Insurance Corporation (FDIC) reached 252 banking institutions, with combined assets of $159 billion. Through mid-April of 2009, an additional 25 banking institutions had failed.
In mid-September, in large part because of losses on Lehman Brothers' debt, the net asset value of a prominent money market mutual fund fell below $1 per share--a development known as "breaking the buck"--a rare event that had not occurred in many years. Investors responded with massive withdrawals from prime money market mutual funds, which hold substantial amounts of commercial paper. These outflows severely undermined the stability of short-term funding markets, upon which many large corporations rely heavily to meet their short-term borrowing needs. As a result, many financial and nonfinancial firms turned to their backup lines of credit at commercial banks for funding.
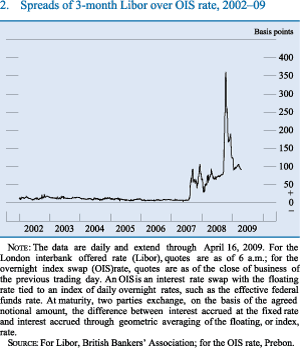
In response to the pressures on financial institutions and the associated uncertainty about their financial condition, banks and investors pulled back from risk-taking even further last fall, and conditions across most financial markets deteriorated sharply. With banks reluctant to lend to one another, the cost of borrowing in the interbank market--as exemplified by the London interbank offered rate, or Libor, a reference rate for a wide variety of contracts, including floating-rate mortgages--increased appreciably (figure 2). Securitization markets, with the exception of those for government-supported mortgages, essentially shut down, boosting the unanticipated demand for funds from commercial banks.
In an attempt to restore liquidity and stability to the U.S. financial system in general and the banking system in particular, public authorities took a number of unprecedented actions during 2008.5 To address elevated pressures in a number of funding markets, the Federal Reserve augmented many of its existing lending facilities. As demand for dollar funding rose further over the course of 2008, the Federal Reserve expanded and extended the term of both the Term Auction Facility (TAF), under which term funds are auctioned off to depository institutions against the wide variety of collateral that can be used to secure loans at the discount window, and the temporary reciprocal currency arrangements (swap lines) with the European Central Bank and the Swiss National Bank. In the fall of 2008, the formal quantity limits on these lines, as well as the swap lines that had been set up with the Bank of Japan and the Bank of England, were eliminated, and the Federal Reserve introduced new liquidity swap lines with 10 other central banks. At year-end 2008, $450 billion and $553 billion were outstanding under the TAF and the swap lines, respectively. Moreover, in several cases, the Federal Reserve Board granted exemptions from restrictions under section 23A of the Federal Reserve Act in an effort to allow banks greater scope to provide liquidity to their nonbank affiliates.
In addition, the Federal Reserve established several temporary lending facilities over the course of the year. In March 2008, to address increasing liquidity pressures in funding markets, the Federal Reserve established the Term Securities Lending Facility (TSLF). Under the TSLF, the Federal Reserve lends Treasury securities to primary dealers, and the lending is secured by a pledge of other securities. After the demise of Bear Stearns, the Federal Reserve created the Primary Dealer Credit Facility to improve the ability of primary dealers to provide financing to participants in securitization markets. In addition, the Federal Reserve lowered the spread between the primary credit rate at the discount window and the intended target for the effective federal funds rate to 25 basis points and temporarily allowed primary credit loans for terms of up to 90 days.
In September, the Treasury and the Federal Reserve took several steps to ease investor concerns about the money market mutual fund industry and support the functioning of the commercial paper market. The Treasury introduced an insurance program for money market mutual fund investors, and the Federal Reserve announced the creation of the Asset-Backed Commercial Paper Money Market Mutual Fund Liquidity Facility (AMLF) to extend nonrecourse loans to banks to finance their purchases of high-quality asset-backed commercial paper from money market mutual funds. The following month, the Commercial Paper Funding Facility was created to provide a liquidity backstop to U.S. issuers of commercial paper.6 Most Federal Reserve facilities have been extended through October 30, 2009.7
In October, the Congress passed the Emergency Economic Stabilization Act (EESA), a move that, among other things, created the $700 billion Troubled Asset Relief Program (TARP). The TARP was intended to reduce the strains in financial markets created by the substantial amount of illiquid structured securities and mortgages still held by banks. The EESA also raised basic deposit insurance coverage to $250,000 on a temporary basis. In addition, the FDIC announced the Temporary Liquidity Guarantee Program (TLGP), under which it provides guarantees of noninterest-bearing transaction deposits and selected newly issued senior unsecured obligations of participating banks.8 Shortly thereafter, the Treasury established the voluntary Capital Purchase Program (CPP), under which it has used TARP funds to inject about $200 billion of capital into U.S. banking organizations. In November, the U.S. government entered into an agreement with Citigroup, Inc., which provided the company--in exchange for preferred stock--with protection against the possibility of unusually large losses on an asset pool of loans and securities backed by residential and commercial real estate and other such assets. The Treasury provided another $20 billion of TARP capital to Citigroup as part of the same transaction.
Economic activity, the growth of which had slowed noticeably, on average, over the first three quarters of the year, contracted significantly in the final quarter of 2008, with nearly all major sectors of the economy registering steep declines in activity. At the same time, inflation pressures diminished appreciably as the margin of resource slack in the economy widened and commodity prices dropped considerably. In view of the implications of the substantial reduction in credit availability and the continuing deterioration in the economic outlook, the Federal Open Market Committee (FOMC) reduced the target federal funds rate from 4-1/2 percent at the end of 2007 to a range of 0 to 1/4 percent by the end of 2008 (figure 3). Moreover, at its December 2008 meeting, the FOMC indicated that economic conditions were likely to warrant exceptionally low levels of the federal funds rate for some time.
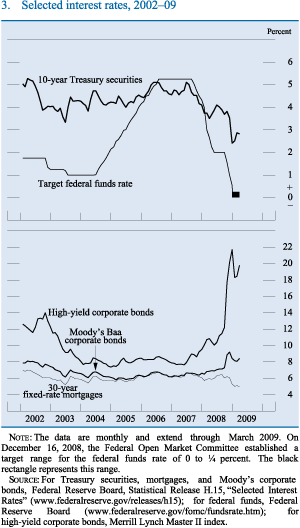
With monetary policy easing, the economy slowing, and inflation pressures abating, most interest rates moved lower over 2008. Money market rates generally followed the federal funds rate lower, though widened risk spreads in the Eurodollar and commercial paper markets muted the decline somewhat. Yields on Treasury coupon securities declined substantially, particularly late in the year, pressed lower, in part, by speculation that the Federal Reserve might begin purchasing large quantities of longer maturity Treasury securities. Interest rates on adjustable-and fixed-rate mortgages, while volatile, moved mostly sideways for the better part of 2008. However, rates on 30-year fixed-rate conforming mortgages fell about 100 basis points, on net, after the November 25, 2008, announcement of the Federal Reserve's program to purchase mortgage-backed securities (MBS) backed by the housing-related GSEs and Ginnie Mae. However, the spread between the rates for nonconforming jumbo fixed-rate loans and those for conforming mortgages widened further. As conditions in financial markets deteriorated in September and October, credit spreads on investment grade and high-yield corporate bonds, measured relative to yields on comparable-maturity Treasury securities, surged from already elevated levels.
The combination of financial turmoil and the downturn in economic activity exerted pressure on both sides of banks' balance sheets as institutions became more cautious in the extension of credit, saw losses deplete capital, and relied less on market sources of funding. In addition, the asset, liability, and capital positions of banks were materially affected by the policy actions taken by public authorities in response to the rapidly evolving financial and economic landscape. Total bank assets expanded about 10 percent in 2008, owing, in part, to the absorption of assets from nonbank financial firms; after taking into account a few of the largest structure events that occurred during the year, the expansion of total bank assets was only about 6 percent (see box "Adjustments to the Balance Sheet Data for Structure Activity"). The value of loans on the books of banks was essentially flat last year after accounting for major structure events. Residential real estate loans contracted, and other major loan categories, including commercial and industrial (C&I) loans, consumer loans, and commercial real estate (CRE) loans, grew modestly.
Adjustments to the Balance Sheet Data for Structure Activity
One consequence of the turmoil in financial markets in 2008 was a steady stream of acquisitions and reorganizations by major financial institutions. Such structure activity may or may not affect the aggregated commercial bank balance sheet data discussed in the main text of this article. In general, consolidation activity that involves only commercial banks would not impact aggregate industry assets. In contrast, consolidation of nonbank assets onto the books of commercial banks would increase the assets, as described in this article, of the commercial banking sector.
Several high-profile structure events involving some of the largest bank holding companies occurred in 2008.1 For example, in March, JPMorgan Chase & Co. acquired The Bear Stearns Companies, Inc., but as of year-end 2008, that consolidation occurred only at the holding company level and therefore did not directly affect the commercial bank aggregates reported in this article.2 But in September, JPMorgan Chase acquired the banking operations of Washington Mutual Bank, a thrift institution, causing banking industry assets and liabilities to jump.
In general, the effects of such bank-nonbank structure activity on bank balance sheet data do not reflect net asset creation or elimination. To better capture balance sheet growth in recent quarters that stems from continuing operations, the data shown in table A have been adjusted to remove the effects on the series that have resulted from recent sizable structure events. Specifically, the growth rates of selected balance sheet components given in the table have been adjusted to remove the estimated effects of the following five major structure events that involved bank and nonbank organizations:3
- Goldman Sachs Group, Inc., reorganized some of its subsidiaries and consolidated a portion of its assets in a commercial bank subsidiary on November 29, 2008, boosting industry assets by about $125 billion.
- JPMorgan Chase acquired nearly all of Washington Mutual Bank's assets and liabilities on September 26, 2008, boosting industry assets by about $270 billion.
- Wachovia Corporation acquired some assets and liabilities of World Savings Bank, F.S.B., on October 12, 2007, boosting industry assets by about $80 billion.
- Countrywide Bank converted to a thrift charter on March 12, 2007, reducing industry assets by about $90 billion.
- Citibank, N.A., consolidated two related federal savings banks onto its books on October 1, 2006, boosting industry assets by about $200 billion.
These events resulted in the net addition of more than $580 billion of nonbank assets to commercial banks' balance sheets over the nine quarters ending in the fourth quarter of 2008. As a consequence, the adjusted growth rates shown in the table are generally lower than the unadjusted growth rates shown in table 1 of the main text. The adjustments are particularly important for the second half of 2008. Notably, after accounting for JPMorgan Chase's acquisition of Washington Mutual Bank, the growth of residential real estate loans in the third quarter was markedly lower, more clearly reflecting the contraction in most residential real estate markets over that period. Overall, the adjusted data on growth in total loans show that, after abstracting for major structure events, bank lending stepped down noticeably over the second half of 2008, along with the pace of economic activity.
1. In publishing its H.8 statistical release, "Assets and Liabilities of Commercial Banks in the United States," each week, the Federal Reserve describes nonbank structure activity that affects bank assets by $5.0 billion or more. For a list of such activity dating to December 16, 2005, see the "Notes on the Data" link on the release's webpage. In addition, information about structure activity involving any banking organization is available in the Federal Financial Institutions Examination Council's central repository of data, the National Information Center.Return to text
2. Bank of America Corporation announced its intention to purchase Merrill Lynch & Co., Inc., in September, but the acquisition did not become effective until January 1, 2009.Return to text
3. The structure-adjusted growth rates shown in the table were generally based on the difference between the end-of-period reported data and the beginning-of-period data adjusted for the structure event. To adjust for Citibank, N.A., in 2006:Q4,Wachovia Corporation in 2007:Q4, and JPMorgan Chase in 2008:Q3, the beginning-of-period values were determined by adding the value of the assets of the acquired thrift(s) to the reported data for the previous quarter. To adjust for Countrywide's charter conversion in 2007:Q1, the beginning-of-period value was determined by subtracting Countrywide's assets from the reported data for the previous quarter. Because of the complexity of the Goldman Sachs reorganization and the lack of regulatory data for the quarter before the firm's conversion to a bank holding company, all commercial bank assets of Goldman Sachs were subtracted from the data for both 2008:Q3 and 2008:Q4.Return to text
| Percent, annual rate | |||||||||||
| Balance sheet category | 2006 | 2007 | 2008 | 2007 | 2008 | ||||||
|---|---|---|---|---|---|---|---|---|---|---|---|
| Q4 | Q1 | Q2 | Q3 | Q4 | Q1 | Q2 | Q3 | Q4 | |||
| Assets | 7.31 | 5.43 | 11.01 | 14.76 | 9.67 | 11.43 | -2.45 | 11.12 | 4.05 | 10.60 | 6.13 |
| Loans and leases (gross) | 7.55 | 4.38 | 12.81 | 14.20 | 8.36 | 2.35 | .86 | 1.23 | -6.00 | 10.29 | -.40 |
| Commercial and industrial | 10.06 | 11.04 | 16.73 | 30.83 | 17.26 | 8.85 | 1.41 | 7.34 | -4.57 | 20.29 | 3.26 |
| Consumer | 18.11 | -7.64 | 15.25 | 19.69 | 18.08 | -2.22 | 7.74 | 6.00 | .77 | 11.67 | 3.09 |
| One- to four-family residential | 4.70 | 8.04 | 10.37 | 3.63 | -5.62 | -3.93 | -8.60 | -7.52 | -3.73 | 4.12 | -5.82 |
| Commercial real estate loans 1 | 11.96 | 6.14 | 9.76 | 9.22 | 9.49 | 5.05 | 5.32 | 4.62 | .80 | 8.93 | 4.00 |
| Other loans and leases | 7.15 | 2.30 | 11.82 | 11.96 | 12.77 | 5.90 | 5.84 | 11.41 | -11.62 | 10.05 | 2.82 |
| Securities | 8.08 | 11.81 | 1.87 | 4.66 | 2.76 | 7.14 | -3.76 | 8.54 | -16.83 | 5.36 | -1.35 |
| Mortgage-backed securities | 7.36 | 7.83 | -2.58 | -7.58 | 5.36 | 19.25 | 15.52 | -13.10 | 15.49 | .71 | 9.39 |
| Liabilities | 7.06 | 5.28 | 11.85 | 14.24 | 9.97 | 12.14 | -2.63 | 13.08 | 5.22 | 10.73 | 7.08 |
| Capital account | 9.48 | 6.69 | 3.69 | 19.40 | 7.06 | 5.19 | -.90 | -4.89 | -6.85 | 9.49 | -1.88 |
| Memo | |||||||||||
| Unused loan commitments | 9.55 | 11.67 | 10.04 | 13.79 | 1.19 | -3.02 | -4.36 | -12.55 | -33.98 | 9.46 | -12.99 |
| Federal Home Loan Bank advances | 1.53 | 22.09 | 10.09 | 92.30 | .38 | 15.53 | 8.02 | 52.85 | -56.15 | 33.27 | 3.13 |
Note: Data are from period-end to period-end and are as of April 16, 2009, for commerical banks and as of February 23, 2009, for thrift institutions. For the definition of structure-adjusted change, see the box text; for an explanation of the adjustment calculation, see note 3 of the box text.
1. Measured as the sum of construction and land development loans secured by real estate; real estate loans secured by nonfarm nonresidential properties or by multifamily residential properties; and loans to finance commercial real estate, construction, and land development activities not secured by real estate.
Source: Federal Financial Institutions Examination Council, Consolidated Reports of Condition and Income (Call Report) for commercial banks; Office of Thrift Supervision, Thrift Financial Reports for thrifts; staff calculations. Return to table
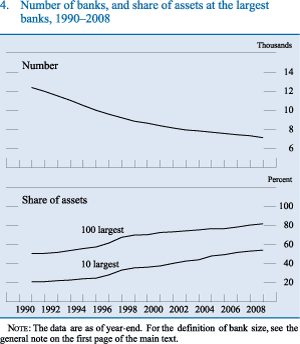
The number of new commercial banks chartered in 2008 edged down. Merger activity also slowed last year but still outpaced bank formation. As a result, the number of banks declined further, to about 7,100 at the end of 2008 from about 7,300 at the end of 2007 (figure 4, top panel). The share of assets held by the 10 largest banks increased 1 percentage point over the year, to 54 percent at the end of 2008, and the share of assets held by the top 100 banks rose about 1.5 percentage points, to 82 percent, over the same period (figure 4, bottom panel).
The financial turmoil resulted in the conversion of several large financial companies to BHCs, with at least one subsidiary assuming a commercial bank charter, in part to gain access to more-stable insured deposits. Nonetheless, the formation of new BHCs slowed in 2008 to the lowest rate in the past two decades. Mergers among BHCs, however, rose for the fourth consecutive year, exceeding the rate at which new BHCs were formed. The number of BHCs thus fell to about 5,000 in 2008 (for multitiered BHCs, only the top-tier organization is counted in these figures). The number of financial holding companies declined slightly.9
Balance Sheet Developments
Balance sheet developments in 2008 continued to be influenced importantly by the turbulence in the financial markets, which intensified markedly after the bankruptcy of Lehman Brothers in mid-September. Moreover, banks were increasingly affected by the fallout from the slowdown in economic activity that began at the end of 2007 and accelerated late in 2008. In addition, as noted earlier, bank balance sheets were materially affected by the policy actions taken by public authorities in response to the financial and economic challenges. Using funds from the TARP, the Treasury established the CPP, under which the U.S. government bought preferred shares from a large number of eligible banking organizations. The Federal Reserve's expansion of its liquidity facilities for banks, as well as the FDIC's introduction of the TLGP, improved the industry's access to funding. The increase in deposit insurance coverage to $250,000 and the full guarantee of noninterest bearing deposits supported strong growth in core deposits in the latter part of the year. Depository institutions' holdings of reserve balances increased substantially over the last few months of the year, and the Federal Reserve began to remunerate reserve balances
Total loans on banks' books increased about 2 percent in 2008 (table 1). However, the growth was due mainly to the substantial structure events that took place during the year, and loans were essentially flat last year after removing the effects of these events. Residential mortgages experienced an outright decline, and growth in several other major loan categories was subdued. In contrast, loans drawn on home equity lines of credit expanded at a solid pace. The sluggish pace of lending reflected a confluence of both supply and demand factors. Throughout the year, banks reported in the Federal Reserve's Senior Loan Officer Opinion Survey on Bank Lending Practices (SLOOS) that they had continued to tighten credit standards and terms on loans in all major categories. Indeed, the fractions of banks tightening lending standards neared or surpassed historical highs for all major loan categories. Moreover, banks reportedly reduced or canceled lines of credit to both businesses and households, and unused commitments to fund loans contracted, particularly in the fourth quarter. At the same time, considerable fractions of banks reported a broad reduction in demand for loans, especially late in the year.
The expansion of the Federal Reserve's balance sheet resulting from the expansion and establishment of various liquidity and credit facilities by the Federal Reserve was consistent with a substantial increase in the excess reserve balances held by banks in the second half of 2008. Indeed, roughly 75 percent of the structure-adjusted growth in banks' balance sheets last year was accounted for by the surge in their reserve balances.
On the liability side of the balance sheet, core deposits expanded as a share of bank funding for the first time in years. In contrast, managed liabilities, which had been an important source of funds in the latter part of 2007, when assets unexpectedly came onto banks' balance sheets, grew only moderately last year. For example, banks' borrowing from the Federal Home Loan Bank (FHLB) system grew just 3 percent, on net, after adjusting for a money center bank's assumption of the advances of a large failed thrift.10 As judged by regulatory standards, a large majority of banks remained well capitalized at year-end 2008, partly reflecting sizable common equity transfers from their parent bank holding companies in the fourth quarter, as the holding companies downstreamed capital received under the CPP.11
Loans to Businesses
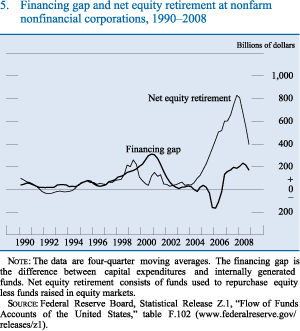
C&I loans expanded around 3.5 percent during 2008--the lowest rate since 2003 and well below the 20 percent increase recorded in 2007. The growth in C&I loans was not materially affected by the significant structure activity during the year. According to the SLOOS, the deceleration in such loans can be explained, in part, by businesses' reduced demand to finance inventory accumulation and fixed investment. The financing gap--the difference between capital expenditures and internally generated funds--at nonfinancial corporations declined in the second half of 2008 (figure 5). Moreover, the slowdown in the pace of merger and acquisition activity contributed to a substantial drop in net equity retirement over the course of 2008, which also reportedly played a role in the decreased demand for C&I loans, as repurchases of equity are frequently financed with bank loans, at least initially.
| Percent | |||||||||||
| Item | 1999 | 2000 | 2001 | 2002 | 2003 | 2004 | 2005 | 2006 | 2007 | 2008 | Memo: Dec. 2008 (billions of dollars) |
|---|---|---|---|---|---|---|---|---|---|---|---|
| Assets | 5.44 | 8.76 | 5.11 | 7.19 | 7.18 | 10.78 | 7.73 | 12.36 | 10.81 | 10.24 | 12,212 |
| Interest-earning assets | 5.87 | 8.66 | 3.96 | 7.53 | 7.27 | 11.29 | 7.97 | 12.45 | 10.11 | 8.59 | 10,389 |
| Loans and leases (net) | 8.10 | 9.24 | 1.82 | 5.90 | 6.51 | 11.21 | 10.39 | 11.97 | 10.57 | 2.23 | 6,617 |
| Commercial and industrial | 7.88 | 8.54 | -6.73 | -7.41 | -4.56 | 4.35 | 12.53 | 11.81 | 20.27 | 3.49 | 1,408 |
| Real estate | 12.22 | 10.74 | 7.94 | 14.44 | 9.75 | 15.41 | 13.80 | 14.94 | 7.04 | 4.49 | 3,797 |
| Booked in domestic offices | 12.36 | 11.02 | 8.02 | 14.85 | 9.66 | 15.09 | 13.93 | 15.05 | 6.77 | 4.76 | 3,735 |
| One- to four-family residential | 9.70 | 9.28 | 5.70 | 19.86 | 10.01 | 15.75 | 11.95 | 15.11 | 5.53 | 3.08 | 2,056 |
| Other real estate | 16.06 | 13.31 | 10.95 | 8.81 | 9.19 | 14.20 | 16.61 | 14.96 | 8.39 | 6.89 | 1,678 |
| Booked in foreign offices | 6.28 | -1.62 | 3.97 | -7.41 | 15.74 | 35.59 | 7.19 | 8.79 | 22.76 | -9.31 | 63 |
| Consumer | -1.48 | 8.04 | 4.16 | 6.55 | 9.31 | 10.16 | 2.30 | 6.19 | 11.67 | 4.22 | 988 |
| Other loans and leases | 7.17 | 7.01 | -2.02 | -.03 | 8.31 | 3.57 | -.18 | 3.17 | 13.01 | -6.26 | 581 |
| Loan loss reserves and unearned income | 2.37 | 7.98 | 13.15 | 5.73 | -2.68 | -4.19 | -5.75 | 1.63 | 27.97 | 75.00 | 158 |
| Securities | 5.11 | 6.36 | 7.22 | 16.20 | 9.44 | 10.58 | 2.40 | 11.53 | 4.54 | .60 | 2,208 |
| Investment account | 6.68 | 2.85 | 8.88 | 13.53 | 8.70 | 6.15 | 1.19 | 6.94 | -4.42 | 10.08 | 1,719 |
| U.S. Treasury | -1.89 | -32.72 | -40.27 | 41.92 | 14.14 | -15.87 | -17.59 | -19.30 | -26.93 | 7.96 | 32 |
| U.S. government agency and corporation obligations | 1.83 | 3.75 | 12.84 | 18.09 | 9.68 | 9.46 | -1.83 | 4.71 | -12.15 | 14.81 | 1,025 |
| Other | 20.90 | 13.39 | 12.18 | 2.72 | 5.98 | 3.02 | 10.12 | 13.78 | 0.75 | 3.57 | 662 |
| Trading account | -6.93 | 37.16 | -3.72 | 36.12 | 14.01 | 36.81 | 7.96 | 31.32 | 35.98 | -22.78 | 489 |
| Other | -8.37 | 10.30 | 13.09 | -2.93 | 6.76 | 14.25 | 5.81 | 19.31 | 22.35 | 73.68 | 1,565 |
| Noninterest-earning assets | 2.64 | 9.45 | 12.74 | 5.11 | 6.64 | 7.61 | 6.19 | 11.79 | 15.42 | 20.75 | 1,823 |
| Liabilities | 5.58 | 8.59 | 4.45 | 7.13 | 7.24 | 9.56 | 7.74 | 12.10 | 10.79 | 11.28 | 11,063 |
| Core deposits | .23 | 7.53 | 10.55 | 7.58 | 7.29 | 8.25 | 6.40 | 5.84 | 5.49 | 14.47 | 5,405 |
| Transaction deposits | -8.97 | -1.31 | 10.20 | -5.12 | 2.82 | 3.20 | -1.18 | -4.28 | -1.22 | 20.51 | 838 |
| Savings deposits (including MMDAs) | 6.68 | 12.51 | 20.68 | 18.46 | 13.71 | 11.72 | 6.93 | 5.53 | 3.34 | 10.03 | 3,295 |
| Small time deposits | -.76 | 7.20 | -7.23 | -4.92 | -6.79 | 1.58 | 12.88 | 16.97 | 18.03 | 23.29 | 1,272 |
| Managed liabilities1 | 15.54 | 8.79 | -2.73 | 5.34 | 6.96 | 12.06 | 12.24 | 19.45 | 16.57 | 6.49 | 4,845 |
| Large time deposits | 14.19 | 19.37 | -3.65 | 5.05 | 1.42 | 21.86 | 22.88 | 15.94 | 1.90 | 4.75 | 1,072 |
| Deposits booked in foreign offices | 14.60 | 7.84 | -10.96 | 4.49 | 12.63 | 16.84 | 6.32 | 29.67 | 25.86 | 2.46 | 1,539 |
| Subordinated notes and debentures | 5.07 | 13.98 | 9.56 | -.59 | 5.08 | 10.49 | 11.41 | 22.60 | 16.83 | 4.60 | 182 |
| Gross federal funds purchased and RPs | 1.56 | 6.49 | 5.72 | 12.75 | -8.70 | 8.40 | 15.62 | 9.47 | 7.06 | 5.76 | 786 |
| Other managed liabilities | 35.27 | 1.80 | -.28 | .97 | 22.00 | 1.37 | 6.15 | 18.89 | 28.44 | 14.38 | 1,265 |
| Revaluation losses held in trading accounts | -13.20 | 7.47 | -17.06 | 33.44 | 14.03 | -12.61 | -17.86 | 6.89 | 42.66 | 88.60 | 388 |
| Other | -1.26 | 20.61 | 14.90 | 5.23 | 5.28 | 17.19 | -1.60 | 22.33 | 3.21 | -8.45 | 425 |
| Capital account | 3.89 | 10.65 | 12.29 | 7.84 | 6.61 | 23.14 | 7.59 | 14.69 | 10.94 | 1.15 | 1,149 |
| Memo: | |||||||||||
| Commercial real estate loans2 | 15.42 | 12.16 | 13.10 | 6.82 | 8.99 | 13.93 | 16.87 | 14.91 | 9.20 | 6.77 | 1,684 |
| Mortgage-backed securities | -3.34 | 3.29 | 29.05 | 15.54 | 10.12 | 13.45 | 2.06 | 10.22 | -1.24 | 11.37 | 1,069 |
| Federal Home Loan Bank advances | n.a. | n.a. | n.a. | 17.21 | 3.71 | 3.73 | 10.00 | 29.80 | 30.62 | 15.60 | 526 |
Note: Data are from year-end to year-end and are as of April 16, 2009.
1. Measured as the sum of large time deposits in domestic offices, deposits booked in foreign offices, subordinated notes and debentures, federal funds purchased and securities sold under repurchase agreements, Federal Home Loan Bank advances, and other borrowed money. Return to table
2. Measured as the sum of construction and land development loans secured by real estate; real estate loans secured by nonfarm nonresidential properties or by multifamily residential properties; and loans to finance commercial real estate, construction, and land development activities not secured by real estate. Return to table
n.a. Not available. Return to table
MMDA Money market deposit account. Return to table
RP Repurchase agreement. Return to table
C&I loan growth differed markedly by bank-size group last year. At the top 100 banks, C&I loans expanded only a little more than 2 percent, while C&I loans at banks outside the top 100 grew about 10 percent. The slower growth in C&I lending at larger banks was attributable not only to the domestic factors mentioned earlier but also to international ones. In particular, the restructuring of foreign operations by one large bank contributed to an 11 percent drop in C&I loans booked to non-U.S. addressees.
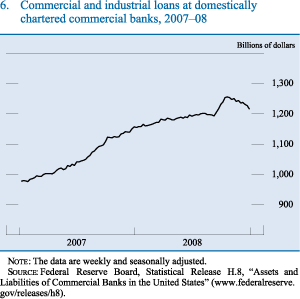
For the industry as a whole, C&I loans expanded over the first three quarters of the year and then contracted in the fourth quarter. Early in the year, strains in the syndicated loan market likely forced banks to hold loans on their balance sheets that had been intended for sale to market investors. After the severe financial market disruptions in the fall, some nonfinancial companies drew heavily on committed lines of credit with banks, which caused the growth of C&I loans to spike in September and October (figure 6). In fact, according to a special question on the October 2008 SLOOS, nearly 45 percent of banks, on net, reported an increase in the dollar amount of C&I loans drawn under preexisting commitments over the previous three months. Nevertheless, despite the unanticipated demand at times over the year, SLOOS respondents indicated weaker demand for C&I loans, on net, throughout 2008, especially in the fourth quarter (figure 7, top panel).
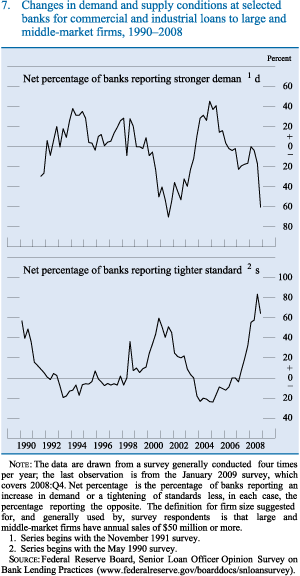
Each quarter last year, considerable numbers of banks indicated in the SLOOS that they had further tightened their credit policies for C&I loans (figure 7, bottom panel). Significant majorities reported tightening credit standards; at the same time, many banks reported that they had increased spreads of C&I loan rates over their cost of funds, were charging higher premiums on riskier loans, and had increased the costs of credit lines to nonfinancial firms. In addition, substantial fractions of SLOOS respondents indicated having tightened nonprice terms on C&I loans, which involved, for example, reducing the maximum size, shortening the maturity, and strengthening the covenants associated with loans or credit lines. By late in the year, nearly all of the respondent banks were reporting that the move to a more stringent lending posture importantly reflected a less favorable or a more uncertain economic outlook, and large fractions of banks pointed to their reduced tolerance for risk. Large fractions also noted concerns about the capital position of their own bank as a reason for tightening standards and terms on C&I loans.
The Federal Reserve's quarterly Survey of Terms of Business Lending also showed a tightening of terms for C&I loans last year. The spread of C&I loan rates over Eurodollar and swap yields of comparable maturity increased for all loan sizes and all bank-size groups surveyed last year. The survey results also indicated a greater reluctance to lend to new customers, as the share of loans originated under previous commitment increased to the top of its historical range. In addition, spreads on loans not made under commitment, which generally reflect the most recent loan pricing, increased sharply late in the year.
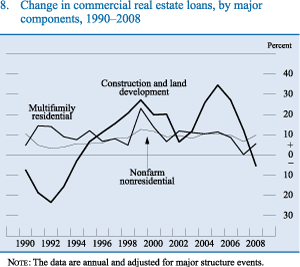
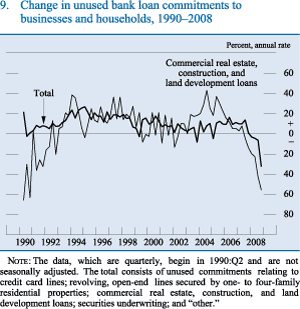
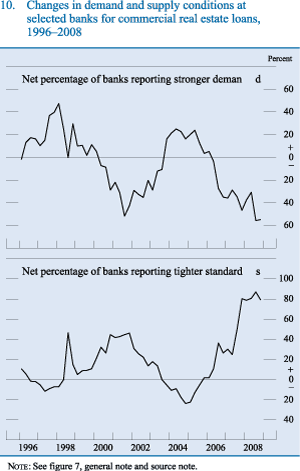
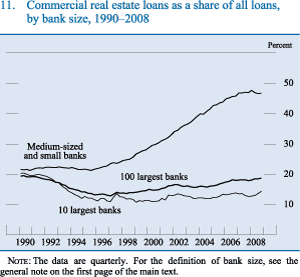
CRE loans grew about 7 percent last year, down a couple of percentage points from 2007 and the slowest rate since 2004. After adjusting for the major structure events, CRE loans grew just 4 percent for the year, with the rate of expansion tailing off to near zero in the fourth quarter. Loans secured by nonfarm nonresidential properties, which account for about 60 percent of all CRE loans, expanded about 10 percent in 2008 (figure 8). Growth in this CRE component was supported by a 15 percent expansion in loans backed by owner-occupied property, which often function as C&I loans with real estate collateral pledged.12 Construction and land development loans, which account for about one-third of all CRE loans, contracted 5 percent in 2008, with the decline accelerating over the course of the year. Commercial construction loans associated with one- to four-family residential projects dropped particularly sharply in the second half of 2008. Banks' unused commitments to fund construction of both commercial and residential properties fell about 30 percent for the year as a whole (figure 9). The growth of CRE loans has been slowing since 2006, a trend reflecting both moderation in demand and reduction in supply. Loan demand was damped last year by a further deterioration in market fundamentals, including falling rents, rising vacancies, and a rapid decline in CRE prices (figure 10, top panel). On the supply side, significant net fractions of respondents reported having tightened CRE lending standards over the past year (figure 10, bottom panel). In addition, in response to special questions on CRE lending in the January 2009 SLOOS, significant net fractions of banks reported having tightened all queried loan policies in 2008. By year-end, CRE loans constituted 13 percent of the assets of all commercial banks. The share of CRE loans relative to all loans at medium-sized and small banks declined marginally but stayed quite high last year (figure 11).
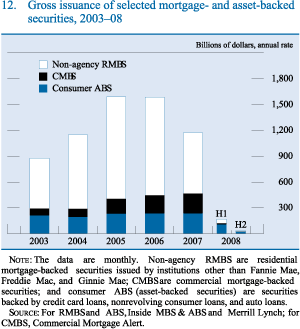
In the second half of 2008, issuance of commercial mortgage-backed securities (CMBS) essentially ceased (figure 12). In a response to a special question, some SLOOS respondents indicated that the shut down of that market had led to an increased volume of CRE loans on their books in the latter part of the year. With the CMBS market impaired, banks reportedly faced less competition for higher-quality, longer-term CRE debt, and, in other cases, banks likely extended or refinanced maturing CRE loans that borrowers were unable to refinance in the CMBS market.
Loans to Households
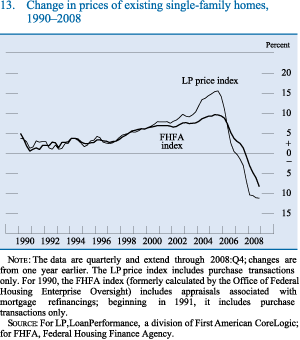
The continuing deterioration in housing market activity and the outright declines in home prices substantially affected bank lending to households last year (figure 13). Overall, the value of loans backed by one-to four-family residential properties held by commercial banks grew just 3 percent. However, after adjusting for major structure events, residential real estate loans held by banks, which had grown every year since at least the 1980s, posted an outright decline of about 6 percent for the year. More broadly, according to data from the Federal Reserve's Z.1 statistical release ("Flow of Funds Accounts of the United States"), household mortgage debt from all sources declined last year for the first time since data were recorded in the flow of funds beginning in 1945.
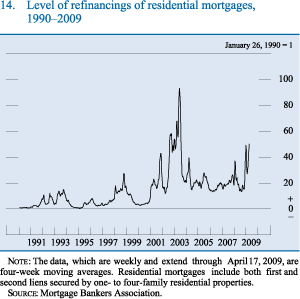
Survey evidence indicates that the decline in residential real estate lending last year stemmed from both tighter credit standards and weaker demand. Substantial fractions of SLOOS respondents reported tighter credit standards on such loans throughout 2008. Not surprisingly, the tightening of credit standards tended to be more pronounced for nontraditional and subprime mortgage products than for prime mortgage products. Indeed, only a few banks reported that they had originated subprime loans during the year. The fraction of banks reporting tighter credit standards on prime mortgages spiked to a record high of 75 percent in the July 2008 survey, and the fractions that so reported remained high in the October 2008 and January 2009 surveys. In addition, SLOOS respondents indicated further weakening in demand for residential mortgages each quarter last year, though to a lesser extent in the final quarter of the year. Refinancing activity picked up at the end of last year as households--specifically, those that were not constrained by deteriorating credit scores or increasing loan-to-value ratios--took advantage of the decline in mortgage rates late in the year (figure 14).
In contrast, loans drawn under revolving home equity lines of credit grew a solid 10 percent in 2008--the largest increase since 2004--even after adjusting for major structure events that took place last year. As households' access to other types of credit became tighter and "cash out" refinancing in many instances was no longer feasible, households probably drew on existing lines of credit. Moreover, because these loans usually carry variable interest rates, declining interest rates over the year likely spurred demand. On the supply side, banks sought to limit their exposure to home equity lines by canceling, suspending, or reducing such lines of credit, likely because of borrower financial difficulties and falling house prices that eliminated part or all of the collateral used to secure the loans.13 In fact, unused commitments secured by residential housing dropped an unprecedented 10 percent last year after adjusting for major structure events.
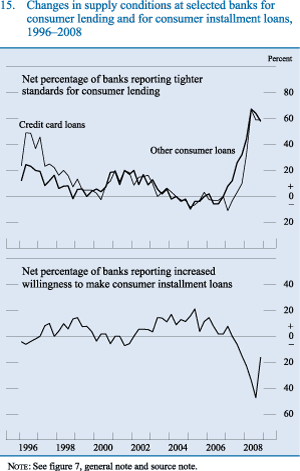
Amid deteriorating credit quality, waning demand for consumer durables, and disruptions in the securitization markets, consumer loans on banks' books expanded modestly in 2008. Credit card loans, which at year-end accounted for about 40 percent of the value of consumer loans on banks' books, increased 5 percent, whereas other consumer loans grew less than 2 percent, down from 13 percent in 2007 (all adjusted for major structure events). According to the SLOOS, banks further tightened standards on consumer loans each quarter last year (figure 15, top panel). Particularly in the second half of the year, banks cut unused commitments for credit cards significantly as the unemployment rate climbed and disruptions in funding markets intensified. In addition, sizable net fractions of banks responding to the SLOOS reported having lowered credit limits on existing credit card accounts to both prime and nonprime borrowers, citing the less favorable economic outlook, reduced tolerance for risk, and declines in customer credit scores as important reasons for their moves. Moreover, banks generally reported weak demand for consumer loans. The net fraction of banks reporting an increased willingness to make consumer installment loans in the October 2008 survey fell to its lowest level since at least 1990; banks continued to report decreased willingness to make such loans, on net, in the January 2009 survey (figure 15, bottom panel). The broad pullback in consumer credit also likely reflected, in part, difficulties in the market for asset-backed securities (ABS), which had typically funded a considerable fraction of consumer credit. In the second half of 2008, ABS issuance virtually ceased.
Reserve Balances
In response to widespread financial market strains that emerged in August 2007, the Federal Reserve established several new facilities to provide liquidity to banks and other financial institutions and made several important modifications to its existing facilities and operations. Before September 2008, the aggregate supply of reserve balances was not materially affected by the liquidity facilities, as any increases in reserve balances from the payouts of loans were largely offset (sterilized) by redemptions or outright sales of Treasury securities held by the Federal Reserve. But after the bankruptcy of Lehman Brothers, the magnitude of liquidity added to the system through various facilities and special interventions exceeded the Federal Reserve's ability to sterilize increases in reserves with draining operations. However, in December, the FOMC lowered its target for the federal funds rate to a range of 0 to 1/4 percent. This low target was consistent with a very high level of banking system reserves. All told, reserve balances due from Federal Reserve Banks increased from about $20 billion at the beginning of 2008 to around $520 billion at year-end.14
Securities
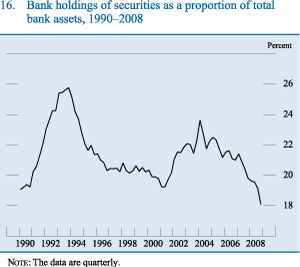
Overall holdings of securities by banks were almost flat last year, growing a mere 0.6 percent, the slowest rate in more than a decade. Securities holdings were only marginally affected by the major structure events described earlier. As a proportion of total assets, banks' holdings of securities declined to 18 percent at the end of 2008 (figure 16). However, the aggregate numbers conceal developments in the underlying investment and trading accounts. Holdings of securities in banks' investment accounts grew 10 percent last year, whereas the value of the holdings of securities in their trading accounts declined 23 percent, as holdings booked in foreign accounts were roughly halved.
Widespread deterioration in financial market conditions caused the value of banks' securities holdings to decline throughout 2008. The difference between the reported fair value measurements and book values of available-for-sale securities in investment accounts widened significantly. The largest revaluation losses were incurred in non-agency MBS and domestic ABS portfolios, and the largest banks were more adversely affected than other bank-size groups. The 10 largest banks held roughly 45 percent of the available-for-sale securities in investment accounts at the beginning of the year but accounted for two-thirds of the revaluation losses for the year.
In the third quarter of 2008, held-to-maturity securities in investment accounts surged as banks purchased a large amount of high-quality asset-backed commercial paper from money market mutual funds with funding provided by the Federal Reserve's AMLF. On the year, held-to-maturity securities in investment accounts rose more than 60 percent but still accounted for only a very small fraction of banks' total securities holdings at year-end.
Other Loans and Leases
Other loans and leases decreased 8 percent during 2008, the largest drop in more than a decade. The decline in this volatile loan category occurred despite a spike during the financial turmoil in September and October, when unplanned overdrafts by a wide range of customers, including some money market mutual fund complexes, increased markedly and many nonbank financial firms drew down their lines of credit to ensure access to funds. The overall drop in other loans and leases likely reflected a confluence of factors related to the general economic slowdown and continuing distress in the financial markets. Loans to other banks dropped 18 percent at an annual rate, probably reflecting, in part, concerns about the solvency of some institutions and lower demand as a result of the expansion of the Federal Reserve's liquidity facilities. Loans for purchasing or carrying securities also fell with the deterioration in financial market conditions. Leases, which are made primarily to businesses for financing equipment or to households for financing automobiles, declined significantly as well, along with the step-down in capital investment and automobile sales. In contrast, bank lending to state and local governments grew robustly in 2008, perhaps because higher costs of bond issuances and dislocations in municipal bond markets, including markets for auction rate securities and variable-rate demand obligations, strained municipal governments' ability to borrow in capital markets.
Liabilities
Bank liabilities increased 11 percent in 2008, outpacing the growth in assets by 1 percentage point. Adjusting for major structure events, the annual growth in liabilities was 7 percent. Core deposits grew 11 percent (adjusted) and, for the first time since 2003, increased as a share of bank funding.15 At year-end, they composed 49 percent of bank liabilities, compared with 47 percent at the end of 2007 (figure 17). Core deposits are traditionally a more important source of funding for smaller institutions than for larger ones. However, in 2008, the growth rate of core deposits at the largest 100 banks outpaced the rate at institutions outside that bank-size category.
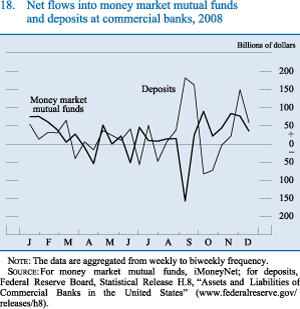
All components of core deposits grew during 2008. The majority of the expansion occurred over the second half of the year and was due to a range of factors, including a substantial easing of monetary policy, the continuing and intensifying financial turmoil, increasing economic uncertainty, and regulatory changes. Falling market interest rates reduced the opportunity cost of holding deposits, thereby spurring their growth. Moreover, turbulence in financial markets and economic uncertainty tend to generate demand for liquid and safe assets. In particular, the turmoil created by the bankruptcy of Lehman Brothers and the resulting outflows from the money market mutual fund sector contributed to strong demand for bank deposits in the fall (figure 18). To help maintain consumers' confidence in the banking system, the Emergency Economic Stabilization Act temporarily increased basic FDIC insurance coverage from $100,000 to $250,000 per depositor in October 2008. In addition, in mid-October, the FDIC announced that the TLGP would provide an unlimited guarantee of deposits held in noninterest-bearing transaction accounts at participating depository institutions.
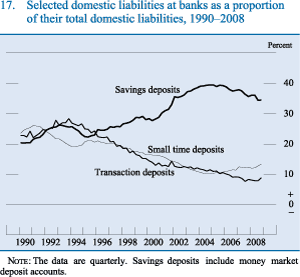
In line with these developments, savings deposits expanded in the first and fourth quarters of 2008, the periods in which the bulk of the 400 basis point easing in monetary policy occurred. Small time deposits grew briskly over the second half of 2008. After declining for three consecutive years, transaction deposits increased one-fifth in 2008. The growth was particularly strong in the fourth quarter--64 percent at an annual rate--likely driven by the TLGP.
Managed liabilities grew 6.5 percent over the year, the lowest rate in half a decade. With the growth of core deposits outstripping that of assets, banks were able to reduce their reliance on generally more expensive and less stable sources of funds. Moreover, access to and usage of the Federal Reserve's discount window and TAF further reduced the banks' need for market-sensitive funding options. In contrast to their experience over the two previous years, banks did not rely on deposits booked in foreign offices to fund asset growth for the year as a whole.
After the financial crisis began in the summer of 2007, the FHLB system became an increasingly important source of funding for banks because the FHLBs were able to lend against mortgages accumulated on banks' balance sheets. Heightened uncertainty led investors to put a higher premium on the perceived implicit government guarantee of FHLB debt, which, in turn, allowed the FHLBs to offer attractive rates to their members. As a result, FHLB advances extended to banks grew (after adjusting for the resolution of Washington Mutual Bank, under which JPMorgan Chase assumed the failing financial institution's advances) an average of 25 percent at an annual rate during the first three quarters of 2008, only to reverse most of the increase in the fourth quarter. All told, such advances ended the year up 3 percent (adjusted). The slowdown late in the year likely reflected, in part, the introduction of the TLGP, which provided an FDIC guarantee for some newly issued senior debt of banking organizations.
Capital
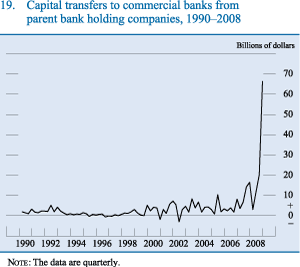
Equity capital at commercial banks rose 1.2 percent in 2008, the second-lowest rate since the 1980s and just one-ninth of the growth rate of assets in 2008. Adjusted for major structure events, the industry's equity capital contracted 2 percent. Nonetheless, both the tier 1 and tier 2 risk-based capital ratios for the industry as a whole rose noticeably in the fourth quarter of 2008.16 At year-end, commercial banks maintained a total risk-based capital ratio of 12.8 percent, compared with 12.5 percent at the end of the third quarter. This increase was more than accounted for by $66 billion of capital transferred during the fourth quarter from parent bank holding companies (the largest such transfer reported over the past 25 years), much of which was presumably TARP money (figure 19). Without those capital injections, and holding risk-weighted assets constant, the total risk-based capital ratio at year-end would have declined to 12.0 percent. Alternatively, some banks may have chosen to reduce their risk-weighted assets in order to maintain a higher year-end capital ratio.
Although risk-based capital measures ticked up, the considerable pressures that remain on banks' balance sheets may affect their future capital positions. Banks recorded $26 billion in net unrealized losses on available-for-sale securities in 2008. If banks decide to sell the securities, then the remaining unrealized losses on the securities currently recorded in other comprehensive income would be moved to net income and subtracted from retained earnings, which would reduce regulatory capital. The industry leverage ratio showed a modest decline last year.17 The dichotomy between the increase in the risk-based capital ratios and the decrease in the leverage ratio reflected a substantial accumulation of cash assets-- particularly reserve balances--which have a risk weight of zero. At the BHC level, regulatory capital ratios improved during 2008, supported importantly by substantial private capital investments in a few companies during the first half of the year and by the significant CPP investments by the Treasury toward the end of the year.
Derivatives
In 2008, the notional principal amount of derivatives contracts held by banks rose $35 trillion, or 21 percent, to more than $200 trillion (table 2). However, this surge importantly reflected the reorganization of a prominent derivatives dealer, which substantially increased the amount of derivatives booked at one of its commercial bank subsidiaries. If the effects of the reorganization are removed, the notional amount grew only 3 percent last year. In either case, the growth in the notional principal amount of derivatives contracts stemmed almost entirely from interest rate derivatives, which at year-end accounted for 82 percent of all contracts held at banks. The notional principal amounts for all other types of derivatives contracts were little changed or even fell.
As dealers, banks often enter into offsetting positions, a strategy that significantly boosts the notional value of their derivatives contracts. The fair market value of derivatives contracts held by banks reflects the contracts' replacement cost and is far smaller than the notional principal amount. The fair market value of contracts with a positive value in 2008 was about $7.0 trillion, whereas for contracts with a negative value, it was roughly $6.9 trillion.
An important way for banks to hedge interest rate risk, including that related to interest-sensitive assets such as mortgages and mortgage-backed securities, is through the use of interest rate swaps. Those swaps are the most common type of derivative used by banks and account for about three-fourths of the notional value of banks' derivatives contracts, though most of the swaps are held for trading and market-making purposes rather than for hedging. The notional value of interest rate swaps increased 27 percent in 2008, but the increase was only 6 percent after adjusting to remove the effect of the dealer's reorganization. Other types of interest rate derivatives contracts employed by banks include futures, forwards, and options. The notional value of these other interest rate derivatives contracts also grew 6 percent (adjusted).
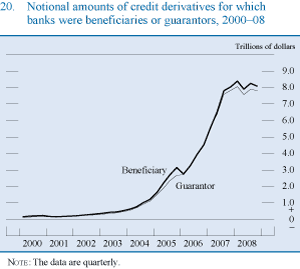
One of the fastest growing components of banks' derivatives portfolios in recent years has been credit derivatives, which, prior to last year, had grown an average of 71 percent per year since 2000. Without adjusting to remove the impact of the dealer's reorganization mentioned earlier, the notional principal amount of credit derivatives held by banks grew in 2008 but only by 0.2 percent. Subtracting the year-end holdings of the reorganized dealer implies that the notional amount of credit derivatives held by banks dropped 9 percent over the year. Credit derivatives include total return swaps and credit options, but credit default swaps account for 98 percent of the notional value of credit derivatives held by banks. Banks are beneficiaries of protection when they buy credit derivatives contracts and providers of protection (guarantors) when they sell. Banks are typically net beneficiaries of protection; as of year-end, contracts in which banks were beneficiaries of protection totaled $8.0 trillion in notional value, and contracts in which they were guarantors totaled $7.8 trillion (figure 20). At year-end 2008, credit derivatives accounted for 8 percent of the notional principal value of all derivatives contracts held by banks.
| Percent | |||||||
| Item | 2003 | 2004 | 2005 | 2006 | 2007 | 2008 | Memo: Dec. 2008 (billions of dollars) |
|---|---|---|---|---|---|---|---|
| Total derivatives | |||||||
| Notional amount | 26.54 | 23.69 | 15.38 | 29.75 | 25.68 | 21.06 | 201,070 |
| Fair value | |||||||
| Positive | .36 | 13.71 | -6.46 | -4.50 | 68.18 | 250.20 | 7,100 |
| Negative | 1.00 | 13.75 | -5.78 | -4.27 | 65.77 | 249.27 | 6,908 |
| Interest rate derivatives | |||||||
| Notional amount | 27.62 | 22.07 | 11.92 | 27.11 | 20.54 | 26.98 | 164,397 |
| Fair value | |||||||
| Positive | -5.95 | 13.14 | -5.52 | -14.55 | 56.19 | 290.51 | 5,120 |
| Negative | -5.07 | 12.94 | -5.15 | -15.06 | 58.19 | 286.47 | 4,989 |
| Exchange rate derivatives | |||||||
| Notional amount | 18.81 | 21.03 | 7.69 | 29.27 | 36.69 | 2.03 | 17,523 |
| Fair value | |||||||
| Positive | 41.81 | 14.86 | -35.84 | 22.86 | 43.59 | 149.12 | 645 |
| Negative | 38.81 | 12.74 | -37.36 | 21.39 | 43.40 | 163.80 | 661 |
| Credit derivatives | |||||||
| Notional amount | 55.98 | 134.52 | 148.09 | 54.93 | 75.87 | .21 | 15,897 |
| Guarantor | 61.82 | 139.07 | 137.87 | 67.69 | 73.94 | -.12 | 7,811 |
| Beneficiary | 51.13 | 130.46 | 157.53 | 44.03 | 77.79 | .54 | 8,086 |
| Fair value | |||||||
| Guarantor | 68.31 | 69.92 | 81.43 | 92.96 | 295.25 | 281.97 | 1,048 |
| Positive | 378.09 | 74.56 | -5.62 | 201.40 | -38.79 | 41.97 | 44 |
| Negative | -68.87 | 38.37 | 827.98 | -1.59 | 1,187.41 | 312.45 | 1,004 |
| Beneficiary | 19.85 | 51.28 | 83.50 | 90.26 | 301.20 | 260.81 | 1,126 |
| Positive | -63.13 | 2.64 | 505.51 | 3.98 | 1,086.95 | 303.42 | 1,078 |
| Negative | 295.74 | 66.36 | 2.79 | 187.44 | -18.95 | 6.54 | 48 |
| Other derivatives1 | |||||||
| Notional amount | 3.77 | 32.66 | 29.43 | 75.17 | 13.44 | - 9.31 | 3,254 |
| Fair value | |||||||
| Positive | 3.16 | 8.55 | 58.51 | 18.99 | 41.22 | 33.70 | 213 |
| Negative | - 5.25 | 19.73 | 74.29 | 24.15 | 15.66 | 39.27 | 206 |
Note: Data are from year-end to year-end and are as of April 16, 2009.
1. Other derivatives consist of equity and commodity derivatives and other contracts. Return to table
Banks also use derivatives related to foreign exchange, equities, and commodities. Collectively, those instruments account for 10 percent of the notional value of the derivatives contracts held by banks. As with other derivatives, the pricing and volume of foreign-exchange-related contracts were affected by the financial turmoil. Increased market volatility raised the cost of hedging foreign exchange positions, and counterparty concerns reduced liquidity in some foreign exchange markets. The semiannual survey of North American foreign exchange volume conducted by the Foreign Exchange Committee, or FXC, showed year-over-year declines in trading volumes for several categories of foreign-exchange-related derivatives in 2008.18 These declines were the first recorded since the survey began in 2004. Banks' notional holdings of foreign-exchange-related derivatives grew 2 percent in 2008, but, after adjusting for the derivatives dealer's reorganization, they dropped almost 8 percent. Banks' holdings of equity and commodity derivatives fell 13 percent and 2 percent, respectively, in 2008, and these two categories were materially unaffected by the structure change.
The reorganization of the large derivatives dealer also affected the industry-wide concentration of derivatives contracts. As reported in previous versions of this article, the share of industry contracts (in terms of notional value) at the 10 largest banks (in terms of assets) had for years been more than 97 percent, a concentration ratio that reflected the role that some of the largest banks play as dealers in the derivatives markets. However, at the end of 2008, that share declined to 84 percent, as the bank created by the reorganization was only the 11th-largest bank. Still, banks' derivatives holdings remained highly concentrated last year: For each individual category of derivatives contracts discussed earlier, the 10 banks with the largest holdings accounted for more than 99 percent of the notional principal value of contracts held by all banks.
Trends in Profitability
Total annual net income of the commercial banking industry declined sharply in 2008; it was down 92 percent from the 2007 level. The primary drivers of the contraction were sizable provisions for loan losses in response to further deterioration in asset quality, heavy write-downs of securities holdings, goodwill impairment charges, and a marked drop in trading revenue. Return on equity for the full year fell to less than 1 percent, down from 9.5 percent in 2007. Banks' annual return on assets (ROA) also dropped considerably, to 0.07 percent last year, its lowest level since 1991. The decrease in profitability was most pronounced in the fourth quarter; indeed, commercial banks posted an aggregate loss in that period.
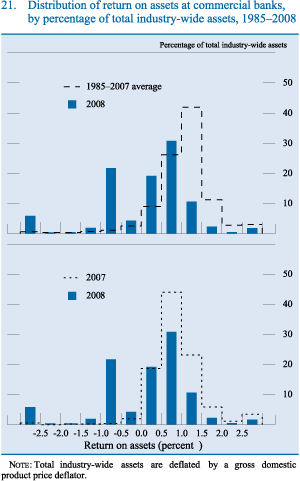
Until the second half of 2007, the profitability of commercial banks had been relatively high and consistent for some time. The distribution of ROA among commercial banks between 1985 and 2007 is centered between 1 and 1.5 percent, with negative returns accounting for less than 7 percent of industry-wide assets (figure 21, top panel). The leftward shift in the distribution of ROA in 2008 shows the widespread nature of the deterioration in profitability last year. Bank profitability in 2008 eroded significantly even when compared with 2007, when strains on banks and their profitability had already emerged (figure 21, bottom panel). The fraction of banks that incurred annual losses in 2008 doubled from 2007 to about 20 percent, and these institutions accounted for about 35 percent of industry assets, the highest share since 1987.
A drop in noninterest income for the year--the second consecutive annual decline--contributed importantly to lower bank profitability in 2008. Noninterest income was about 1.8 percent of average total assets last year, the lowest share since 1990. Trading activities resulted in an aggregate net loss to banks in 2008 of $2.3 billion, the first annual loss reported in that business line in at least 25 years. The loss was driven by a $13.9 billion realized loss from credit exposures in the trading account in 2008, three-fourths of which was incurred by the top 10 banks.19 In addition, banks took other losses owing to substantial asset markdowns in 2008. Realized losses--which affect the income statement directly--reached their highest levels ever in the third quarter, in part because of large third-quarter losses on GSE preferred stock held by many, especially smaller, banks.
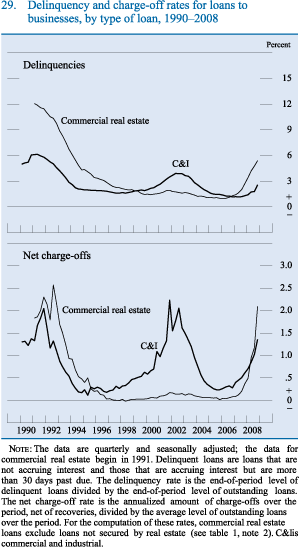
Profits in 2008 were also hit by a dramatic increase in loan loss provisions as credit quality worsened appreciably for all major loan categories. The delinquency rate for all loans and leases held by banks increased to about 4.6 percent in the fourth quarter. The delinquency rate on residential real estate loans climbed to 6.3 percent, its highest rate in more than 15 years, while the delinquency rate on CRE loans rose to 5.4 percent. The increase in CRE loan delinquencies primarily reflected soaring delinquencies on construction and land development loans. Especially late in the year, banks also experienced a noticeable increase in delinquency rates on C&I and consumer loans, particularly credit card loans. The total charge-off rate, which had started to climb in 2007, rose to nearly 2 percent of all loans and leases in the fourth quarter, increasing at a faster rate last year than the delinquency rate. The charge-off rate for CRE loans increased more than fivefold in the fourth quarter from the year-earlier quarter to just more than 2 percent, and that for C&I loans more than doubled to 1.4 percent.
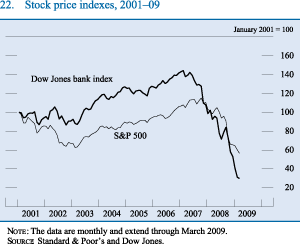
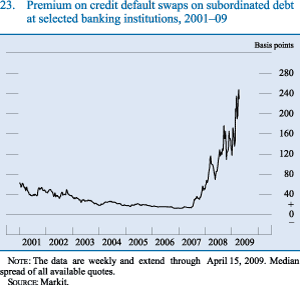
With steep declines in profitability, dividends paid in 2008 were about one-half of the amount paid to shareholders in 2007. Even so, dividends exceeded earnings for the year. Investors remained concerned about the further erosion in profits driven by deteriorating asset quality and continued uncertainties about banks' exposures to structured finance products. As a result, the Dow Jones stock price index for banks fell considerably in 2008, significantly underperforming the S&P 500 index (figure 22). Reflecting the increase in the perceived riskiness of banks, CDS premiums on banking institutions' subordinated debt moved noticeably higher, on net, in 2008 (figure 23).
Interest Income and Expense
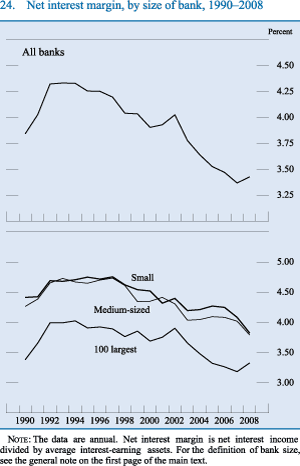
In response to the Federal Reserve's easing of monetary policy, the rates that banks earned on their assets and paid on their liabilities declined markedly over the year, generally following the rates on market instruments. Banks earned an average of 5.7 percent on their assets in 2008, down from 6.8 percent in 2007, and paid an average of 2.5 percent on their liabilities, compared with 3.8 percent in 2007. Because the aggregate rate paid on banks' liabilities dropped slightly more than the aggregate interest earned on banks' assets, the industry-wide net interest margin edged up to 3.43 percent in 2008, compared with 3.37 percent in 2007 (figure 24, top panel). This increase was concentrated at larger banks, as small and medium-sized banks experienced declines in their net interest margins (figure 24, bottom panel).
Core deposits are an attractive source of funding for banks because they tend to be fairly stable, as well as relatively inexpensive, compared with managed liabilities. The average effective interest rate that banks paid on core deposits dropped from 2.8 percent in 2007 to 1.9 percent in 2008. Taken together, banks lowered the rates paid on the components of core deposits fairly uniformly: Banks paid an average of 3.8 percent on small time deposits, 1.3 percent on savings deposits (including money market deposit accounts), and 1.2 percent on other checkable deposits, with each rate almost 1 full percentage point less than in 2007. Nonetheless, funds flowed into these deposit accounts, as investors, seeking the safety and liquidity of FDIC-guaranteed accounts, withdrew investments from money market mutual funds, longer-term mutual funds, equity markets, and hedge funds. In addition, a small number of banks increased their core deposit rates to attract funds, evidently to obtain stable funding during the crisis period.
The rates paid on banks' managed liabilities, which generally exceed those on other funding instruments, dropped 1.7 percentage points in 2008 to 3.1 percent on average.20 However, although the rate fell substantially, its spread over market yields on short-term Treasury securities was considerably higher at the end of 2008 than in 2007.21 That relatively high spread, which reflected the especially sharp decline in Treasury bill yields in response to the pronounced flight to quality, suggests that managed liabilities were a relatively more expensive source of funds for banks last year than in 2007.
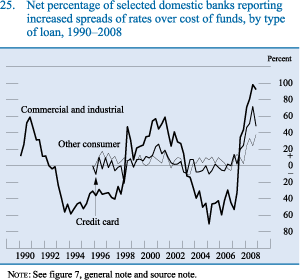
The average interest rate earned on banks' assets in 2008 fell more than 1 percentage point, to 5.7 percent. The decline was due mostly to lower rates earned on loans and leases, which dropped 1.15 percentage points on average. However, the effective rate of return on loans was significantly lower as a result of the deterioration in asset quality. Net of loss provisions, the rate earned on loans and leases was a bit less than 4 percent, a historical low. The average interest rate earned on loans to both businesses and households declined last year. After holding steady in 2007, the average interest rate earned on business loans tumbled over the course of 2008. The Survey of Terms of Business Lending, which measures the interest rate on new C&I loan originations at a broad sample of banks, indicates that interest rates on new C&I loans fell 3 percentage points over the year (between the November 2007 and November 2008 surveys).22 Despite this decline, spreads on C&I loans widened over the year as banks adjusted their pricing in response to the deterioration in the economic outlook and other factors. The weighted-average spread of C&I loan rates over Eurodollar and swap yields of comparable maturity increased about 30 basis points in 2008, a development consistent with the indication by large fractions of SLOOS respondents that they had increased the spread on C&I loans to both large and middle-market firms and to small firms over the course of 2008 (figure 25).
The average interest rate earned on consumer loans decreased to 9.5 percent in 2008 from 10.2 percent in 2007, while the average effective interest rate on real estate loans decreased about 1 percentage point during 2008, to 6.1 percent. Partly as a result of the dislocations in both the asset-backed and mortgage-backed securities markets, the spreads on credit cards, auto loans, and residential mortgages widened in 2008. The widening of spreads curbed the decline in household borrowing rates relative to the decline in market interest rates. The rate earned on real estate loans was also supported by the longer average maturity of such loans and the relatively high percentage of these loans with fixed interest rates. Moreover, because of reduced credit availability and increasing loan-to-value ratios, along with elevated interest rates on nonconforming mortgages, refinancing was not viable for many households.
Noninterest Income and Expense
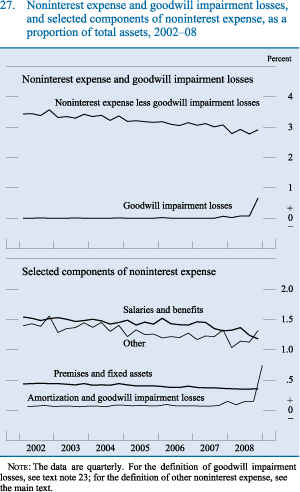
Total noninterest income declined for the second consecutive year, to its lowest level since 1990 (figure 26). Total noninterest expense rose in the fourth quarter of 2008 because of the sizable goodwill impairment losses that some large banks recorded in that quarter (figure 27, top panel).23 Aside from the goodwill impairment charges, however, noninterest expense was flat at 2.9 percent of assets at year-end 2008. The cost of premises and fixed assets, which account for 12 percent of noninterest expense, fell modestly relative to average total assets in 2008, as did salaries and benefits (figure 27, bottom panel). Other indications that commercial banks were able to make progress in moderating personnel costs were a slight decline in the number of full-time-equivalent employees in 2008 and a growth rate for salaries and compensation per employee that was the second lowest in at least the past 25 years. Finally, other noninterest expense, which accounts for about 38 percent of noninterest expense, moved down slightly last year. This category includes a wide range of items that are not reported separately, including expenses for advertising and marketing, data processing, and consulting and advising.
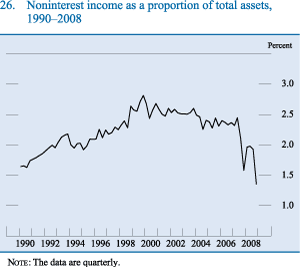
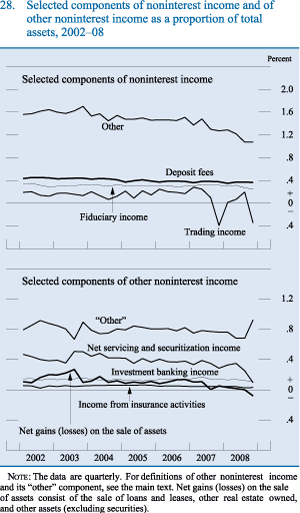
Noninterest income dropped about 5 percent over the year, primarily as a result of a steep decline in trading revenue (figure 28, top panel). Banks reported nearly $14 billion in losses on the trading of credit exposures last year, which likely reflected substantial write-downs of some mortgage-related structured products as well as losses on collateralized debt obligations, credit derivatives, and syndicated leveraged loans. Moreover, an unprecedented number of credit events occurred in the CDS market in the second half of 2008, including events involving Lehman Brothers and the GSEs.24 These events resulted in the termination of a large number of credit derivatives contracts, and guarantors suffered large losses on many of them. Aggregate losses also resulted from equity security and index trading. Revenue from interest-rate-related trading was down from 2007 but remained positive. Revenue from commodity-related trading and foreign-exchange-related trading increased somewhat in 2008, perhaps, in part, because the increased volatility in both of these markets boosted trading volume, allowing banks to earn more fee income. Deposit fees, which accounted for 20 percent of the total noninterest income of large banks and 26 percent of that of small banks, were relatively stable over the year. Likewise, income from fiduciary activities held up fairly well amid the financial crisis. Other noninterest income, which accounts for about 65 percent of total noninterest income, moved down last year. Other noninterest income includes net servicing and securitization income, investment banking income, income from insurance activities, net gains (losses) on the sale of assets, and an "other" category (figure 28, bottom panel). The largest components of the "other" category in 2008 were bank card and credit card interchange fees, earnings on the cash surrender value of bank-owned life insurance programs, and fees from automated teller machines.25
Loan Performance and Loss Provisioning
Credit quality declined across all major loan categories in 2008, and the overall delinquency rate at commercial banks (consisting of loans whose payments are 30 days or more past due) rose to 4.6 percent at year-end, its highest level since late 1992. The aggregate charge-off rate also moved up, to 1.9 percent of total loans, and the charge-off rate at the top 100 banks exceeded 2 percent. The most significant deterioration occurred in banks' residential and commercial real estate loan portfolios, where delinquencies and charge-offs rose to their highest levels in more than a decade (figure 29). Delinquencies and charge-offs on consumer loans also moved higher during 2008. The credit quality of C&I loans, which appeared fairly robust early in 2008, deteriorated later in the year. The significant rise in nonperforming loans and the potential for even greater losses given the generally weaker economic outlook led banks to substantially boost their loss provisions in 2008. Nevertheless, some measures of reserve adequacy remained very low by historical standards.
C&I Loans
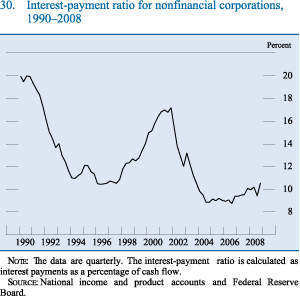
The delinquency rate on C&I loans, which had been near the lower end of its historical range over the past several years, rose in 2008 to 2.6 percent by year-end. The increase was concentrated among the larger banks, where delinquencies jumped from about 1.2 percent at the end of 2007 to about 2.5 percent at the end of 2008. The deterioration at smaller banks was also noticeable, with the delinquency rate increasing about 70 basis points, to about 2.8 percent. Charge-off rates for C&I loans more than doubled year over year for banks of all sizes. Both charge-offs and delinquencies climbed in the latter part of 2008 as nearly all major sectors of the economy registered steep declines in activity and the profitability of nonfinancial firms plummeted. Reflecting these adverse developments, the interest-payment ratio for nonfinancial firms, calculated as interest payments as a percentage of cash flow, moved up a bit in the second half of the year. Although this ratio remained in the bottom part of its historical range, the recent increase suggests that credit strains are likely to intensify over coming quarters (figure 30).
Commercial Real Estate Loans
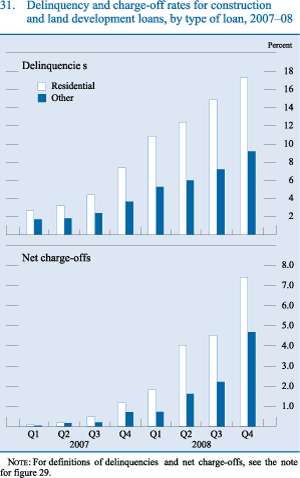
The rate of delinquency on CRE loans doubled in each of the past two years, mainly because of deterioration in the credit quality of construction and land development loans, particularly those linked to residential projects (figure 31). Reflecting the ongoing problems in the housing sector, the delinquency rate on construction and land development loans that financed residential development jumped sixfold, to 17.3 percent, from the beginning of 2007 to year-end 2008, while the charge-off rate rose from near zero to 7.4 percent over the same time period. Those increases occurred despite a tightening of credit standards on CRE loans that began in the second half of 2006. Moreover, the share of construction and land development loans in total CRE loans declined from 34 percent in 2007 to 32 percent by the end of 2008. In part because of an increase in vacancy rates, the delinquency rate on multifamily properties rose from 1.9 percent at the end of 2007 to 3.2 percent at the end of last year. Amid a sharp deterioration in the economic fundamentals for commercial buildings, the delinquency rates on loans secured by existing nonresidential structures significantly increased in 2008 from 1.5 percent to 2.5 percent.
Loans to Households
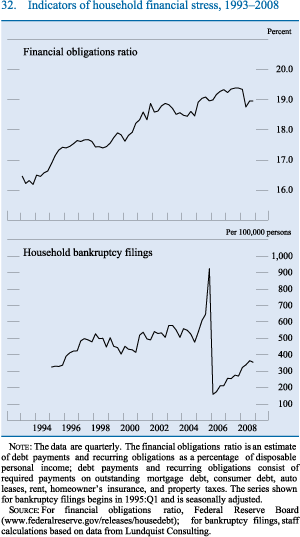
Financial conditions in the household sector deteriorated further, on balance, in 2008, reflecting significant job losses, lower equity and housing wealth, and depressed consumer sentiment. Against this backdrop, consumer credit growth weakened considerably over the year. Partly as a result of lower interest rates on consumer loans, the household financial obligations ratio, an estimate of debt payments and recurring obligations as a percentage of disposable income, edged down to 19 percent from its recent high of 19.4 percent (figure 32, top panel). In such adverse economic circumstances, delinquencies and foreclosures on residential mortgages climbed further, and the credit quality of credit card and other consumer loans declined appreciably. Although household bankruptcy filings remained low relative to the levels seen before the 2005 changes in bankruptcy laws, the bankruptcy rate moved up in 2008 (figure 32, bottom panel).
Residential Real Estate Loans
The credit quality of residential mortgages continued to worsen sharply in 2008, with the subprime mortgage deterioration that began in 2007 spreading to stronger credits. Default rates on alt-A mortgages rose as house prices dropped further. The weakening in the economy affected the credit quality of the full range of mortgage products, and, throughout 2008, credit rating agencies downgraded residential mortgage-backed securities backed by prime, alt-A, and subprime mortgages. In addition, mortgage securitizations other than those backed by the housing-related GSEs and Ginnie Mae essentially ceased last year. Regarding the supply of mortgage credit, large fractions of commercial banks reported in the SLOOS that they had tightened credit standards on a broad range of residential mortgage products, a move that further impaired the ability of borrowers to refinance existing mortgages. Reflecting these developments, national data on variable-rate mortgage loans show that delinquency rates on such loans increased more than those on fixed-rate loans, especially for subprime borrowers (figure 33). All told, the delinquency rate on variable-rate subprime mortgages jumped to more than 35 percent by the end of 2008.
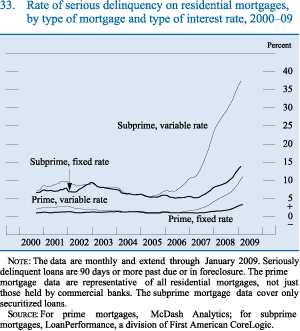
At commercial banks, delinquencies on residential real estate loans reached 6.3 percent at the end of 2008, their highest rate on record (figure 34). Net charge-offs on these loans increased to 1.6 percent at an annual rate in the fourth quarter of 2008, also a record high. The deterioration in the credit quality of residential mortgages on banks' books was widespread last year; delinquency and charge-off rates rose across all types of mortgage products and all bank sizes.
Delinquency rates on closed-end one- to four-family mortgage loans held by banks rose to 7.9 percent on first-lien mortgages and 5.1 percent on junior lien mortgages in the fourth quarter. Delinquency rates on revolving home equity lines of credit also rose substantially, to 3.2 percent. In general, junior liens and home equity lines of credit are offered to higher-quality borrowers, as suggested by the lower delinquency rates on those products than on first-lien mortgages. However, in the event of a default, a bank that holds a loan secured by a junior lien on a one- to four-family residential property is repaid only after the first-lien mortgage has been fully repaid. In the case of foreclosure, the holder of a junior lien mortgage may not be repaid at all, especially if the property has lost a significant portion of its value. Indeed, while the charge-off rates on all types of residential mortgages increased considerably last year, the charge-off rate on closed-end junior liens (3.9 percent) was about four times higher than that on closed-end first liens (1.1 percent). However, although the charge-off rate was much higher for closed-end junior liens, the volume of such loans was just 15 percent of the total aggregate volume of first liens at the end of 2008. Charge-off rates on revolving home equity lines of credit more than doubled last year, increasing from 0.7 percent at year-end 2007 to 1.9 percent at year-end 2008.
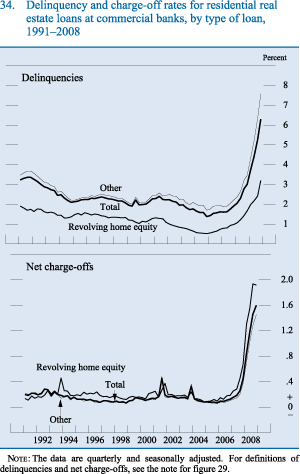
The credit quality of residential mortgages worsened the most at the 100 largest banks in 2008. For closed-end mortgages, the delinquency rate increased about 4.8 percentage points at the largest banks, to 8.5 percent, but it also moved up more than 1 percentage point at smaller banks, to about 3.7 percent. Last year's rise in charge-off rates was also somewhat greater at larger banks than at smaller banks.
Consumer Loans
The weakening in the credit quality of consumer loans no doubt reflected the slower pace of economic growth, the rise in the unemployment rate, and slower growth in households' income. Moreover, financial pressures on households were intensified by the inability of some borrowers to lower their interest payments and to obtain cash by refinancing mortgages. The delinquency rate on credit card loans held by banks rose moderately over most of 2008, but it jumped noticeably in the fourth quarter to 5.6 percent (figure 35). The charge-off rate on such loans increased more steadily over the year, rising from 4.1 percent at the end of 2007 to 6.3 percent at the end of 2008.26 The delinquency rate on other (non-credit card) consumer loans also rose somewhat, to 3.3 percent at year-end. Charge-off rates on those loans climbed from about 1.7 percent in 2007 to 2.7 percent in 2008, a considerable increase that brought the rate to its highest level in at least the past 25 years.
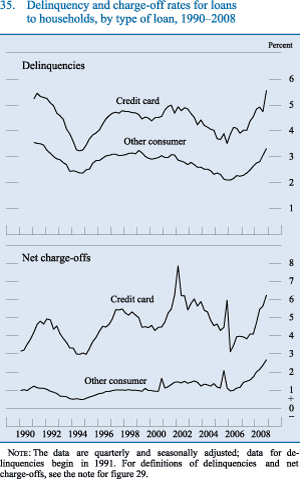
Securitized Loans
The credit quality of loans that were sold and securitized weakened in 2008, though not, in most cases, to the same extent as loans that were held on banks' balance sheets.27 The majority of loans securitized by banks in this manner are residential mortgages on one- to four-family homes (63 percent). At year-end 2008, the volume of securitized one- to four-family residential real estate loans stood at about one-third of the volume of such loans held on banks' balance sheets. The delinquency rate on securitized one- to four-family residential mortgages was about 8 percent in the fourth quarter of 2008, up significantly from 2007. Charge-off rates on these mortgages increased modestly but stayed well below the rates on residential loans on banks' books.
The delinquency rate on securitized credit card loans--which make up roughly one-fourth of the loans securitized by banks and are about equal in dollar value to the credit card loans that banks hold on their balance sheets--moved up, from about 4 percent in 2007 to 5.3 percent in 2008. Charge-off rates on those loans increased significantly last year, from 4.8 percent at year-end 2007 to 7.2 percent at year-end 2008.
Delinquency rates on the small amount of bank-securitized auto loans, which make up less than 1 percent of total securitized loans, remained relatively stable in 2008 after a modest run-up in 2007, whereas charge-off rates doubled. Delinquency and charge-off rates on the small amount of securitized C&I loans (also less than 1 percent of total securitized loans) rose last year.
Outstanding securitizations of other types of loans and leases, a category that includes CRE loans and accounts for about 11 percent of all loans securitized by banks, amounted to about $200 billion. These securitizations equal roughly 45 percent of the total volume of these types of loans held on banks' books. The delinquency rate on such securitizations rose modestly over the year to about 0.8 percent, though the charge-off rate was about zero.
Loss Provisioning
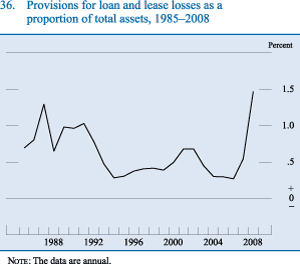
The continued erosion of credit quality spurred banks to step up appreciably the annual rate of loan loss provisioning in 2008 to almost 1.5 percent of total assets. As a proportion of total assets, loss provisioning in 2008 surpassed the highs reached during the late 1980s and early 1990s (figure 36). Loss provisioning consumed more than 30 percent of total revenue in 2008.
Provisioning increased considerably at banks of all sizes. At the top 100 banks, provisioning reached an annual rate of 1.9 percent of average assets in the fourth quarter, compared with 0.9 percent at the end of 2007. Provisioning at banks outside the top 100 rose to 1.3 percent of assets at the end of 2008, more than double the rate at the end of 2007.
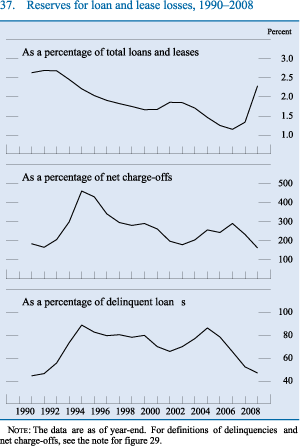
For the second consecutive year, the rate of loss provisioning significantly outpaced that of chargeoffs, implying an increase in reserves as a percentage of total loans and leases (figure 37, top panel). However, net charge-offs rose appreciably as well, leading to declines in some measures of reserve adequacy. At the average charge-off rate for all of 2008 and without additional loss provisions, current reserves are sufficient to cover only about 1.6 years of charge-offs, a record low level (figure 37, middle panel). The ratio of charge-offs to delinquent loans, an estimate of recent loss rates on nonperforming assets, reached nearly 11 percent in the fourth quarter, the highest level in the past two decades. Yet reserves are sufficient to cover only about 47 percent of delinquent loans (figure 37, bottom panel).
International Operations of U.S. Commercial Banks
The share of U.S. bank assets booked in foreign offices declined from 14 percent at year-end 2007 to about 12 percent at year-end 2008. Assets booked in foreign offices remained highly concentrated among the largest banks. On the whole, commercial banks lost money on their international operations in 2008. Net income abroad was significantly adversely affected by restructuring activity at one large bank, which consolidated some of its foreign operations into its domestic operations. Other reported losses at banks' foreign offices were attributable to securities write-downs and higher loan loss provisions.
Loan loss provisions in banks' foreign offices increased about 67 percent from the level of a year earlier, a substantially smaller increase than was posted at domestic offices. While interest income declined 20 percent in 2008, interest expense dropped more than twice that amount. The resulting rise in net interest income boosted net income at foreign offices. Trading revenue, which accounts for about one-third of noninterest income, rose about 85 percent in 2008, but other noninterest income and income from investment banking activities, which account for most of the rest of noninterest income, were both down moderately at foreign offices.
Banks' total exposures to foreign economies through lending and derivatives activities dropped about 7 percent in 2008 after two years of sizable growth.28 While banks reduced their exposures to both advanced foreign economies and emerging market economies, the most pronounced declines in U.S. banks' cross-border lending and derivatives activity--in dollar terms--occurred in the advanced foreign economies.29 In relative terms, however, U.S. banks' exposures to some emerging market economies declined the most. The regions of Eastern Europe, Asia, and Latin America showed declines in dollar exposures of 25 percent, 13 percent, and 10 percent, respectively (table 3).
Overall, the decline in U.S. banks' exposures to foreign economies was likely attributable to the sharp decline in foreign economic activity and the attendant reduction in credit demand. In addition, exposures were likely reduced as banks pulled back from lending to foreign accounts in an effort to boost capital ratios and limit their credit and market risk. Indeed, total exposures from lending to foreign residents (excluding derivatives activity) fell about 17 percent in 2008.30
| Percent | ||||||||||||
| Year | Asia | Latin America and the Caribbean | Eastern Europe |
G-10 and Switzerland 1 |
Non-G-10 developed countries2 |
Total | ||||||
|---|---|---|---|---|---|---|---|---|---|---|---|---|
| All | China | India | Korea | All | Mexico | Brazil | ||||||
| 1997 | n.a | n.a | n.a | n.a | n.a | n.a | n.a | n.a | n.a | n.a | n.a | |
| 1998 | 28.2 | 1.0 | 2.2 | 7.1 | 42.9 | 9.9 | 11.3 | 3.5 | 182.5 | 37.1 | 294.3 | |
| 1999 | 26.1 | .8 | 2.4 | 6.6 | 39.0 | 9.5 | 10.5 | 2.9 | 164.2 | 32.5 | 264.6 | |
| 2000 | 24.0 | .8 | 2.6 | 6.4 | 37.9 | 9.1 | 11.2 | 4.4 | 174.6 | 32.8 | 273.7 | |
| 2001 | 22.4 | .9 | 2.5 | 5.8 | 54.1 | 26.0 | 13.0 | 4.3 | 164.8 | 28.4 | 274.0 | |
| 2002 | 21.9 | .9 | 2.7 | 5.8 | 38.9 | 20.8 | 8.4 | 5.5 | 172.1 | 29.8 | 259.8 | |
| 2003 | 22.8 | 1.3 | 3.9 | 5.5 | 32.9 | 18.0 | 6.8 | 5.4 | 182.0 | 35.0 | 278.1 | |
| 2004 | 32.2 | 1.4 | 4.2 | 15.0 | 31.8 | 16.6 | 6.5 | 6.1 | 198.2 | 37.2 | 305.4 | |
| 2005 | 30.7 | 2.4 | 4.9 | 12.9 | 31.8 | 17.4 | 6.9 | 5.9 | 165.2 | 31.6 | 265.3 | |
| 2006 | 34.7 | 4.1 | 6.1 | 13.6 | 30.8 | 16.8 | 5.7 | 6.5 | 174.7 | 38.5 | 285.1 | |
| 2007 | 44.6 | 4.5 | 9.8 | 14.4 | 35.6 | 17.2 | 8.2 | 9.0 | 219.3 | 48.3 | 356.6 | |
| 2008 | 30.8 | 3.4 | 6.1 | 10.7 | 25.5 | 12.9 | 5.0 | 5.4 | 166.3 | 35.3 | 263.3 | |
| Memo Total exposure (billions of dollars) |
||||||||||||
| 1997 | 87.1 | 3.5 | 5.1 | 25.3 | 101.7 | 18.8 | 33.4 | 11.9 | 354.9 | 88.7 | 644.3 | |
| 1998 | 69.1 | 2.3 | 5.4 | 17.3 | 105.0 | 24.1 | 27.6 | 8.5 | 446.3 | 90.8 | 719.6 | |
| 1999 | 67.9 | 2.0 | 6.2 | 17.2 | 101.6 | 24.8 | 27.3 | 7.4 | 427.8 | 84.7 | 689.5 | |
| 2000 | 68.0 | 2.2 | 7.5 | 18.1 | 107.3 | 25.7 | 31.6 | 12.3 | 494.6 | 93.0 | 775.3 | |
| 2001 | 67.2 | 2.7 | 7.7 | 17.5 | 162.4 | 78.0 | 39.0 | 12.9 | 495.1 | 85.4 | 823.0 | |
| 2002 | 69.5 | 2.7 | 8.7 | 18.4 | 123.5 | 66.2 | 26.6 | 17.5 | 546.5 | 94.7 | 824.7 | |
| 2003 | 79.9 | 4.4 | 13.6 | 19.2 | 115.2 | 63.0 | 23.7 | 19.1 | 638.5 | 122.7 | 975.4 | |
| 2004 | 125.8 | 5.3 | 16.3 | 58.7 | 124.4 | 65.2 | 25.5 | 23.8 | 775.7 | 145.5 | 1,195.4 | |
| 2005 | 134.8 | 10.4 | 21.6 | 56.7 | 139.7 | 76.1 | 30.4 | 25.7 | 724.8 | 138.6 | 1,163.5 | |
| 2006 | 190.5 | 22.7 | 33.6 | 74.8 | 168.9 | 92.5 | 31.5 | 35.5 | 959.1 | 211.2 | 1,565.2 | |
| 2007 | 249.8 | 25.5 | 54.9 | 80.8 | 199.3 | 96.1 | 46.2 | 50.2 | 1,229.0 | 270.5 | 1,998.8 | |
| 2008 | 217.4 | 24.3 | 43.1 | 75.3 | 179.7 | 90.7 | 35.6 | 37.9 | 1,172.9 | 248.6 | 1,856.5 | |
Note: Exposures consist of lending and derivatives exposures for cross-border
and local-office operations. Respondents may file information on one
bank or on the bank holding company as a whole. For the definition of tier 1
capital, see text note 16.
The 2008 data cover 68 banks with a total of $705.1 billion in tier 1 capital.
1. The G-10 (Group of Ten) countries are Belgium, Canada, France, Germany, Italy, Japan, Luxembourg, the Netherlands, Sweden, and the United Kingdom. Return to table
2. The non-G-10 developed countries include Australia, Austria, Denmark, Finland, Greece, Iceland, Israel, New Zealand, Norway, Portugal, South Africa, Spain, and Turkey. Return to table
n.a. Not available.Return to table
Source: Federal Financial Institutions Examination Council, Statistical Release E.16, "Country Exposure Lending Survey."
Developments in Early 2009
U.S. economic activity continued to contract in the first quarter of 2009.31 The deterioration in labor market conditions accelerated in the first few months of the year, with steep job losses across virtually all sectors. In the first quarter, consumer spending showed some tentative signs of stabilization around the low level at which it ended 2008. Available data suggest that the outstanding amount of consumer credit was flat over the first two months of the year. Although housing market activity rebounded a little in February and March, for the quarter as a whole, single-family starts declined to a post-World War II low of about 350,000 units at an annual rate. Delinquencies on residential real estate loans rose further in the first part of the year, but foreclosures on residential properties were about flat, in part because of the temporary moratoriums by the housing-related GSEs and major banks on such foreclosures. Nonresidential construction also weakened further in the first quarter. The April 2009 SLOOS indicated that banks continued to tighten standards and terms on all major types of loans to businesses and households during the first quarter and that demand continued to weaken for nearly all types of loans.
Against this backdrop, financial markets and institutions generally remained under pressure through the first part of 2009. Early in the year, investors continued to be very reluctant to bear risk, and broad equity price indexes declined steeply in January and February while corporate bond spreads remained very high. However, sentiment in financial markets appears to have improved noticeably since then, partly reflecting positive investor guidance on first-quarter earnings at some major banks as well as investors' positive reception of the actions announced by the FOMC after its March meeting. Equity prices rose, on balance, in March while high-yield corporate bond spreads narrowed. Nonetheless, for the first quarter as a whole, bank stock prices declined considerably, on net, with the S&P bank stock index down about 40 percent. Premiums on credit default swaps for commercial banking firms also rose in the first quarter of 2009, on net, and the largest institutions experienced the greatest widening.
Reflecting the ongoing financial strains and the deterioration in the economic outlook, the Federal Reserve and the Treasury took a number of further actions during the first quarter to provide additional support to financial markets and institutions and contribute to a resumption of economic growth. The Federal Reserve began purchasing agency MBS during January.32 In addition, at the conclusion of its March FOMC meeting, the Committee announced that the Federal Reserve would increase its long-term asset purchases, indicating that it would buy an additional $750 billion of MBS (up to a total of $1.25 trillion) and an additional $100 billion of agency debt (up to a total of $200 billion) this year to provide greater support to mortgage and housing markets. The Committee also announced that it would purchase up to $300 billion in longer-term Treasury securities over the period ending September 2009 to help improve conditions in private credit markets. Long-term Treasury yields, which had risen earlier in the year as market participants anticipated a greater supply of Treasury securities resulting from federal budget deficits, declined on the FOMC's announcement, and fixed-rate mortgage rates for high-quality borrowers dropped below 5 percent. Mortgage rates declined to their lowest levels since at least the 1970s, when these data were first collected.
In January 2009, the U.S. government, as part of its commitment to support financial market stability, entered into an agreement with Bank of America. In exchange for preferred stock, the government provided Bank of America with protection against the possibility of unusually large losses on certain pools of on-balance-sheet securities backed by residential and commercial real estate loans and by other assets. Moreover, the government invested an additional $20 billion from the TARP in the bank.
In February, the Treasury, FDIC, Office of the Comptroller of the Currency, Office of Thrift Supervision, and Federal Reserve initiated a Capital Assistance Program to ensure appropriate capitalization of the banks. Under the program, the bank supervisory agencies assessed the capital needs of 19 major U.S. banking institutions with year-end 2008 assets exceeding $100 billion under a baseline and a more challenging economic scenario. Should that evaluation indicate that an additional capital buffer is warranted, an institution will have an opportunity to turn first to private markets to raise capital. If the firm is unable to raise sufficient private capital, the temporary capital buffer will be made available from the government. The Public-Private Investment Program, introduced by the Treasury in March, with the participation of the FDIC and the Federal Reserve, will establish public-private investment funds to purchase legacy assets. Capital for the funds will be provided jointly by private investors and the Treasury. In addition, the government will provide the funds with leverage (through Federal Reserve lending or FDIC guarantees) that currently cannot be raised from market sources, allowing the funds to increase their purchases of legacy assets.
In March, the Federal Reserve initiated operations of the Term Asset-Backed Securities Loan Facility (TALF), originally announced in November 2008. The TALF is designed to catalyze the securitization markets by providing financing to investors to support their purchases of certain AAA-rated asset-backed securities. The market for ABS had been virtually shuttered since the worsening of the financial crisis in October 2008. The program initially accepted ABS backed by student loans, auto loans, credit card loans, and loans guaranteed by the Small Business Administration, but various types of ABS backed by loans to businesses were added in April, and several other asset types were being evaluated for acceptance, including commercial mortgage-backed securities and non-agency residential mortgage-backed securities. Under the TALF, the Federal Reserve lends an amount equal to the market value of the ABS less a "haircut," and the loan is secured at all times by the ABS. The Treasury--under the TARP--provides further credit protection to the Federal Reserve in connection with the TALF.
According to the Federal Reserve's weekly data, domestic commercial bank credit contracted in the first quarter of 2009. C&I loans ran off as demand waned and as banks reported widespread paydowns of outstanding loans. A temporary buildup of residential real estate loans on banks' books was unwound in March, as banks reportedly sold large amounts of such loans to the housing-related GSEs. Revolving home equity loans continued to grow despite further tightening of lending standards and terms reported by banks. Consumer loans increased slightly as a result of significant purchases of loans from nonbanks, likely owing, in part, to banks' better access to funding while the market for credit card and auto securitizations was impaired.
According to the April SLOOS, banks continued to tighten standards and terms over the first quarter of 2009 on all major categories of loans to both businesses and households. Although the net percentage of banks that reported having done so declined in some cases relative to the January survey, these percentages remained in the high end of their historical ranges for all loan categories. Respondents also indicated that demand for all types of loans continued to weaken, with the notable exception of prime residential mortgages. This result coincided with a slight upturn in applications for mortgages to purchase homes and a substantial rise in applications for refinancing. Assuming the economy progresses according to consensus forecasts, a significant majority of banks reported that delinquencies and charge-offs on existing loans to businesses and households were likely to deteriorate further over the remainder of this year.
In early April, the Financial Accounting Standards Board issued guidance related to fair value measurements and other-than-temporary impairments (OTTI). The new fair value guidance reduces the emphasis to be placed on the "last transaction price" in valuing assets when markets are not active and transactions are likely to be forced or distressed. The new guidance may result in higher fair value estimates if current fair values inappropriately rely on distressed transaction prices. The new OTTI guidance will require impairment write-downs through earnings only for the credit-related portion of a debt security's fair value impairment when two criteria are met: (1) The institution does not have the intent to sell the debt security, and (2) it is unlikely that the institution will be required to sell the debt security before a forecasted recovery of its cost basis. This guidance may result in reductions in impairments, thus improving institutions' earnings.33
By the middle of April, about one-half of banking
organizations had reported their earnings for the first
quarter of 2009. While earnings per share (EPS)
results were better than expected at some (especially
large) banking organizations, about one-third of the
firms reported losses, and about two-thirds fell short
of analysts' expectations. Banks cited continued
declines in house prices as well as the weakening
economic environment and its impact on commercial
loan portfolios as the primary reasons for the losses.
Their earnings results, coupled with analysts' estimates
available through mid-April, indicated that
banking firms will earn in the first quarter of 2009, on
average, about one-fourth of their EPS in the same
quarter last year and just slightly more per share than
in the fourth quarter of 2008.
Note: The data in this article cover insured domestic commercial banks and nondeposit trust companies (hereafter, banks). Except as otherwise indicated, the data are from the Consolidated Reports of Condition and Income (Call Report). The Call Report consists of two forms submitted by domestic banks to the Federal Financial Institutions Examination Council: FFIEC 031 (for those with domestic and foreign offices) and FFIEC 041 (for those with domestic offices only). The data thus consolidate information from foreign and domestic offices, and they have been adjusted to take account of mergers and the effects of push-down accounting. For additional information on the adjustments to the data, see the appendix in William B. English and William R. Nelson (1998), "Profits and Balance Sheet Developments at U.S. Commercial Banks in 1997," Federal Reserve Bulletin, vol. 84 (June), p. 408. Size categories, based on assets at the start of each quarter, are as follows: the 10 largest banks, large banks (those ranked 11 through 100), medium-sized banks (those ranked 101 through 1,000), and small banks (those ranked 1,001 and higher). At the start of the fourth quarter of 2008, the approximate asset sizes of the banks in those groups were as follows: the 10 largest banks, more than $171 billion; large banks, $8.3 billion to $163 billion; medium-sized banks, $528 million to $8.2 billion; and small banks, less than $528 million.
1. It is worth emphasizing that the analysis in this article is based on the Call Reports for commercial banks. For a commercial bank that is a subsidiary of a bank holding company or a financial holding company, the Call Report does not include the assets, liabilities, income, or expenses of the other subsidiaries of the larger organization. Thus, the profits of the commercial banks that are subsidiaries of a larger banking organization may differ substantially from the profits of the consolidated institution. Return to text
2. A CDS is a contract between two parties, whereby one party (the guarantor) provides protection against the default of an underlying asset to an investor seeking such protection (the beneficiary). The CDS premium is the annual fixed fee the buyer of protection pays to the seller of protection over the term of the contract, expressed as a percentage of the dollar amount of protection purchased. Return to text
3. See Ben S. Bernanke (2009), "American International Group," statement before the Committee on Financial Services, U.S. House of Representatives, Washington, March 24. Return to text
4. The Federal Deposit Insurance Corporation was able to resolve the failure without any loss to the insurance fund when most assets and liabilities were bought by JPMorgan Chase. See Federal Deposit Insurance Corporation (2008), "JPMorgan Chase Acquires Banking Operations of Washington Mutual," press release, September 25. Return to text
5. The appendix to the Federal Reserve's February 2009 Monetary Policy Report to the Congress contains a description of the Federal Reserve initiatives to address the financial strains. See Board of Governors of the Federal Reserve System (2009), "Appendix: Federal Reserve Initiatives to Address Financial Strains," in Monetary Policy Report to the Congress (Washington: Board of Governors, February 24). Return to text
6. The Money Market Investor Funding Facility (MMIFF) was also created in October 2008. Under the MMIFF, the Federal Reserve will provide senior secured funding to a series of special purpose vehicles to facilitate an industry-supported private-sector initiative to finance the purchase of eligible assets from eligible investors. As of year-end 2008, the facility had not been used. Return to text
7. The TermAsset-Backed Securities Loan Facility has been authorized through December 31, 2009. Other Federal Reserve liquidity facilities, such as the TAF, do not have a fixed expiration date. Return to text
8. The FDIC's establishment of the TLGP was preceded by a determination of systemic risk by the Secretary of the Treasury (after consultation with the President) following receipt of the written recommendation of the FDIC Board, along with a similar written recommendation of the Board of Governors of the Federal Reserve System. See Federal Deposit Insurance Corporation (2009), "Temporary Liquidity Guarantee Program," resource for bank officers and directors. Return to text
9. Statistics on financial holding companies include both domestic BHCs that have elected to become financial holding companies and foreign banking organizations operating in the United States as financial holding companies and subject to the Bank Holding Company Act. For more information, see Board of Governors of the Federal Reserve System (2003), Report to the Congress on Financial Holding Companies under the Gramm-Leach-Bliley Act (Washington:Board of Governors, November). Return to text
10. The FHLBs were established in 1932 as GSEs chartered to provide a low-cost source of funds, primarily for mortgage lending. They are cooperatively owned by their member financial institutions, a group that originally was limited to savings and loan associations, savings banks, and insurance companies. Commercial banks were first able to join FHLBs in 1989, and since then FHLB advances have become a significant source of funding for them, particularly for medium-sized and small banks. The FHLBs are cooperatives, and the purchase of stock is required in order to borrow. Return to text
11. The reported regulatory capital ratios are consistent with a "well capitalized" designation under prompt corrective action standards enacted with the Federal Deposit Insurance Corporation Improvement Act of 1991. Return to text
12. Beginning last year, banks report the amount of loans secured by nonfarm nonresidential properties that are backed by owner-occupied property. Such loans account for about one-half of all loans secured by nonfarm nonresidential properties. These loans often function as C&I loans with real estate collateral pledged because, unlike other CRE loans secured by nonfarm nonresidential properties that are underwritten based on the rental or lease income from the properties, loans secured by owner-occupied properties are underwritten based on the future business revenues of the property's owner. Return to text
13. In June 2008, the FDIC issued supervisory guidance reminding institutions that although reducing or suspending home equity lines of credit may be an appropriate way to manage credit risk, certain legal requirements, in place to protect the borrowers, had to be followed. Specifically, the FDIC urged the institutions to work with borrowers to minimize hardships that may result from reductions or suspensions of credit lines. More information is in Federal Deposit Insurance Corporation (2008), "Consumer Protection and Risk Management Considerations When Reducing or Suspending Home Equity Lines of Credit and Suggested Best Practices for Working with Borrowers," financial institution letter, June 26. Return to text
14. Total reserve balances, which include balances of thrift institutions and foreign banks, grew from $33 billion at the beginning of 2008 to $856 billion at year-end (see the Federal Reserve Board's H.4.1 statistical release, "Factors Affecting Reserve Balances of Depository Institutions and Condition Statement of Federal Reserve Banks," Wednesday levels). Return to text
15. Core deposits consist of savings deposits, small-denomination time deposits, and transaction deposits. Return to text
16. Tier 1 and tier 2 capital are regulatory measures. Tier 1 capital consists primarily of common equity (excluding intangible assets such as goodwill and excluding net unrealized gains on investment account securities classified as available for sale) and certain perpetual preferred stock. Tier 2 capital consists primarily of subordinated debt, preferred stock not included in tier 1 capital, and loan loss reserves up to a cap of 1.25 percent of risk-weighted assets. Total regulatory capital is the sum of tier 1 and tier 2 capital. Risk-weighted assets are calculated by multiplying the amount of assets and the credit equivalent amount of off-balance-sheet items (an estimate of the potential credit exposure posed by the items) by the risk weight for each category. The risk weights rise from 0 to 1 as the credit risk of the assets increases. The tier 1 ratio is the ratio of tier 1 capital to risk-weighted assets; the total ratio is the ratio of the sum of tier 1 and tier 2 capital to risk-weighted assets. Return to text
17. The leverage ratio is the ratio of tier 1 capital to average tangible assets. Tangible assets are equal to total average consolidated assets less assets excluded from common equity in the calculation of tier 1 capital. Return to text
18. The FXC is an industry group and includes representatives of major financial institutions engaged in foreign exchange trading in the United States. It is sponsored by the Federal Reserve Bank of New York and maintains a website. Return to text
19. In this context, credit exposures are defined as cash debt instruments (such as debt securities) and credit derivatives contracts (such as credit default swaps). Return to text
20. Managed liabilities consist of large time deposits in domestic offices, deposits booked in foreign offices, subordinated notes and debentures, federal funds purchased and securities sold under repurchase agreements, Federal Home Loan Bank advances, and other borrowed money. Managed liabilities are generally funds over which the bank has significant discretion to increase or decrease in response to changing funding needs created by deposit outflows or new loan demand. Return to text
21. For example, the difference between the average rate paid on banks' managed liabilities and the average yield on three-month Treasury bills was 2.4 percentage points in the fourth quarter of 2008, while that spread was just 1.3 percentage points in the year-earlier quarter. Return to text
22. The effective (compounded) annual interest rates are calculated from the stated rates and other terms of the loans and weighted by the loan amounts. Return to text
23. Banks incur goodwill impairment losses when the market value of their business segments (or reporting units) drops below the fair value recorded by the company. Companies must test for impairment of goodwill annually or when events occur that would likely reduce the fair value of a reporting unit (business segment) below the carrying value. Assets are written down when considered overvalued compared with the market value--that is, the amount that a potential (or actual) acquirer would be willing to pay (or had paid) for the assets. Return to text
24. Twelve credit events occurred in 2008. Under definitions established by the International Swaps and Derivatives Association, Inc., a credit event is a bankruptcy, obligation acceleration, obligation default, failure to pay, repudiation/moratorium, or restructuring. The settlement of outstanding CDS contracts proceeded smoothly. For a review of the management of the CDS credit events, see Federal Reserve Bank of New York (2009), "Senior Supervisors Group Issues Report on Management of Recent Credit Default Swap Credit Events," press release, March 9. Return to text
25. Earnings on the cash surrender value of bank-owned life insurance (BOLI) programs are available to a bank when it cashes in (or "surrenders") the insurance policy or receives the proceeds of a death benefit upon the death of an insured employee. BOLI generally may be used only in an amount appropriate to fund a bank's exposure arising from employee compensation or benefits programs and is not to be used to fund other normal operating expenses or for speculation. More information is available in Board of Governors of the Federal Reserve System, Division of Banking Supervision and Regulation (2004), "Interagency Statement on the Purchase and Risk Management of Life Insurance," Supervision and Regulation Letter SR 04-19 (December 7). Return to text
26. For a discussion of the change in bankruptcy law that was implemented in 2005 and its effect on credit card loans, see the box "The New Bankruptcy Law and Its Effect on Credit Card Loans," in Elizabeth Klee and Gretchen Weinbach (2006), "Profits and Balance Sheet Developments at U.S. Commercial Banks in 2005 (2005 KB PDF)," Federal Reserve Bulletin, vol. 92 (June), p. A89. Return to text
27. Loans that banks sold and securitized with servicing rights retained or with recourse or other seller-provided enhancements are hereafter referred to, for simplicity, as "securitized" loans. The analysis excludes loans that were sold to, and securitized by, a third party (for example, the Federal National Mortgage Association or the Federal Home Loan Mortgage Corporation). Return to text
28. These exposures declined more significantly relative to tier 1 capital because the reporting institutions' tier 1 capital increased from $560 billion in 2007 to $705 billion in 2008. Return to text
29. The advanced foreign economies are those of Australia, Austria, Belgium, Canada, Denmark, Finland, France, Germany, Greece, Iceland, Ireland, Israel, Italy, Japan, Luxembourg, the Netherlands, New Zealand, Norway, Portugal, South Africa, Spain, Sweden, Switzerland, Turkey, the United Kingdom, and "other non-G-10 developed countries." Return to text
30. Exposures to foreign residents arising from derivatives activities with foreign counterparties actually doubled in 2008, most likely because of greater volatility in financial markets, especially late in the year. Return to text
31. This section reflects information available through mid-April. Return to text
32. The program was first announced in November 2008; more information on the MBS purchases is in Federal Reserve Bank of New York (2009), "Agency Mortgage-Backed Securities Purchase Program." Return to text
33. More information on the guidance, which consists of Statement of Financial Accounting Standards (FAS) 157-e, FAS 115-a, FAS 124-a, and guidance from the Emerging Issues Task Force, EITF 99-20-b, is in Financial Accounting Standards Board (2009), "Summary of Board Decisions," April 2. Return to text
Appendix Tables
| A. All banks | ||||||||||
| Item | 1999 | 2000 | 2001 | 2002 | 2003 | 2004 | 2005 | 2006 | 2007 | 2008 |
|---|---|---|---|---|---|---|---|---|---|---|
| Balance sheet items as a percentage of average net consolidated assets | ||||||||||
| Interest-earning assets1 | 87.03 | 87.13 | 86.49 | 86.42 | 86.08 | 86.90 | 86.82 | 86.86 | 86.94 | 85.30 |
| Loans and leases (net) | 59.34 | 60.48 | 58.95 | 57.83 | 56.88 | 56.98 | 57.88 | 58.26 | 58.37 | 56.73 |
| Commercial and industrial | 17.07 | 17.16 | 16.08 | 14.07 | 12.18 | 11.06 | 11.17 | 11.42 | 11.84 | 12.08 |
| U.S. addressees | 14.43 | 14.67 | 13.69 | 12.04 | 10.48 | 9.52 | 9.64 | 9.73 | 9.86 | 10.12 |
| Foreign addressees | 2.64 | 2.49 | 2.39 | 2.04 | 1.70 | 1.54 | 1.53 | 1.70 | 1.98 | 1.96 |
| Consumer | 9.71 | 9.38 | 9.23 | 9.35 | 9.06 | 9.18 | 9.12 | 8.53 | 8.43 | 8.33 |
| Credit card | 3.51 | 3.52 | 3.69 | 3.78 | 3.55 | 3.87 | 4.06 | 3.73 | 3.72 | 3.68 |
| Installment and other | 6.20 | 5.87 | 5.55 | 5.57 | 5.51 | 5.31 | 5.06 | 4.80 | 4.71 | 4.65 |
| Real estate | 25.44 | 27.04 | 27.10 | 28.39 | 29.91 | 30.77 | 32.40 | 33.19 | 33.37 | 31.95 |
| In domestic offices | 24.87 | 26.49 | 26.60 | 27.91 | 29.45 | 30.24 | 31.84 | 32.61 | 32.76 | 31.35 |
| Construction and land development | 2.18 | 2.51 | 2.85 | 2.98 | 2.99 | 3.26 | 3.90 | 4.73 | 5.05 | 4.72 |
| Farmland | .56 | .56 | .55 | .56 | .54 | .54 | .54 | .53 | .53 | .52 |
| One- to four-family residential | 14.10 | 14.96 | 14.67 | 15.40 | 16.96 | 17.42 | 18.26 | 18.23 | 18.31 | 17.29 |
| Home equity | 1.76 | 1.96 | 2.18 | 2.80 | 3.40 | 4.34 | 4.95 | 4.71 | 4.49 | 4.60 |
| Other | 12.34 | 13.00 | 12.49 | 12.60 | 13.57 | 13.08 | 13.31 | 13.51 | 13.82 | 12.70 |
| Multifamily residential | .88 | .99 | .97 | 1.02 | 1.05 | 1.06 | 1.08 | 1.06 | 1.04 | 1.10 |
| Nonfarm nonresidential | 7.15 | 7.48 | 7.56 | 7.95 | 7.91 | 7.97 | 8.06 | 8.07 | 7.84 | 7.72 |
| In foreign offices | .57 | .54 | .50 | .48 | .46 | .53 | .56 | .58 | .60 | .61 |
| To depository institutions and acceptances of other banks | 1.96 | 1.87 | 1.83 | 1.87 | 1.98 | 2.11 | 1.73 | 1.65 | 1.21 | 1.19 |
| Foreign governments | .16 | .12 | .10 | .09 | .08 | .08 | .06 | .04 | .03 | .02 |
| Agricultural production | .83 | .78 | .75 | .70 | .63 | .59 | .56 | .55 | .52 | .49 |
| Other loans | 2.75 | 2.58 | 2.34 | 2.06 | 2.00 | 2.35 | 2.09 | 2.19 | 2.48 | 2.64 |
| Lease-financing receivables | 2.51 | 2.63 | 2.58 | 2.44 | 2.11 | 1.79 | 1.58 | 1.43 | 1.23 | 1.08 |
| Less: Unearned income on loans | -.06 | -.05 | -.04 | -.05 | -.04 | -.04 | -.03 | -.03 | -.02 | -.02 |
| Less: Loss reserves2 | -1.04 | -1.02 | -1.04 | -1.11 | -1.04 | -.91 | -.79 | -.71 | -.70 | -1.03 |
| Securities | 20.40 | 20.02 | 19.53 | 21.27 | 21.90 | 22.57 | 22.04 | 21.32 | 20.77 | 19.29 |
| Investment account | 18.33 | 17.59 | 16.82 | 18.30 | 18.97 | 18.99 | 17.87 | 16.89 | 15.41 | 14.13 |
| Debt | 17.73 | 16.93 | 16.48 | 17.99 | 18.72 | 18.79 | 17.71 | 16.73 | 15.23 | 13.95 |
| U.S. Treasury | 2.14 | 1.66 | .85 | .78 | .90 | .89 | .62 | .47 | .32 | .24 |
| U.S. government agency and corporation obligations | 10.85 | 10.31 | 10.08 | 11.46 | 12.26 | 12.37 | 11.51 | 10.65 | 9.32 | 8.11 |
| Government-backed mortgage pools | 5.24 | 4.75 | 5.13 | 6.09 | 6.75 | 7.13 | 6.78 | 6.43 | 5.82 | 5.47 |
| Collateralized mortgage obligations | 2.15 | 1.92 | 1.95 | 2.35 | 2.34 | 2.01 | 1.80 | 1.58 | 1.34 | 1.24 |
| Other | 3.46 | 3.63 | 2.99 | 3.02 | 3.17 | 3.22 | 2.93 | 2.65 | 2.16 | 1.40 |
| State and local government | 1.62 | 1.52 | 1.49 | 1.49 | 1.48 | 1.41 | 1.36 | 1.34 | 1.34 | 1.20 |
| Private mortgage-backed securities | .88 | .95 | 1.09 | 1.25 | 1.30 | 1.41 | 1.76 | 1.89 | 2.15 | 2.13 |
| Other | 2.24 | 2.48 | 2.98 | 3.01 | 2.78 | 2.72 | 2.47 | 2.37 | 2.10 | 2.28 |
| Equity | .61 | .66 | .34 | .31 | .25 | .20 | .16 | .16 | .18 | .18 |
| Trading account | 2.06 | 2.43 | 2.72 | 2.97 | 2.93 | 3.59 | 4.17 | 4.43 | 5.36 | 5.16 |
| Gross federal funds sold and reverse RPs | 4.61 | 4.12 | 5.11 | 4.81 | 4.85 | 4.58 | 4.75 | 5.30 | 5.49 | 6.03 |
| Balances at depositories1 | 2.68 | 2.52 | 2.90 | 2.52 | 2.46 | 2.76 | 2.14 | 1.98 | 2.30 | 3.25 |
| Noninterest-earning assets1 | 12.97 | 12.87 | 13.51 | 13.58 | 13.92 | 13.10 | 13.18 | 13.14 | 13.06 | 14.70 |
| Revaluation gains held in trading accounts | 2.57 | 2.28 | 2.37 | 2.42 | 2.70 | 2.19 | 1.82 | 1.64 | 1.73 | 2.83 |
| Other | 10.41 | 10.58 | 11.14 | 11.16 | 11.22 | 10.91 | 11.36 | 11.51 | 11.33 | 11.87 |
| Liabilities | 91.52 | 91.58 | 91.25 | 90.85 | 90.96 | 90.57 | 89.91 | 89.84 | 89.78 | 90.07 |
| Core deposits | 48.60 | 46.52 | 47.07 | 48.98 | 49.18 | 48.56 | 47.52 | 45.56 | 43.89 | 42.71 |
| Transaction deposits | 12.58 | 11.07 | 10.36 | 10.06 | 9.73 | 9.10 | 8.46 | 7.45 | 6.43 | 6.16 |
| Demand deposits | 9.78 | 8.61 | 8.00 | 7.67 | 7.26 | 6.58 | 6.16 | 5.41 | 4.66 | 4.53 |
| Other checkable deposits | 2.81 | 2.46 | 2.36 | 2.39 | 2.47 | 2.52 | 2.30 | 2.04 | 1.77 | 1.63 |
| Savings deposits (including MMDAs) | 22.47 | 22.43 | 24.53 | 28.13 | 30.12 | 31.19 | 30.83 | 29.49 | 28.21 | 27.04 |
| Small time deposits | 13.55 | 13.01 | 12.18 | 10.80 | 9.33 | 8.27 | 8.23 | 8.62 | 9.26 | 9.50 |
| Managed liabilities3 | 36.59 | 38.83 | 37.42 | 35.05 | 34.61 | 35.69 | 36.25 | 38.29 | 39.85 | 41.08 |
| Large time deposits | 7.89 | 8.77 | 8.89 | 8.30 | 8.09 | 8.00 | 9.11 | 10.07 | 9.13 | 9.13 |
| Deposits booked in foreign offices | 10.96 | 11.43 | 10.66 | 9.42 | 9.38 | 10.25 | 10.39 | 11.18 | 12.81 | 13.09 |
| Subordinated notes and debentures | 1.36 | 1.37 | 1.43 | 1.40 | 1.33 | 1.30 | 1.34 | 1.40 | 1.55 | 1.51 |
| Gross federal funds purchased and RPs | 7.97 | 7.83 | 7.95 | 7.77 | 7.75 | 7.24 | 7.05 | 7.53 | 7.06 | 6.98 |
| Other managed liabilities | 8.40 | 9.44 | 8.49 | 8.16 | 8.06 | 8.91 | 8.37 | 8.11 | 9.31 | 10.38 |
| Revaluation losses held in trading accounts | 2.52 | 2.29 | 2.21 | 2.09 | 2.30 | 1.95 | 1.67 | 1.51 | 1.59 | 2.27 |
| Other | 3.81 | 3.94 | 4.54 | 4.73 | 4.87 | 4.36 | 4.47 | 4.47 | 4.44 | 4.01 |
| Capital account | 8.48 | 8.42 | 8.75 | 9.15 | 9.04 | 9.43 | 10.09 | 10.16 | 10.22 | 9.93 |
| Memo | ||||||||||
| Commercial real estate loans4 | 10.87 | 11.58 | 12.09 | 12.57 | 12.47 | 12.78 | 13.52 | 14.35 | 14.47 | 14.10 |
| Other real estate owned5 | .06 | .05 | .05 | .06 | .06 | .06 | .04 | .05 | .07 | .13 |
| Mortgage-backed securities | 8.27 | 7.63 | 8.17 | 9.69 | 10.39 | 10.56 | 10.33 | 9.89 | 9.31 | 8.84 |
| Federal Home Loan Bank advances | n.a. | n.a. | 2.89 | 3.17 | 3.19 | 3.07 | 3.04 | 3.07 | 3.66 | 4.44 |
| Balances at the Federal Reserve1 | .52 | .42 | .40 | .38 | .40 | .35 | .29 | .24 | .20 | 3.44 |
| Interest-earning | n.a. | n.a. | n.a. | n.a. | n.a. | n.a. | n.a. | n.a. | n.a. | 3.00 |
| Noninterest-earning | .52 | .42 | .40 | .38 | .40 | .35 | .29 | .24 | .20 | .44 |
| Interest-earning balances at depositories other than the Federal Reserve | 2.68 | 2.52 | 2.90 | 2.52 | 2.46 | 2.76 | 2.14 | 1.98 | 2.30 | 2.69 |
| Average net consolidated assets (billions of dollars) | 5,439 | 5,907 | 6,334 | 6,635 | 7,249 | 7,879 | 8,592 | 9,427 | 10,396 | 11,578 |
| Effective interest rate (percent)6 | ||||||||||
| Rates earned | ||||||||||
| Interest-earning assets | 7.73 | 8.20 | 7.37 | 6.10 | 5.29 | 5.08 | 5.70 | 6.65 | 6.78 | 5.72 |
| Taxable equivalent | 7.78 | 8.26 | 7.42 | 6.15 | 5.33 | 5.12 | 5.73 | 6.68 | 6.82 | 5.75 |
| Loans and leases, gross | 8.50 | 9.00 | 8.15 | 6.89 | 6.15 | 5.91 | 6.52 | 7.55 | 7.54 | 6.39 |
| Net of loss provisions | 7.99 | 8.33 | 7.15 | 5.84 | 5.47 | 5.47 | 6.09 | 7.18 | 6.70 | 3.91 |
| Securities | 6.30 | 6.47 | 6.04 | 4.95 | 3.96 | 3.86 | 4.18 | 4.71 | 5.02 | 4.87 |
| Taxable equivalent | 6.48 | 6.65 | 6.22 | 5.10 | 4.10 | 3.99 | 4.30 | 4.83 | 5.14 | 4.95 |
| Investment account | 6.28 | 6.45 | 6.05 | 5.04 | 4.00 | 3.96 | 4.29 | 4.86 | 5.13 | 4.93 |
| U.S. Treasury securities and U.S. government agency obligations (excluding MBS) | n.a. | n.a. | 5.76 | 4.42 | 3.29 | 3.11 | 3.46 | 4.19 | 4.71 | 4.23 |
| Mortgage-backed securities | n.a. | n.a. | 6.45 | 5.44 | 4.24 | 4.38 | 4.60 | 5.10 | 5.29 | 5.21 |
| Other | n.a. | n.a. | 5.60 | 4.74 | 4.08 | 3.76 | 4.23 | 4.76 | 5.02 | 4.58 |
| Trading account | 6.48 | 6.63 | 6.01 | 4.38 | 3.71 | 3.35 | 3.72 | 4.16 | 4.70 | 4.67 |
| Gross federal funds sold and reverse RPs | 4.78 | 5.56 | 3.86 | 1.93 | 1.40 | 1.40 | 2.66 | 4.31 | 5.07 | 2.53 |
| Interest-bearing balances at depositories1 | 5.95 | 6.48 | 4.01 | 2.79 | 2.09 | 1.98 | 3.70 | 5.10 | 5.13 | 3.23 |
| Rates paid | ||||||||||
| Interest-bearing liabilities | 4.31 | 4.94 | 3.93 | 2.38 | 1.72 | 1.63 | 2.47 | 3.59 | 3.82 | 2.53 |
| Interest-bearing deposits | 3.88 | 4.45 | 3.61 | 2.11 | 1.47 | 1.36 | 2.06 | 3.05 | 3.39 | 2.26 |
| In foreign offices | 4.91 | 5.61 | 3.94 | 2.38 | 1.62 | 1.72 | 2.77 | 3.92 | 4.23 | 2.47 |
| In domestic offices | 3.64 | 4.17 | 3.54 | 2.06 | 1.44 | 1.29 | 1.91 | 2.85 | 3.18 | 2.21 |
| Other checkable deposits | 2.08 | 2.34 | 1.96 | 1.06 | .75 | .77 | 1.41 | 1.88 | 2.04 | 1.16 |
| Savings deposits (including MMDAs) | 2.50 | 2.86 | 2.19 | 1.13 | .74 | .72 | 1.24 | 2.01 | 2.22 | 1.26 |
| Large time deposits | 4.93 | 5.78 | 5.04 | 3.37 | 2.59 | 2.35 | 3.19 | 4.39 | 4.71 | 3.48 |
| Other time deposits | 5.11 | 5.69 | 5.43 | 3.70 | 2.88 | 2.56 | 3.14 | 4.11 | 4.72 | 3.82 |
| Gross federal funds purchased and RPs | 4.74 | 5.77 | 3.83 | 1.88 | 1.30 | 1.49 | 3.07 | 4.57 | 4.97 | 2.39 |
| Other interest-bearing liabilities | 6.49 | 6.97 | 5.91 | 4.49 | 3.69 | 3.34 | 4.58 | 6.28 | 5.46 | 4.05 |
| Income and expense as a percentage of average net consolidated assets | ||||||||||
| Gross interest income | 6.75 | 7.18 | 6.38 | 5.27 | 4.54 | 4.43 | 4.97 | 5.85 | 5.94 | 4.89 |
| Taxable equivalent | 6.80 | 7.22 | 6.42 | 5.31 | 4.58 | 4.46 | 5.00 | 5.88 | 5.97 | 4.91 |
| Loans | 5.13 | 5.53 | 4.92 | 4.06 | 3.55 | 3.42 | 3.82 | 4.48 | 4.47 | 3.68 |
| Securities | 1.15 | 1.15 | 1.00 | .89 | .74 | .74 | .77 | .84 | .80 | .70 |
| Gross federal funds sold and reverse RPs | .23 | .23 | .20 | .09 | .07 | .07 | .13 | .23 | .28 | .15 |
| Other | .24 | .27 | .27 | .22 | .18 | .20 | .25 | .31 | .39 | .36 |
| Gross interest expense | 3.22 | 3.76 | 2.98 | 1.79 | 1.30 | 1.25 | 1.89 | 2.79 | 2.99 | 1.96 |
| Deposits | 2.21 | 2.56 | 2.09 | 1.23 | .86 | .81 | 1.23 | 1.84 | 2.05 | 1.34 |
| Gross federal funds purchased and RPs | .39 | .45 | .31 | .15 | .10 | .11 | .22 | .36 | .36 | .17 |
| Other | .63 | .75 | .58 | .41 | .33 | .33 | .44 | .59 | .58 | .45 |
| Net interest income | 3.52 | 3.41 | 3.40 | 3.48 | 3.24 | 3.17 | 3.07 | 3.05 | 2.95 | 2.93 |
| Taxable equivalent | 3.57 | 3.46 | 3.44 | 3.52 | 3.28 | 3.21 | 3.11 | 3.09 | 2.98 | 2.95 |
| Loss provisions7 | .39 | .50 | .68 | .68 | .45 | .30 | .30 | .27 | .55 | 1.47 |
| Noninterest income | 2.66 | 2.59 | 2.54 | 2.54 | 2.54 | 2.40 | 2.35 | 2.36 | 2.10 | 1.80 |
| Service charges on deposits | .40 | .40 | .42 | .45 | .44 | .42 | .39 | .38 | .38 | .37 |
| Fiduciary activities | .38 | .38 | .35 | .32 | .31 | .32 | .31 | .30 | .32 | .28 |
| Trading revenue | .19 | .21 | .20 | .16 | .16 | .13 | .17 | .20 | .05 | -.02 |
| Interest rate exposures | .07 | .08 | .09 | .08 | .07 | .03 | .05 | .05 | .04 | .01 |
| Foreign exchange rate exposures | .09 | .08 | .07 | .07 | .07 | .07 | .07 | .08 | .07 | .10 |
| Other commodity and equity exposures | .03 | .04 | .03 | .01 | .02 | .03 | .04 | .07 | .03 | * |
| Credit exposures | n.a. | n.a. | n.a. | n.a. | n.a. | n.a. | n.a. | n.a. | -.09 | -.12 |
| Other | 1.70 | 1.61 | 1.57 | 1.60 | 1.63 | 1.53 | 1.48 | 1.48 | 1.36 | 1.16 |
| Noninterest expense | 3.77 | 3.66 | 3.57 | 3.47 | 3.36 | 3.34 | 3.19 | 3.13 | 3.09 | 3.07 |
| Salaries, wages, and employee benefits | 1.59 | 1.51 | 1.49 | 1.51 | 1.50 | 1.46 | 1.44 | 1.44 | 1.39 | 1.27 |
| Occupancy | .48 | .45 | .44 | .44 | .43 | .42 | .41 | .39 | .37 | .35 |
| Other | 1.71 | 1.70 | 1.64 | 1.51 | 1.43 | 1.46 | 1.34 | 1.30 | 1.33 | 1.45 |
| Net noninterest expense | 1.11 | 1.07 | 1.03 | .93 | .82 | .94 | .84 | .76 | .99 | 1.28 |
| Gains on investment account securities | * | -.04 | .07 | .10 | .08 | .04 | * | -.01 | -.01 | -.14 |
| Income before taxes and extraordinary items | 2.03 | 1.81 | 1.77 | 1.96 | 2.05 | 1.97 | 1.93 | 2.00 | 1.41 | .04 |
| Taxes | .72 | .63 | .59 | .65 | .67 | .64 | .62 | .65 | .43 | .02 |
| Extraordinary items, net of income taxes | * | * | -.01 | * | .01 | * | * | .03 | -.02 | .05 |
| Net income | 1.31 | 1.18 | 1.17 | 1.32 | 1.39 | 1.33 | 1.31 | 1.39 | .97 | .07 |
| Cash dividends declared | .96 | .89 | .87 | 1.01 | 1.07 | .76 | .75 | .87 | .82 | .37 |
| Retained income | .35 | .29 | .31 | .30 | .31 | .58 | .56 | .51 | .15 | -.31 |
| Memo: Return on equity | 15.43 | 13.97 | 13.41 | 14.38 | 15.34 | 14.14 | 12.99 | 13.64 | 9.45 | .69 |
Note: Data are as of April 16, 2009.
1. Effective October 1, 2008, the Federal Reserve began paying interest on depository institutions' required and excess reserve balances. Beginning with the 2008:Q4 Call Report, balances due from Federal Reserve Banks are now reported under "Interest-earning assets" rather than "Noninterest-earning assets." Return to table
2. Includes allocated transfer risk reserve. Return to table
3. Measured as the sum of large time deposits in domestic offices, deposits booked in foreign offices, subordinated notes and debentures, federal funds purchased and securities sold under repurchase agreements, Federal Home Loan Bank advances, and other borrowed money. Return to table
4. Measured as the sum of construction and land development loans secured by real estate; real estate loans secured by nonfarm nonresidential properties or by multifamily residential properties; and loans to finance commercial real estate, construction, and land development activities not secured by real estate. Return to table
5. Other real estate owned is a component of other noninterest-earning assets. Return to table
6. When possible, based on the average of quarterly balance sheet data reported on schedule RC-K of the quarterly Call Report. Return to table
7. Includes provisions for allocated transfer risk. Return to table
* In absolute value, less than 0.005 percent. Return to table
n.a. Not available.Return to table
MMDA Money market deposit account.Return to table
RP Repurchase agreement.Return to table
MBS Mortgage-backed securities. Return to table
| B. Ten largest banks by assets | ||||||||||
| Item | 1999 | 2000 | 2001 | 2002 | 2003 | 2004 | 2005 | 2006 | 2007 | 2008 |
|---|---|---|---|---|---|---|---|---|---|---|
| Balance sheet items as a percentage of average net consolidated assets | ||||||||||
| Interest-earning assets1 | 81.49 | 82.23 | 81.74 | 81.68 | 81.39 | 83.54 | 83.96 | 84.68 | 85.03 | 83.09 |
| Loans and leases (net) | 53.37 | 55.22 | 53.86 | 53.61 | 52.20 | 51.29 | 51.35 | 52.03 | 53.21 | 50.66 |
| Commercial and industrial | 19.20 | 19.87 | 18.82 | 16.16 | 12.98 | 10.54 | 10.61 | 11.20 | 11.58 | 11.85 |
| U.S. addressees | 13.14 | 13.95 | 13.42 | 11.69 | 9.40 | 7.49 | 7.74 | 8.08 | 8.05 | 8.45 |
| Foreign addressees | 6.06 | 5.92 | 5.41 | 4.47 | 3.59 | 3.06 | 2.87 | 3.12 | 3.53 | 3.40 |
| Consumer | 5.94 | 5.43 | 6.17 | 7.82 | 7.96 | 8.49 | 8.80 | 8.17 | 8.98 | 8.43 |
| Credit card | 1.36 | 1.34 | 1.69 | 2.90 | 2.81 | 3.19 | 3.60 | 3.05 | 3.87 | 3.54 |
| Installment and other | 4.58 | 4.09 | 4.48 | 4.92 | 5.15 | 5.30 | 5.21 | 5.13 | 5.11 | 4.89 |
| Real estate | 16.96 | 19.82 | 19.23 | 20.78 | 22.68 | 23.21 | 24.55 | 25.51 | 27.04 | 25.26 |
| In domestic offices | 15.55 | 18.48 | 18.05 | 19.70 | 21.74 | 22.21 | 23.52 | 24.50 | 26.00 | 24.29 |
| Construction and land development | .90 | .98 | 1.27 | 1.42 | 1.36 | 1.40 | 1.70 | 2.01 | 2.01 | 1.86 |
| Farmland | .10 | .11 | .11 | .12 | .10 | .10 | .10 | .10 | .09 | .09 |
| One- to four-family residential | 10.77 | 13.37 | 12.41 | 13.51 | 16.03 | 16.71 | 17.73 | 18.30 | 19.86 | 18.40 |
| Home equity | 1.54 | 1.61 | 1.78 | 2.35 | 2.96 | 4.04 | 5.22 | 5.40 | 5.46 | 5.59 |
| Other | 9.22 | 11.76 | 10.63 | 11.17 | 13.07 | 12.67 | 12.52 | 12.90 | 14.40 | 12.80 |
| Multifamily residential | .43 | .60 | .51 | .55 | .47 | .45 | .44 | .44 | .55 | .69 |
| Nonfarm nonresidential | 3.35 | 3.42 | 3.76 | 4.09 | 3.78 | 3.55 | 3.55 | 3.65 | 3.49 | 3.25 |
| In foreign offices | 1.41 | 1.34 | 1.18 | 1.08 | .94 | 1.00 | 1.03 | 1.01 | 1.03 | .97 |
| To depository institutions and acceptances of other banks | 4.34 | 3.78 | 3.23 | 3.20 | 3.54 | 4.10 | 3.15 | 2.97 | 1.71 | 1.67 |
| Foreign governments | .38 | .28 | .20 | .20 | .17 | .16 | .12 | .07 | .05 | .02 |
| Agricultural production | .26 | .23 | .28 | .23 | .19 | .22 | .20 | .20 | .17 | .15 |
| Other loans | 3.96 | 3.75 | 3.51 | 2.94 | 2.87 | 3.32 | 2.81 | 2.88 | 3.08 | 3.21 |
| Lease-financing receivables | 3.40 | 3.07 | 3.43 | 3.44 | 2.87 | 2.08 | 1.78 | 1.60 | 1.22 | 1.06 |
| Less: Unearned income on loans | -.05 | -.04 | -.04 | -.08 | -.06 | -.04 | -.04 | -.02 | -.02 | -.02 |
| Less: Loss reserves2 | -1.03 | -.97 | -.97 | -1.12 | -1.02 | -.80 | -.65 | -.56 | -.60 | -.98 |
| Securities | 18.34 | 18.98 | 17.81 | 20.54 | 21.22 | 22.95 | 23.37 | 23.05 | 21.97 | 21.02 |
| Investment account | 13.08 | 13.71 | 12.14 | 14.35 | 15.31 | 15.99 | 15.58 | 15.12 | 12.81 | 12.44 |
| Debt | 12.57 | 13.03 | 11.88 | 14.13 | 15.11 | 15.83 | 15.44 | 14.97 | 12.66 | 12.32 |
| U.S. Treasury | 1.98 | 1.96 | .68 | .59 | .82 | .86 | .56 | .43 | .24 | .16 |
| U.S. government agency and corporation obligations | 6.35 | 6.59 | 6.84 | 8.69 | 9.20 | 9.92 | 9.69 | 9.48 | 8.02 | 6.90 |
| Government-backed mortgage pools | 5.03 | 4.88 | 4.99 | 6.38 | 7.59 | 8.64 | 8.65 | 8.64 | 7.53 | 6.48 |
| Collateralized mortgage obligations | .79 | .93 | 1.11 | 1.52 | .91 | .70 | .54 | .53 | .33 | .33 |
| Other | .52 | .78 | .74 | .79 | .70 | .58 | .50 | .32 | .16 | .09 |
| State and local government | .45 | .51 | .55 | .59 | .59 | .57 | .58 | .64 | .65 | .55 |
| Private mortgage-backed securities | .57 | .51 | .58 | .92 | 1.10 | .96 | 1.18 | 1.09 | 1.45 | 2.06 |
| Other | 3.22 | 3.47 | 3.22 | 3.34 | 3.40 | 3.52 | 3.43 | 3.33 | 2.30 | 2.66 |
| Equity | .51 | .68 | .26 | .22 | .20 | .16 | .14 | .15 | .16 | .12 |
| Trading account | 5.25 | 5.26 | 5.67 | 6.18 | 5.91 | 6.96 | 7.79 | 7.94 | 9.16 | 8.57 |
| Gross federal funds sold and reverse RPs | 6.64 | 5.02 | 6.38 | 5.26 | 5.79 | 6.37 | 6.96 | 7.60 | 7.47 | 8.13 |
| Balances at depositories1 | 3.14 | 3.01 | 3.69 | 2.28 | 2.18 | 2.93 | 2.28 | 1.99 | 2.38 | 3.28 |
| Noninterest-earning assets1 | 18.51 | 17.77 | 18.26 | 18.32 | 18.61 | 16.46 | 16.04 | 15.32 | 14.97 | 16.91 |
| Revaluation gains held in trading accounts | 6.66 | 5.66 | 5.48 | 5.40 | 5.79 | 4.45 | 3.50 | 3.07 | 3.03 | 4.77 |
| Other | 11.85 | 12.11 | 12.78 | 12.93 | 12.83 | 12.01 | 12.54 | 12.25 | 11.93 | 12.14 |
| Liabilities | 92.28 | 92.36 | 92.14 | 91.52 | 91.94 | 91.64 | 90.81 | 91.10 | 90.82 | 91.34 |
| Core deposits | 33.76 | 33.28 | 36.38 | 40.61 | 41.07 | 42.02 | 40.18 | 38.03 | 35.08 | 34.49 |
| Transaction deposits | 8.55 | 8.01 | 8.40 | 8.34 | 7.74 | 6.65 | 6.05 | 5.41 | 4.69 | 4.73 |
| Demand deposits | 7.83 | 7.28 | 7.50 | 7.40 | 6.72 | 5.43 | 4.90 | 4.32 | 3.80 | 3.91 |
| Other checkable deposits | .72 | .74 | .90 | .95 | 1.02 | 1.22 | 1.15 | 1.09 | .89 | .81 |
| Savings deposits (including MMDAs) | 18.94 | 19.24 | 22.21 | 26.82 | 28.99 | 31.54 | 30.11 | 28.11 | 25.55 | 24.59 |
| Small time deposits | 6.26 | 6.03 | 5.77 | 5.44 | 4.34 | 3.83 | 4.02 | 4.52 | 4.84 | 5.18 |
| Managed liabilities3 | 45.49 | 46.84 | 43.41 | 38.89 | 38.60 | 39.33 | 40.83 | 43.75 | 46.83 | 47.69 |
| Large time deposits | 5.19 | 5.55 | 5.46 | 5.13 | 5.53 | 5.21 | 6.28 | 6.85 | 6.13 | 6.72 |
| Deposits booked in foreign offices | 22.22 | 22.76 | 20.28 | 17.31 | 16.62 | 17.20 | 17.51 | 18.50 | 19.86 | 20.16 |
| Subordinated notes and debentures | 1.98 | 2.10 | 2.16 | 2.11 | 1.92 | 1.78 | 1.89 | 1.99 | 2.17 | 2.09 |
| Gross federal funds purchased and RPs | 8.84 | 8.89 | 9.04 | 8.83 | 8.62 | 7.79 | 8.39 | 9.51 | 8.42 | 8.18 |
| Other managed liabilities | 7.27 | 7.55 | 6.47 | 5.53 | 5.90 | 7.35 | 6.76 | 6.89 | 10.26 | 10.54 |
| Revaluation losses held in trading accounts | 6.51 | 5.69 | 5.10 | 4.63 | 4.88 | 3.95 | 3.21 | 2.83 | 2.79 | 3.77 |
| Other | 6.52 | 6.55 | 7.26 | 7.39 | 7.40 | 6.34 | 6.60 | 6.47 | 6.12 | 5.39 |
| Capital account | 7.72 | 7.64 | 7.86 | 8.48 | 8.06 | 8.36 | 9.19 | 8.90 | 9.18 | 8.66 |
| Memo | ||||||||||
| Commercial real estate loans4 | 5.69 | 5.87 | 6.68 | 6.92 | 6.31 | 5.99 | 6.33 | 6.73 | 6.64 | 6.37 |
| Other real estate owned5 | .06 | .04 | .04 | .03 | .03 | .03 | .02 | .03 | .05 | .09 |
| Mortgage-backed securities | 6.40 | 6.32 | 6.68 | 8.82 | 9.60 | 10.30 | 10.36 | 10.25 | 9.31 | 8.87 |
| Federal Home Loan Bank advances | n.a. | n.a. | .82 | .82 | .84 | .79 | .63 | .75 | 2.33 | 2.79 |
| Balances at the Federal Reserve1 | .26 | .20 | .27 | .23 | .23 | .25 | .21 | .17 | .15 | 3.92 |
| Interest-earning | n.a. | n.a. | n.a. | n.a. | n.a. | n.a. | n.a. | n.a. | n.a. | 3.61 |
| Noninterest-earning | .26 | .20 | .27 | .23 | .23 | .25 | .21 | .17 | .15 | .32 |
| Interest-earning balances at depositories other than the Federal Reserve | 3.14 | 3.01 | 3.69 | 2.28 | 2.18 | 2.93 | 2.28 | 1.99 | 2.38 | 2.69 |
| Average net consolidated assets (billions of dollars) | 1,935 | 2,234 | 2,527 | 2,785 | 3,148 | 3,654 | 4,232 | 4,759 | 5,469 | 6,241 |
| Effective interest rate (percent)6 | ||||||||||
| Rates earned | ||||||||||
| Interest-earning assets | 7.37 | 7.76 | 6.83 | 5.82 | 4.99 | 4.71 | 5.29 | 6.32 | 6.52 | 5.44 |
| Taxable equivalent | 7.39 | 7.78 | 6.86 | 5.85 | 5.01 | 4.73 | 5.31 | 6.34 | 6.54 | 5.45 |
| Loans and leases, gross | 7.99 | 8.46 | 7.50 | 6.52 | 5.76 | 5.52 | 6.15 | 7.36 | 7.33 | 6.14 |
| Net of loss provisions | 7.65 | 7.92 | 6.55 | 5.30 | 5.19 | 5.29 | 5.84 | 7.02 | 6.29 | 3.23 |
| Securities | 6.58 | 6.48 | 6.23 | 5.04 | 4.15 | 4.04 | 4.27 | 4.69 | 4.99 | 4.91 |
| Taxable equivalent | 6.65 | 6.55 | 6.31 | 5.11 | 4.21 | 4.10 | 4.32 | 4.75 | 5.04 | 4.94 |
| Investment account | 6.59 | 6.40 | 6.23 | 5.30 | 4.26 | 4.37 | 4.63 | 5.11 | 5.29 | 5.14 |
| U.S. Treasury securities and U.S. government agency obligations (excluding MBS) | n.a. | n.a. | 5.01 | 3.74 | 2.62 | 2.92 | 3.29 | 4.15 | 4.15 | 3.02 |
| Mortgage-backed securities | n.a. | n.a. | 6.42 | 5.55 | 4.51 | 4.83 | 4.92 | 5.30 | 5.41 | 5.34 |
| Other | n.a. | n.a. | 6.34 | 5.30 | 4.28 | 3.76 | 4.26 | 4.81 | 5.08 | 4.77 |
| Trading account | 6.56 | 6.70 | 6.24 | 4.46 | 3.87 | 3.32 | 3.57 | 3.90 | 4.57 | 4.56 |
| Gross federal funds sold and reverse RPs | 4.52 | 4.93 | 3.86 | 2.20 | 1.60 | 1.43 | 2.46 | 4.07 | 5.06 | 2.59 |
| Interest-bearing balances at depositories1 | 7.22 | 7.43 | 3.73 | 3.40 | 2.49 | 1.80 | 4.06 | 5.59 | 5.36 | 3.46 |
| Rates paid | ||||||||||
| Interest-bearing liabilities | 4.52 | 5.03 | 3.78 | 2.33 | 1.67 | 1.62 | 2.52 | 3.74 | 3.87 | 2.47 |
| Interest-bearing deposits | 3.82 | 4.40 | 3.27 | 1.94 | 1.34 | 1.29 | 2.01 | 2.96 | 3.30 | 2.08 |
| In foreign offices | 4.99 | 5.67 | 4.02 | 2.59 | 1.74 | 1.81 | 2.77 | 3.88 | 4.28 | 2.52 |
| In domestic offices | 3.04 | 3.51 | 2.84 | 1.67 | 1.18 | 1.08 | 1.70 | 2.55 | 2.80 | 1.85 |
| Other checkable deposits | 1.44 | 1.61 | 1.67 | .93 | .80 | .97 | 2.27 | 2.46 | 2.36 | 1.13 |
| Savings deposits (including MMDAs) | 2.11 | 2.43 | 1.92 | 1.02 | .73 | .71 | 1.15 | 1.87 | 1.98 | 1.10 |
| Large time deposits | 4.36 | 5.32 | 4.40 | 3.26 | 2.36 | 2.14 | 3.06 | 4.32 | 4.72 | 3.35 |
| Other time deposits | 4.95 | 5.53 | 5.11 | 3.44 | 2.70 | 2.61 | 3.40 | 4.05 | 4.55 | 3.46 |
| Gross federal funds purchased and RPs | 4.53 | 5.47 | 3.81 | 2.02 | 1.39 | 1.59 | 3.11 | 4.63 | 5.15 | 2.54 |
| Other interest-bearing liabilities | 8.26 | 8.07 | 6.84 | 5.57 | 4.42 | 3.83 | 5.40 | 7.78 | 5.61 | 4.32 |
| Income and expense as a percentage of average net consolidated assets | ||||||||||
| Gross interest income | 6.01 | 6.39 | 5.55 | 4.77 | 4.05 | 3.94 | 4.47 | 5.46 | 5.61 | 4.52 |
| Taxable equivalent | 6.03 | 6.41 | 5.57 | 4.79 | 4.07 | 3.96 | 4.48 | 5.48 | 5.63 | 4.53 |
| Loans | 4.35 | 4.74 | 4.13 | 3.57 | 3.04 | 2.86 | 3.19 | 3.91 | 3.98 | 3.15 |
| Securities | .85 | .88 | .72 | .73 | .63 | .69 | .72 | .80 | .69 | .65 |
| Gross federal funds sold and reverse RPs | .30 | .25 | .25 | .12 | .10 | .10 | .18 | .31 | .38 | .20 |
| Other | .51 | .51 | .44 | .35 | .28 | .30 | .38 | .45 | .56 | .51 |
| Gross interest expense | 3.16 | 3.60 | 2.69 | 1.65 | 1.19 | 1.20 | 1.89 | 2.88 | 3.00 | 1.88 |
| Deposits | 1.97 | 2.33 | 1.74 | 1.05 | .74 | .74 | 1.17 | 1.72 | 1.87 | 1.17 |
| Gross federal funds purchased and RPs | .40 | .49 | .35 | .18 | .13 | .13 | .27 | .47 | .46 | .21 |
| Other | .79 | .78 | .59 | .41 | .33 | .33 | .45 | .69 | .68 | .50 |
| Net interest income | 2.84 | 2.78 | 2.87 | 3.12 | 2.86 | 2.74 | 2.58 | 2.58 | 2.61 | 2.63 |
| Taxable equivalent | 2.86 | 2.80 | 2.89 | 3.14 | 2.88 | 2.76 | 2.59 | 2.60 | 2.63 | 2.65 |
| Loss provisions7 | .26 | .38 | .59 | .73 | .35 | .16 | .20 | .22 | .60 | 1.52 |
| Noninterest income | 2.55 | 2.54 | 2.26 | 2.31 | 2.32 | 2.21 | 2.37 | 2.35 | 1.95 | 1.66 |
| Service charges on deposits | .37 | .40 | .44 | .48 | .46 | .45 | .42 | .41 | .40 | .40 |
| Fiduciary activities | .31 | .27 | .29 | .25 | .26 | .24 | .27 | .23 | .20 | .21 |
| Trading revenue | .46 | .48 | .43 | .32 | .30 | .23 | .31 | .37 | .05 | -.01 |
| Interest rate exposures | .17 | .20 | .20 | .15 | .12 | .07 | .11 | .09 | .08 | .03 |
| Foreign exchange rate exposures | .19 | .18 | .14 | .14 | .14 | .12 | .12 | .14 | .09 | .14 |
| Other commodity and equity exposures | .09 | .11 | .08 | .03 | .04 | .04 | .07 | .13 | .06 | -.01 |
| Credit exposures | n.a. | n.a. | n.a. | n.a. | n.a. | n.a. | n.a. | n.a. | -.18 | -.17 |
| Other | 1.41 | 1.39 | 1.10 | 1.26 | 1.30 | 1.28 | 1.38 | 1.35 | 1.31 | 1.07 |
| Noninterest expense | 3.45 | 3.31 | 3.13 | 3.16 | 3.02 | 3.11 | 2.99 | 2.89 | 2.80 | 2.71 |
| Salaries, wages, and employee benefits | 1.57 | 1.46 | 1.38 | 1.41 | 1.39 | 1.34 | 1.38 | 1.39 | 1.32 | 1.20 |
| Occupancy | .50 | .47 | .45 | .46 | .45 | .43 | .43 | .40 | .37 | .35 |
| Other | 1.38 | 1.39 | 1.30 | 1.28 | 1.18 | 1.33 | 1.19 | 1.09 | 1.12 | 1.17 |
| Net noninterest expense | .90 | .77 | .87 | .85 | .70 | .91 | .62 | .54 | .85 | 1.05 |
| Gains on investment account securities | .03 | -.03 | .08 | .13 | .11 | .07 | * | -.01 | .02 | -.05 |
| Income before taxes and extraordinary items | 1.71 | 1.60 | 1.48 | 1.67 | 1.92 | 1.74 | 1.75 | 1.82 | 1.18 | * |
| Taxes | .66 | .60 | .49 | .56 | .63 | .56 | .57 | .59 | .33 | -.07 |
| Extraordinary items, net of income taxes | * | * | -.01 | * | * | * | * | .02 | * | .09 |
| Net income | 1.05 | 1.00 | .99 | 1.11 | 1.29 | 1.18 | 1.18 | 1.25 | .85 | .16 |
| Cash dividends declared | .79 | .86 | .66 | 1.05 | .99 | .65 | .59 | .64 | .60 | .28 |
| Retained income | .26 | .13 | .32 | .06 | .30 | .53 | .59 | .62 | .25 | -.11 |
| Memo: Return on equity | 13.58 | 13.04 | 12.55 | 13.14 | 16.06 | 14.07 | 12.86 | 14.08 | 9.23 | 1.89 |
Note: Data are as of April 16, 2009.
1. Effective October 1, 2008, the Federal Reserve began paying interest on depository institutions' required and excess reserve balances. Beginning with the 2008:Q4 Call Report, balances due from Federal Reserve Banks are now reported under "Interest-earning assets" rather than "Noninterest-earning assets." Return to table
2. Includes allocated transfer risk reserve. Return to table
3. Measured as the sum of large time deposits in domestic offices, deposits booked in foreign offices, subordinated notes and debentures, federal funds purchased and securities sold under repurchase agreements, Federal Home Loan Bank advances, and other borrowed money. Return to table
4. Measured as the sum of construction and land development loans secured by real estate; real estate loans secured by nonfarm nonresidential properties or by multifamily residential properties; and loans to finance commercial real estate, construction, and land development activities not secured by real estate. Return to table
5. Other real estate owned is a component of other noninterest-earning assets. Return to table
6. When possible, based on the average of quarterly balance sheet data reported on schedule RC-K of the quarterly Call Report. Return to table
7. Includes provisions for allocated transfer risk. Return to table
* In absolute value, less than 0.005 percent. Return to table
n.a. Not available. Return to table
MMDA Money market deposit account. Return to table
RP Repurchase agreement. Return to table
MBS Mortgage-backed securities. Return to table
| C. Banks ranked 11 through 100 by assets | ||||||||||
| Item | 1999 | 2000 | 2001 | 2002 | 2003 | 2004 | 2005 | 2006 | 2007 | 2008 |
|---|---|---|---|---|---|---|---|---|---|---|
| Balance sheet items as a percentage of average net consolidated assets | ||||||||||
| Interest-earning assets1 | 88.40 | 88.67 | 88.09 | 88.34 | 88.10 | 88.18 | 87.87 | 87.05 | 87.01 | 85.34 |
| Loans and leases (net) | 64.22 | 64.88 | 62.14 | 60.00 | 59.48 | 60.63 | 63.37 | 62.77 | 60.99 | 60.04 |
| Commercial and industrial | 19.39 | 18.19 | 15.84 | 13.27 | 11.96 | 11.90 | 12.17 | 12.13 | 12.74 | 12.80 |
| U.S. addressees | 18.17 | 17.64 | 15.36 | 12.94 | 11.66 | 11.64 | 11.91 | 11.81 | 12.41 | 12.46 |
| Foreign addressees | 1.22 | .55 | .48 | .33 | .30 | .26 | .27 | .32 | .33 | .34 |
| Consumer | 13.58 | 13.79 | 13.20 | 12.79 | 12.57 | 12.74 | 12.84 | 11.94 | 9.99 | 10.61 |
| Credit card | 6.79 | 6.97 | 7.05 | 6.56 | 6.35 | 6.90 | 7.45 | 7.12 | 5.29 | 5.67 |
| Installment and other | 6.79 | 6.82 | 6.15 | 6.22 | 6.21 | 5.83 | 5.39 | 4.82 | 4.70 | 4.94 |
| Real estate | 24.79 | 26.21 | 27.29 | 28.94 | 30.67 | 32.16 | 34.89 | 35.23 | 33.53 | 32.50 |
| In domestic offices | 24.61 | 26.12 | 27.21 | 28.88 | 30.54 | 31.96 | 34.73 | 35.03 | 33.35 | 32.19 |
| Construction and land development | 2.44 | 3.00 | 3.31 | 3.36 | 3.22 | 3.51 | 4.21 | 5.27 | 5.95 | 5.62 |
| Farmland | .19 | .22 | .23 | .22 | .20 | .19 | .19 | .17 | .21 | .26 |
| One- to four-family residential | 14.14 | 14.51 | 15.51 | 17.05 | 18.79 | 19.52 | 21.05 | 20.27 | 17.80 | 16.57 |
| Home equity | 2.08 | 2.49 | 2.90 | 3.92 | 4.74 | 5.90 | 6.04 | 5.01 | 4.01 | 3.90 |
| Other | 12.06 | 12.02 | 12.60 | 13.13 | 14.05 | 13.62 | 15.01 | 15.26 | 13.79 | 12.67 |
| Multifamily residential | 1.02 | 1.11 | 1.16 | 1.20 | 1.32 | 1.34 | 1.45 | 1.45 | 1.27 | 1.22 |
| Nonfarm nonresidential | 6.81 | 7.28 | 6.99 | 7.05 | 7.00 | 7.41 | 7.83 | 7.86 | 8.13 | 8.52 |
| In foreign offices | .19 | .09 | .09 | .06 | .13 | .20 | .16 | .21 | .18 | .31 |
| To depository institutions and acceptances of other banks | .93 | 1.05 | 1.40 | 1.44 | 1.21 | .54 | .56 | .45 | 1.05 | .94 |
| Foreign governments | .06 | .03 | .03 | .02 | .02 | .01 | .02 | .01 | .01 | .03 |
| Agricultural production | .33 | .37 | .32 | .27 | .23 | .19 | .19 | .18 | .21 | .23 |
| Other loans | 2.99 | 2.57 | 2.03 | 1.80 | 1.59 | 1.87 | 1.62 | 1.88 | 2.43 | 2.56 |
| Lease-financing receivables | 3.28 | 3.82 | 3.18 | 2.65 | 2.35 | 2.30 | 2.07 | 1.83 | 1.80 | 1.51 |
| Less: Unearned income on loans | -.04 | -.03 | -.02 | -.02 | -.02 | -.02 | -.01 | -.01 | -.01 | -.01 |
| Less: Loss reserves2 | -1.11 | -1.12 | -1.13 | -1.17 | -1.10 | -1.06 | -.97 | -.87 | -.75 | -1.12 |
| Securities | 17.78 | 17.32 | 19.00 | 20.30 | 21.16 | 21.28 | 19.96 | 19.22 | 19.89 | 16.87 |
| Investment account | 17.27 | 16.10 | 17.71 | 19.17 | 20.09 | 20.12 | 18.80 | 17.72 | 17.99 | 14.99 |
| Debt | 16.62 | 15.50 | 17.32 | 18.82 | 19.88 | 19.96 | 18.69 | 17.60 | 17.88 | 14.84 |
| U.S. Treasury | 1.70 | 1.12 | .67 | .74 | .95 | .89 | .60 | .44 | .38 | .31 |
| U.S. government agency and corporation obligations | 10.57 | 9.70 | 10.09 | 11.45 | 12.99 | 12.80 | 11.62 | 10.07 | 9.06 | 7.72 |
| Government-backed mortgage pools | 5.12 | 4.31 | 5.19 | 6.00 | 6.08 | 5.74 | 4.83 | 4.04 | 3.73 | 3.76 |
| Collateralized mortgage obligations | 2.89 | 2.55 | 2.42 | 2.79 | 3.72 | 3.42 | 3.39 | 2.94 | 2.68 | 2.43 |
| Other | 2.56 | 2.84 | 2.48 | 2.65 | 3.19 | 3.64 | 3.40 | 3.10 | 2.65 | 1.54 |
| State and local government | .99 | .96 | .99 | .97 | .95 | .96 | .98 | 1.01 | 1.16 | 1.03 |
| Private mortgage-backed securities | 1.33 | 1.66 | 2.01 | 2.13 | 2.14 | 2.65 | 3.58 | 4.29 | 4.60 | 3.23 |
| Other | 2.03 | 2.06 | 3.56 | 3.53 | 2.85 | 2.66 | 1.90 | 1.78 | 2.67 | 2.54 |
| Equity | .65 | .60 | .39 | .34 | .21 | .16 | .11 | .12 | .12 | .14 |
| Trading account | .51 | 1.22 | 1.29 | 1.13 | 1.07 | 1.16 | 1.16 | 1.50 | 1.90 | 1.89 |
| Gross federal funds sold and reverse RPs | 3.34 | 3.76 | 4.06 | 4.71 | 4.20 | 2.98 | 2.30 | 2.84 | 3.41 | 4.27 |
| Balances at depositories1 | 3.06 | 2.71 | 2.88 | 3.33 | 3.26 | 3.29 | 2.24 | 2.22 | 2.72 | 4.16 |
| Noninterest-earning assets1 | 11.60 | 11.33 | 11.91 | 11.66 | 11.90 | 11.82 | 12.13 | 12.95 | 12.99 | 14.66 |
| Revaluation gains held in trading accounts | .56 | .40 | .55 | .47 | .60 | .42 | .33 | .30 | .48 | .91 |
| Other | 11.04 | 10.92 | 11.37 | 11.19 | 11.30 | 11.40 | 11.80 | 12.65 | 12.51 | 13.75 |
| Liabilities | 91.66 | 91.57 | 91.15 | 90.79 | 90.65 | 89.87 | 88.86 | 88.08 | 88.40 | 88.17 |
| Core deposits | 48.33 | 46.28 | 46.28 | 47.07 | 47.93 | 46.55 | 48.18 | 46.84 | 47.44 | 46.35 |
| Transaction deposits | 12.12 | 9.93 | 8.37 | 7.49 | 7.29 | 7.06 | 6.64 | 5.74 | 5.15 | 5.13 |
| Demand deposits | 10.52 | 8.61 | 7.17 | 6.32 | 5.96 | 5.65 | 5.35 | 4.54 | 3.90 | 3.89 |
| Other checkable deposits | 1.60 | 1.32 | 1.20 | 1.17 | 1.33 | 1.41 | 1.29 | 1.20 | 1.25 | 1.24 |
| Savings deposits (including MMDAs) | 23.89 | 24.02 | 26.62 | 30.07 | 32.34 | 31.75 | 33.33 | 32.66 | 32.99 | 31.51 |
| Small time deposits | 12.31 | 12.33 | 11.28 | 9.51 | 8.30 | 7.74 | 8.20 | 8.44 | 9.30 | 9.71 |
| Managed liabilities3 | 39.85 | 41.98 | 40.81 | 39.48 | 38.12 | 39.29 | 37.04 | 37.60 | 37.02 | 37.82 |
| Large time deposits | 8.17 | 9.54 | 9.72 | 8.99 | 8.20 | 8.76 | 10.10 | 11.44 | 10.20 | 9.76 |
| Deposits booked in foreign offices | 8.20 | 7.56 | 7.05 | 6.28 | 6.54 | 7.21 | 6.02 | 6.43 | 8.52 | 7.80 |
| Subordinated notes and debentures | 1.71 | 1.54 | 1.53 | 1.44 | 1.38 | 1.39 | 1.31 | 1.32 | 1.40 | 1.31 |
| Gross federal funds purchased and RPs | 9.78 | 9.28 | 9.71 | 9.66 | 9.69 | 8.95 | 7.17 | 6.74 | 6.79 | 6.72 |
| Other managed liabilities | 11.99 | 14.07 | 12.79 | 13.11 | 12.30 | 12.97 | 12.44 | 11.66 | 10.10 | 12.23 |
| Revaluation losses held in trading accounts | .58 | .41 | .52 | .44 | .56 | .40 | .34 | .29 | .47 | .85 |
| Other | 2.91 | 2.91 | 3.54 | 3.80 | 4.05 | 3.64 | 3.30 | 3.35 | 3.48 | 3.15 |
| Capital account | 8.34 | 8.43 | 8.85 | 9.21 | 9.35 | 10.13 | 11.14 | 11.92 | 11.60 | 11.83 |
| Memo | ||||||||||
| Commercial real estate loans4 | 11.00 | 12.06 | 12.06 | 12.24 | 12.10 | 12.85 | 13.93 | 15.05 | 15.95 | 16.01 |
| Other real estate owned5 | .03 | .03 | .04 | .05 | .06 | .05 | .04 | .05 | .06 | .10 |
| Mortgage-backed securities | 9.34 | 8.52 | 9.63 | 10.93 | 11.93 | 11.81 | 11.81 | 11.27 | 11.01 | 9.42 |
| Federal Home Loan Bank advances | n.a. | n.a. | 4.07 | 4.85 | 4.75 | 4.65 | 5.19 | 5.54 | 5.35 | 6.45 |
| Balances at the Federal Reserve1 | .64 | .43 | .36 | .37 | .37 | .28 | .21 | .18 | .19 | 3.89 |
| Interest-earning | n.a. | n.a. | n.a. | n.a. | n.a. | n.a. | n.a. | n.a. | n.a. | 3.18 |
| Noninterest-earning | .64 | .43 | .36 | .37 | .37 | .28 | .21 | .18 | .19 | .72 |
| Interest-earning balances at depositories other than the Federal Reserve | 3.06 | 2.71 | 2.88 | 3.33 | 3.26 | 3.29 | 2.24 | 2.22 | 2.72 | 3.43 |
| Average net consolidated assets (billions of dollars) | 1,879 | 2,031 | 2,130 | 2,124 | 2,287 | 2,376 | 2,403 | 2,579 | 2,798 | 3,177 |
| Effective interest rate (percent)6 | ||||||||||
| Rates earned | ||||||||||
| Interest-earning assets | 7.90 | 8.44 | 7.54 | 6.03 | 5.30 | 5.21 | 5.98 | 6.93 | 6.87 | 5.86 |
| Taxable equivalent | 7.94 | 8.48 | 7.58 | 6.07 | 5.33 | 5.24 | 6.02 | 6.97 | 6.91 | 5.88 |
| Loans and leases, gross | 8.56 | 9.14 | 8.26 | 6.80 | 6.11 | 5.98 | 6.61 | 7.58 | 7.45 | 6.44 |
| Net of loss provisions | 7.86 | 8.25 | 6.96 | 5.59 | 5.11 | 5.19 | 5.89 | 7.04 | 6.64 | 3.76 |
| Securities | 6.41 | 6.64 | 5.96 | 4.79 | 3.80 | 3.63 | 4.18 | 4.99 | 5.25 | 4.85 |
| Taxable equivalent | 6.55 | 6.77 | 6.08 | 4.91 | 3.90 | 3.73 | 4.29 | 5.10 | 5.37 | 4.93 |
| Investment account | 6.43 | 6.66 | 6.04 | 4.86 | 3.87 | 3.64 | 4.11 | 4.84 | 5.18 | 4.74 |
| U.S. Treasury securities and U.S. government agency obligations (excluding MBS) | n.a. | n.a. | 5.83 | 4.28 | 3.17 | 2.94 | 3.47 | 4.28 | 4.85 | 3.92 |
| Mortgage-backed securities | n.a. | n.a. | 6.60 | 5.34 | 4.20 | 4.02 | 4.34 | 5.02 | 5.23 | 5.02 |
| Other | n.a. | n.a. | 5.13 | 4.22 | 3.61 | 3.29 | 4.06 | 4.87 | 5.28 | 4.42 |
| Trading account | 5.62 | 6.25 | 4.83 | 3.59 | 2.56 | 3.39 | 5.30 | 6.74 | 5.94 | 5.72 |
| Gross federal funds sold and reverse RPs | 5.13 | 6.06 | 3.86 | 1.68 | 1.14 | 1.25 | 3.24 | 4.95 | 5.16 | 2.47 |
| Interest-bearing balances at depositories1 | 4.82 | 5.49 | 4.38 | 2.46 | 1.93 | 2.27 | 3.20 | 4.24 | 4.84 | 2.97 |
| Rates paid | ||||||||||
| Interest-bearing liabilities | 4.23 | 4.97 | 3.94 | 2.22 | 1.61 | 1.56 | 2.44 | 3.48 | 3.72 | 2.40 |
| Interest-bearing deposits | 3.80 | 4.42 | 3.60 | 1.96 | 1.35 | 1.29 | 2.03 | 3.07 | 3.33 | 2.16 |
| In foreign offices | 4.71 | 5.38 | 3.67 | 1.70 | 1.23 | 1.42 | 2.76 | 4.10 | 4.01 | 2.21 |
| In domestic offices | 3.64 | 4.26 | 3.60 | 1.99 | 1.36 | 1.27 | 1.95 | 2.95 | 3.22 | 2.15 |
| Other checkable deposits | 2.06 | 2.57 | 2.32 | .94 | .64 | .72 | 1.29 | 2.12 | 2.60 | 1.33 |
| Savings deposits (including MMDAs) | 2.51 | 2.94 | 2.30 | 1.08 | .66 | .65 | 1.30 | 2.14 | 2.44 | 1.36 |
| Large time deposits | 5.00 | 5.88 | 5.11 | 3.37 | 2.70 | 2.49 | 3.31 | 4.45 | 4.46 | 3.14 |
| Other time deposits | 5.08 | 5.73 | 5.42 | 3.68 | 2.95 | 2.58 | 3.03 | 4.09 | 4.74 | 3.87 |
| Gross federal funds purchased and RPs | 4.91 | 6.02 | 3.86 | 1.73 | 1.20 | 1.37 | 3.04 | 4.46 | 4.71 | 2.07 |
| Other interest-bearing liabilities | 5.44 | 6.25 | 5.29 | 3.65 | 3.04 | 2.77 | 3.81 | 4.90 | 5.25 | 3.66 |
| Income and expense as a percentage of average net consolidated assets | ||||||||||
| Gross interest income | 7.03 | 7.54 | 6.70 | 5.31 | 4.67 | 4.63 | 5.28 | 6.08 | 5.99 | 5.02 |
| Taxable equivalent | 7.07 | 7.57 | 6.73 | 5.34 | 4.70 | 4.65 | 5.31 | 6.11 | 6.02 | 5.04 |
| Loans | 5.60 | 6.05 | 5.28 | 4.15 | 3.72 | 3.71 | 4.27 | 4.85 | 4.60 | 3.95 |
| Securities | 1.11 | 1.09 | 1.06 | .90 | .75 | .73 | .77 | .87 | .93 | .71 |
| Gross federal funds sold and reverse RPs | .18 | .22 | .15 | .08 | .04 | .03 | .06 | .13 | .17 | .10 |
| Other | .14 | .18 | .21 | .18 | .15 | .15 | .18 | .23 | .29 | .26 |
| Gross interest expense | 3.29 | 3.96 | 3.14 | 1.77 | 1.30 | 1.26 | 1.94 | 2.78 | 2.96 | 1.90 |
| Deposits | 2.04 | 2.41 | 2.01 | 1.09 | .77 | .74 | 1.18 | 1.84 | 2.04 | 1.28 |
| Gross federal funds purchased and RPs | .51 | .56 | .38 | .17 | .12 | .13 | .23 | .30 | .32 | .14 |
| Other | .74 | .99 | .75 | .51 | .41 | .40 | .53 | .63 | .59 | .48 |
| Net interest income | 3.75 | 3.58 | 3.56 | 3.54 | 3.37 | 3.36 | 3.34 | 3.30 | 3.03 | 3.12 |
| Taxable equivalent | 3.78 | 3.61 | 3.59 | 3.57 | 3.40 | 3.39 | 3.37 | 3.33 | 3.06 | 3.14 |
| Loss provisions7 | .55 | .68 | .91 | .80 | .67 | .55 | .52 | .41 | .55 | 1.69 |
| Noninterest income | 3.38 | 3.18 | 3.35 | 3.30 | 3.29 | 3.09 | 2.81 | 2.91 | 2.73 | 2.35 |
| Service charges on deposits | .42 | .42 | .42 | .42 | .42 | .40 | .37 | .35 | .33 | .32 |
| Fiduciary activities | .48 | .52 | .42 | .42 | .37 | .42 | .35 | .41 | .54 | .41 |
| Trading revenue | .08 | .07 | .08 | .08 | .09 | .07 | .06 | .07 | .09 | -.04 |
| Interest rate exposures | .02 | .02 | .04 | .04 | .04 | -.01 | -.01 | .02 | * | -.02 |
| Foreign exchange rate exposures | .05 | .04 | .03 | .04 | .04 | .05 | .04 | .05 | .08 | .08 |
| Other commodity and equity exposures | * | * | * | * | .01 | .03 | .02 | * | * | * |
| Credit exposures | n.a. | n.a. | n.a. | n.a. | n.a. | n.a. | n.a. | n.a. | .01 | -.10 |
| Other | 2.40 | 2.18 | 2.43 | 2.37 | 2.41 | 2.20 | 2.03 | 2.09 | 1.77 | 1.66 |
| Noninterest expense | 4.15 | 4.00 | 3.95 | 3.73 | 3.64 | 3.55 | 3.36 | 3.34 | 3.45 | 3.54 |
| Salaries, wages, and employee benefits | 1.54 | 1.44 | 1.47 | 1.49 | 1.47 | 1.45 | 1.37 | 1.34 | 1.32 | 1.22 |
| Occupancy | .46 | .43 | .42 | .40 | .41 | .39 | .37 | .33 | .34 | .32 |
| Other | 2.16 | 2.14 | 2.07 | 1.84 | 1.76 | 1.70 | 1.62 | 1.68 | 1.79 | 2.00 |
| Net noninterest expense | .77 | .82 | .60 | .43 | .35 | .45 | .55 | .43 | .72 | 1.19 |
| Gains on investment account securities | -.01 | -.05 | .09 | .10 | .06 | .03 | * | -.03 | -.05 | -.29 |
| Income before taxes and extraordinary items | 2.42 | 2.02 | 2.14 | 2.41 | 2.42 | 2.39 | 2.27 | 2.43 | 1.71 | -.05 |
| Taxes | .87 | .70 | .74 | .82 | .82 | .82 | .77 | .83 | .59 | .12 |
| Extraordinary items, net of income taxes | * | * | * | * | * | * | .01 | .07 | -.05 | -.01 |
| Net income | 1.55 | 1.32 | 1.39 | 1.59 | 1.59 | 1.57 | 1.50 | 1.67 | 1.06 | -.18 |
| Cash dividends declared | 1.17 | .94 | .96 | .99 | 1.05 | .95 | 1.00 | 1.37 | 1.26 | .43 |
| Retained income | .38 | .38 | .43 | .60 | .54 | .62 | .50 | .30 | -.20 | -.62 |
| Memo: Return on equity | 18.59 | 15.72 | 15.74 | 17.24 | 17.03 | 15.54 | 13.48 | 14.05 | 9.16 | -1.55 |
NOTE: Data are as of April 16, 2009.
1. Effective October 1, 2008, the Federal Reserve began paying interest on depository institutions' required and excess reserve balances. Beginning with the 2008:Q4 Call Report, balances due from Federal Reserve Banks are now reported under "Interest-earning assets" rather than "Noninterest-earning assets." Return to table
2. Includes allocated transfer risk reserve. Return to table
3. Measured as the sum of large time deposits in domestic offices, deposits booked in foreign offices, subordinated notes and debentures, federal funds purchased and securities sold under repurchase agreements, Federal Home Loan Bank advances, and other borrowed money. Return to table
4. Measured as the sum of construction and land development loans secured by real estate; real estate loans secured by nonfarm nonresidential properties or by multifamily residential properties; and loans to finance commercial real estate, construction, and land development activities not secured by real estate. Return to table
5. Other real estate owned is a component of other noninterest-earning assets. Return to table
6. When possible, based on the average of quarterly balance sheet data reported on schedule RC-K of the quarterly Call Report. Return to table
7. Includes provisions for allocated transfer risk. Return to table
* In absolute value, less than 0.005 percent. Return to table
n.a. Not available. Return to table
MMDA Money market deposit account. Return to table
RP Repurchase agreement. Return to table
MBS Mortgage-backed securities. Return to table
| D. Banks ranked 101 through 1,000 by assets | ||||||||||
| Item | 1999 | 2000 | 2001 | 2002 | 2003 | 2004 | 2005 | 2006 | 2007 | 2008 |
|---|---|---|---|---|---|---|---|---|---|---|
| Balance sheet items as a percentage of average net consolidated assets | ||||||||||
| Interest-earning assets1 | 91.68 | 91.50 | 91.16 | 91.36 | 91.34 | 91.56 | 91.32 | 91.07 | 91.28 | 91.28 |
| Loans and leases (net) | 61.48 | 62.15 | 62.46 | 61.46 | 61.32 | 63.33 | 65.15 | 67.04 | 68.85 | 70.52 |
| Commercial and industrial | 12.66 | 12.95 | 13.03 | 12.38 | 11.50 | 11.52 | 11.78 | 11.68 | 12.07 | 12.58 |
| U.S. addressees | 12.34 | 12.60 | 12.65 | 12.06 | 11.20 | 11.21 | 11.48 | 11.45 | 11.80 | 12.31 |
| Foreign addressees | .32 | .36 | .38 | .31 | .31 | .31 | .30 | .23 | .27 | .27 |
| Consumer | 10.77 | 10.19 | 9.76 | 8.13 | 6.80 | 6.33 | 5.42 | 5.50 | 5.35 | 5.15 |
| Credit card | 3.37 | 3.27 | 3.65 | 2.63 | 1.82 | 1.91 | 1.24 | 1.63 | 1.88 | 1.76 |
| Installment and other | 7.40 | 6.92 | 6.11 | 5.50 | 4.98 | 4.42 | 4.18 | 3.87 | 3.46 | 3.39 |
| Real estate | 35.89 | 36.93 | 37.64 | 38.92 | 40.95 | 43.38 | 45.86 | 47.88 | 49.50 | 50.78 |
| In domestic offices | 35.87 | 36.91 | 37.62 | 38.89 | 40.90 | 43.32 | 45.78 | 47.78 | 49.41 | 50.78 |
| Construction and land development | 3.48 | 4.15 | 4.90 | 5.40 | 5.89 | 7.01 | 8.86 | 11.01 | 12.85 | 13.04 |
| Farmland | .58 | .65 | .66 | .73 | .80 | .91 | .99 | 1.07 | 1.16 | 1.22 |
| One- to four-family residential | 18.26 | 17.17 | 16.18 | 15.39 | 15.71 | 15.33 | 15.17 | 14.76 | 14.08 | 14.16 |
| Home equity | 1.99 | 2.10 | 2.21 | 2.51 | 2.92 | 3.46 | 3.60 | 3.25 | 3.01 | 3.19 |
| Other | 16.26 | 15.06 | 13.97 | 12.88 | 12.79 | 11.87 | 11.57 | 11.51 | 11.07 | 10.97 |
| Multifamily residential | 1.44 | 1.58 | 1.69 | 1.83 | 2.00 | 2.24 | 2.37 | 2.32 | 2.33 | 2.41 |
| Nonfarm nonresidential | 12.12 | 13.36 | 14.18 | 15.55 | 16.51 | 17.82 | 18.39 | 18.63 | 18.99 | 19.95 |
| In foreign offices | .02 | .02 | .02 | .03 | .05 | .06 | .08 | .10 | .09 | * |
| To depository institutions and acceptances of other banks | .46 | .37 | .38 | .37 | .37 | .25 | .13 | .14 | .14 | .27 |
| Foreign governments | .03 | .03 | .03 | .02 | .02 | .01 | * | * | * | * |
| Agricultural production | .78 | .82 | .85 | .86 | .83 | .82 | .81 | .84 | .88 | .90 |
| Other loans | 1.25 | 1.22 | 1.22 | 1.18 | 1.25 | 1.32 | 1.36 | 1.20 | 1.22 | 1.37 |
| Lease-financing receivables | .78 | .75 | .74 | .75 | .67 | .75 | .75 | .75 | .65 | .65 |
| Less: Unearned income on loans | -.08 | -.08 | -.07 | -.06 | -.06 | -.06 | -.06 | -.06 | -.06 | -.06 |
| Less: Loss reserves2 | -1.06 | -1.04 | -1.12 | -1.10 | -1.02 | -.98 | -.90 | -.88 | -.91 | -1.12 |
| Securities | 25.18 | 24.34 | 22.81 | 23.86 | 24.36 | 23.59 | 21.57 | 19.55 | 18.30 | 16.96 |
| Investment account | 25.10 | 24.25 | 22.70 | 23.80 | 24.23 | 23.54 | 21.50 | 19.47 | 18.10 | 16.80 |
| Debt | 24.34 | 23.46 | 22.28 | 23.30 | 23.79 | 23.18 | 21.21 | 19.20 | 17.69 | 16.27 |
| U.S. Treasury | 2.53 | 1.81 | 1.32 | 1.22 | 1.00 | 1.02 | .83 | .59 | .47 | .36 |
| U.S. government agency and corporation obligations | 16.28 | 15.56 | 14.70 | 15.85 | 16.96 | 16.70 | 15.05 | 13.55 | 12.32 | 11.32 |
| Government-backed mortgage pools | 6.72 | 6.22 | 6.27 | 6.55 | 7.03 | 6.80 | 5.73 | 4.83 | 4.57 | 5.24 |
| Collateralized mortgage obligations | 3.52 | 3.04 | 3.08 | 3.69 | 3.69 | 3.41 | 3.16 | 2.81 | 2.60 | 2.42 |
| Other | 6.04 | 6.30 | 5.35 | 5.60 | 6.24 | 6.49 | 6.16 | 5.90 | 5.15 | 3.66 |
| State and local government | 2.90 | 2.91 | 2.90 | 2.89 | 2.95 | 2.92 | 2.78 | 2.74 | 2.77 | 2.73 |
| Private mortgage-backed securities | 1.03 | .99 | .94 | .99 | .87 | 1.08 | 1.17 | 1.08 | 1.01 | .86 |
| Other | 1.60 | 2.19 | 2.42 | 2.34 | 2.01 | 1.46 | 1.37 | 1.24 | 1.12 | 1.00 |
| Equity | .77 | .79 | .43 | .50 | .43 | .36 | .29 | .27 | .41 | .53 |
| Trading account | .08 | .09 | .11 | .06 | .14 | .05 | .08 | .07 | .20 | .17 |
| Gross federal funds sold and reverse RPs | 3.35 | 3.40 | 4.20 | 4.15 | 3.85 | 2.95 | 2.83 | 2.81 | 2.57 | 2.01 |
| Balances at depositories1 | 1.68 | 1.60 | 1.68 | 1.89 | 1.81 | 1.69 | 1.76 | 1.67 | 1.57 | 1.78 |
| Noninterest-earning assets1 | 8.32 | 8.50 | 8.84 | 8.64 | 8.66 | 8.44 | 8.68 | 8.93 | 8.72 | 8.72 |
| Revaluation gains held in trading accounts | .01 | .02 | .01 | .01 | * | * | * | .03 | .04 | .06 |
| Other | 8.31 | 8.49 | 8.84 | 8.64 | 8.66 | 8.44 | 8.68 | 8.90 | 8.67 | 8.66 |
| Liabilities | 90.90 | 90.95 | 90.32 | 89.93 | 89.68 | 89.18 | 89.10 | 89.01 | 88.87 | 89.23 |
| Core deposits | 62.48 | 60.80 | 60.33 | 61.26 | 61.30 | 60.39 | 59.03 | 58.04 | 59.68 | 58.91 |
| Transaction deposits | 13.93 | 12.29 | 11.48 | 11.37 | 11.50 | 11.77 | 11.15 | 9.82 | 8.43 | 7.74 |
| Demand deposits | 10.19 | 8.97 | 8.23 | 8.05 | 7.96 | 8.12 | 7.87 | 6.99 | 5.94 | 5.32 |
| Other checkable deposits | 3.74 | 3.32 | 3.25 | 3.32 | 3.54 | 3.64 | 3.28 | 2.83 | 2.49 | 2.42 |
| Savings deposits (including MMDAs) | 28.56 | 28.55 | 29.40 | 32.34 | 34.00 | 34.42 | 33.75 | 32.82 | 32.89 | 31.04 |
| Small time deposits | 19.98 | 19.96 | 19.46 | 17.55 | 15.80 | 14.21 | 14.13 | 15.41 | 18.36 | 20.13 |
| Managed liabilities3 | 26.33 | 28.01 | 27.75 | 26.57 | 26.40 | 26.98 | 28.38 | 29.32 | 27.51 | 28.74 |
| Large time deposits | 10.29 | 11.98 | 12.60 | 12.17 | 11.92 | 12.12 | 13.64 | 15.21 | 14.42 | 14.15 |
| Deposits booked in foreign offices | 1.20 | 1.28 | 1.24 | .88 | .64 | .65 | .57 | .52 | .57 | .72 |
| Subordinated notes and debentures | .35 | .30 | .31 | .34 | .35 | .35 | .27 | .24 | .22 | .21 |
| Gross federal funds purchased and RPs | 6.90 | 6.30 | 5.77 | 5.27 | 5.35 | 5.52 | 5.54 | 5.40 | 5.33 | 5.26 |
| Other managed liabilities | 7.58 | 8.15 | 7.84 | 7.90 | 8.13 | 8.34 | 8.35 | 7.94 | 6.97 | 8.39 |
| Revaluation losses held in trading accounts | .01 | * | .01 | .01 | * | * | * | .01 | .01 | .02 |
| Other | 2.09 | 2.13 | 2.23 | 2.08 | 1.98 | 1.81 | 1.69 | 1.64 | 1.66 | 1.57 |
| Capital account | 9.10 | 9.05 | 9.68 | 10.07 | 10.32 | 10.82 | 10.90 | 10.99 | 11.13 | 10.77 |
| Memo | ||||||||||
| Commercial real estate loans4 | 17.27 | 19.32 | 21.03 | 23.05 | 24.62 | 27.28 | 29.84 | 32.22 | 34.52 | 35.86 |
| Other real estate owned5 | .08 | .07 | .08 | .10 | .11 | .10 | .08 | .08 | .11 | .28 |
| Mortgage-backed securities | 11.27 | 10.25 | 10.29 | 11.24 | 11.59 | 11.29 | 10.06 | 8.72 | 8.18 | 8.52 |
| Federal Home Loan Bank advances | n.a. | n.a. | 5.27 | 5.71 | 6.29 | 6.46 | 6.42 | 6.11 | 5.53 | 7.04 |
| Balances at the Federal Reserve1 | .55 | .57 | .54 | .52 | .59 | .55 | .47 | .36 | .29 | 1.45 |
| Interest-earning | n.a. | n.a. | n.a. | n.a. | n.a. | n.a. | n.a. | n.a. | n.a. | 1.14 |
| Noninterest-earning | .55 | .57 | .54 | .52 | .59 | .55 | .47 | .36 | .29 | .31 |
| Interest-earning balances at depositories other than the Federal Reserve | 1.68 | 1.60 | 1.68 | 1.89 | 1.81 | 1.69 | 1.76 | 1.67 | 1.57 | 1.55 |
| Average net consolidated assets (billions of dollars) | 974 | 986 | 1,002 | 1,022 | 1,072 | 1,080 | 1,152 | 1,249 | 1,267 | 1,278 |
| Effective interest rate (percent)6 | ||||||||||
| Rates earned | ||||||||||
| Interest-earning assets | 7.83 | 8.48 | 7.85 | 6.42 | 5.59 | 5.46 | 6.12 | 7.01 | 7.31 | 6.24 |
| Taxable equivalent | 7.92 | 8.56 | 7.94 | 6.50 | 5.67 | 5.53 | 6.19 | 7.08 | 7.38 | 6.30 |
| Loans and leases, gross | 8.74 | 9.42 | 8.76 | 7.31 | 6.56 | 6.25 | 6.90 | 7.79 | 8.02 | 6.72 |
| Net of loss provisions | 8.25 | 8.75 | 7.87 | 6.55 | 6.01 | 5.87 | 6.64 | 7.54 | 7.44 | 5.09 |
| Securities | 6.04 | 6.45 | 5.96 | 4.95 | 3.81 | 3.79 | 4.03 | 4.53 | 4.86 | 4.76 |
| Taxable equivalent | 6.29 | 6.71 | 6.24 | 5.21 | 4.06 | 4.04 | 4.28 | 4.80 | 5.14 | 5.01 |
| Investment account | 6.03 | 6.45 | 5.95 | 4.93 | 3.82 | 3.78 | 4.02 | 4.53 | 4.85 | 4.76 |
| U.S. Treasury securities and U.S. government agency obligations (excluding MBS) | n.a. | n.a. | 5.85 | 4.54 | 3.42 | 3.15 | 3.47 | 4.19 | 4.74 | 4.45 |
| Mortgage-backed securities | n.a. | n.a. | 6.33 | 5.38 | 3.95 | 4.01 | 4.23 | 4.64 | 4.96 | 5.09 |
| Other | n.a. | n.a. | 5.40 | 4.51 | 4.07 | 4.21 | 4.42 | 4.81 | 4.81 | 4.42 |
| Trading account | 7.18 | 9.30 | 6.60 | 14.05 | 3.07 | 10.30 | 6.59 | 4.92 | 5.25 | 4.44 |
| Gross federal funds sold and reverse RPs | 4.98 | 6.15 | 3.91 | 1.73 | 1.27 | 1.57 | 3.31 | 4.94 | 4.87 | 2.12 |
| Interest-bearing balances at depositories1 | 5.07 | 5.76 | 3.93 | 1.79 | 1.26 | 1.47 | 3.29 | 4.58 | 4.56 | 2.21 |
| Rates paid | ||||||||||
| Interest-bearing liabilities | 4.09 | 4.79 | 3.97 | 2.45 | 1.80 | 1.65 | 2.36 | 3.38 | 3.78 | 2.79 |
| Interest-bearing deposits | 3.84 | 4.46 | 3.81 | 2.28 | 1.61 | 1.44 | 2.09 | 3.11 | 3.59 | 2.72 |
| In foreign offices | 5.07 | 6.13 | 4.27 | 2.14 | 1.43 | 1.43 | 3.05 | 4.50 | 4.63 | 2.29 |
| In domestic offices | 3.82 | 4.43 | 3.81 | 2.28 | 1.61 | 1.44 | 2.08 | 3.10 | 3.58 | 2.73 |
| Other checkable deposits | 1.99 | 2.27 | 1.81 | 1.06 | .74 | .72 | 1.18 | 1.74 | 1.89 | 1.17 |
| Savings deposits (including MMDAs) | 2.65 | 3.07 | 2.22 | 1.17 | .75 | .74 | 1.27 | 2.06 | 2.38 | 1.39 |
| Large time deposits | 5.17 | 6.00 | 5.27 | 3.32 | 2.58 | 2.33 | 3.21 | 4.41 | 4.90 | 3.91 |
| Other time deposits | 5.11 | 5.74 | 5.51 | 3.77 | 2.86 | 2.51 | 3.10 | 4.19 | 4.83 | 4.03 |
| Gross federal funds purchased and RPs | 4.82 | 5.95 | 3.82 | 1.83 | 1.29 | 1.45 | 2.94 | 4.52 | 4.49 | 2.30 |
| Other interest-bearing liabilities | 5.47 | 6.46 | 5.32 | 4.22 | 3.57 | 3.37 | 4.02 | 4.75 | 5.04 | 3.66 |
| Income and expense as a percentage of average net consolidated assets | ||||||||||
| Gross interest income | 7.19 | 7.79 | 7.16 | 5.84 | 5.07 | 4.99 | 5.57 | 6.40 | 6.67 | 5.71 |
| Taxable equivalent | 7.27 | 7.86 | 7.23 | 5.91 | 5.15 | 5.06 | 5.64 | 6.46 | 6.74 | 5.76 |
| Loans | 5.47 | 5.96 | 5.59 | 4.56 | 4.07 | 4.01 | 4.55 | 5.29 | 5.58 | 4.80 |
| Securities | 1.51 | 1.58 | 1.33 | 1.15 | .91 | .88 | .86 | .89 | .88 | .80 |
| Gross federal funds sold and reverse RPs | .17 | .21 | .16 | .07 | .05 | .05 | .09 | .14 | .12 | .04 |
| Other | .04 | .04 | .08 | .06 | .05 | .05 | .07 | .09 | .09 | .06 |
| Gross interest expense | 3.20 | 3.79 | 3.14 | 1.92 | 1.41 | 1.29 | 1.84 | 2.67 | 3.00 | 2.24 |
| Deposits | 2.44 | 2.87 | 2.48 | 1.49 | 1.04 | .92 | 1.34 | 2.04 | 2.41 | 1.81 |
| Gross federal funds purchased and RPs | .34 | .38 | .22 | .09 | .07 | .08 | .16 | .24 | .24 | .12 |
| Other | .42 | .54 | .44 | .34 | .30 | .29 | .34 | .39 | .36 | .31 |
| Net interest income | 3.99 | 4.00 | 4.02 | 3.92 | 3.67 | 3.70 | 3.73 | 3.73 | 3.67 | 3.47 |
| Taxable equivalent | 4.07 | 4.07 | 4.10 | 3.99 | 3.74 | 3.77 | 3.79 | 3.79 | 3.73 | 3.52 |
| Loss provisions7 | .39 | .52 | .65 | .54 | .40 | .30 | .24 | .23 | .47 | 1.22 |
| Noninterest income | 2.31 | 2.35 | 2.37 | 2.36 | 2.30 | 2.26 | 2.02 | 1.98 | 1.88 | 1.50 |
| Service charges on deposits | .38 | .36 | .39 | .41 | .41 | .39 | .36 | .35 | .36 | .36 |
| Fiduciary activities | .38 | .44 | .40 | .35 | .34 | .37 | .35 | .30 | .31 | .31 |
| Trading revenue | .02 | .01 | * | * | .01 | .01 | .01 | .01 | .01 | -.01 |
| Interest rate exposures | .01 | .01 | -.01 | * | .01 | .01 | .01 | * | * | * |
| Foreign exchange rate exposures | * | * | * | * | * | * | * | * | * | * |
| Other commodity and equity exposures | * | * | * | * | * | * | * | * | * | -.01 |
| Credit exposures | n.a. | n.a. | n.a. | n.a. | n.a. | n.a. | n.a. | n.a. | * | * |
| Other | 1.53 | 1.55 | 1.58 | 1.60 | 1.54 | 1.49 | 1.30 | 1.32 | 1.20 | .83 |
| Noninterest expense | 3.70 | 3.84 | 3.88 | 3.72 | 3.59 | 3.54 | 3.37 | 3.35 | 3.26 | 3.38 |
| Salaries, wages, and employee benefits | 1.56 | 1.59 | 1.61 | 1.64 | 1.64 | 1.64 | 1.61 | 1.59 | 1.57 | 1.46 |
| Occupancy | .47 | .47 | .46 | .45 | .43 | .43 | .41 | .40 | .40 | .39 |
| Other | 1.68 | 1.78 | 1.81 | 1.63 | 1.53 | 1.48 | 1.36 | 1.35 | 1.28 | 1.53 |
| Net noninterest expense | 1.39 | 1.48 | 1.52 | 1.35 | 1.29 | 1.29 | 1.35 | 1.36 | 1.38 | 1.88 |
| Gains on investment account securities | -.01 | -.04 | .05 | .04 | .05 | .02 | -.01 | -.01 | -.01 | -.21 |
| Income before taxes and extraordinary items | 2.19 | 1.96 | 1.90 | 2.07 | 2.02 | 2.13 | 2.13 | 2.12 | 1.81 | .15 |
| Taxes | .74 | .67 | .66 | .67 | .66 | .68 | .68 | .69 | .57 | .14 |
| Extraordinary items, net of income taxes | .01 | * | .01 | * | .03 | * | * | * | * | * |
| Net income | 1.46 | 1.29 | 1.25 | 1.39 | 1.39 | 1.45 | 1.45 | 1.43 | 1.23 | .01 |
| Cash dividends declared | 1.06 | .92 | 1.33 | 1.19 | 1.64 | .78 | .87 | .89 | .91 | .57 |
| Retained income | .40 | .37 | -.08 | .20 | -.25 | .68 | .58 | .54 | .32 | -.56 |
| Memo: Return on equity | 16.10 | 14.21 | 12.93 | 13.83 | 13.46 | 13.42 | 13.33 | 13.03 | 11.08 | .07 |
NOTE: Data are as of April 16, 2009.
1. Effective October 1, 2008, the Federal Reserve began paying interest on depository institutions' required and excess reserve balances. Beginning with the 2008:Q4 Call Report, balances due from Federal Reserve Banks are now reported under "Interest-earning assets" rather than "Noninterest-earning assets." Return to table
2. Includes allocated transfer risk reserve. Return to table
3. Measured as the sum of large time deposits in domestic offices, deposits booked in foreign offices, subordinated notes and debentures, federal funds purchased and securities sold under repurchase agreements, Federal Home Loan Bank advances, and other borrowed money. Return to table
4. Measured as the sum of construction and land development loans secured by real estate; real estate loans secured by nonfarm nonresidential properties or by multifamily residential properties; and loans to finance commercial real estate, construction, and land development activities not secured by real estate. Return to table
5. Other real estate owned is a component of other noninterest-earning assets. Return to table
6. When possible, based on the average of quarterly balance sheet data reported on schedule RC-K of the quarterly Call Report. Return to table
7. Includes provisions for allocated transfer risk. Return to table
* In absolute value, less than 0.005 percent. Return to table
n.a. Not available. Return to table
MMDA Money market deposit account. Return to table
RP Repurchase agreement. Return to table
MBS Mortgage-backed securities. Return to table
| E. Banks not ranked among the 1,000 largest by assets | ||||||||||
| Item | 1999 | 2000 | 2001 | 2002 | 2003 | 2004 | 2005 | 2006 | 2007 | 2008 |
|---|---|---|---|---|---|---|---|---|---|---|
| Balance sheet items as a percentage of average net consolidated assets | ||||||||||
| Interest-earning assets1 | 92.55 | 92.52 | 92.30 | 92.27 | 92.16 | 92.34 | 92.29 | 92.36 | 92.39 | 92.15 |
| Loans and leases (net) | 59.76 | 62.31 | 62.67 | 62.72 | 62.32 | 63.80 | 65.43 | 66.65 | 67.29 | 67.82 |
| Commercial and industrial | 10.64 | 11.09 | 11.10 | 10.71 | 10.42 | 10.29 | 10.21 | 10.17 | 10.25 | 10.35 |
| U.S. addressees | 10.55 | 11.02 | 11.02 | 10.65 | 10.37 | 10.25 | 10.15 | 10.12 | 10.21 | 10.30 |
| Foreign addressees | .08 | .07 | .07 | .06 | .05 | .04 | .05 | .04 | .04 | .04 |
| Consumer | 8.16 | 7.98 | 7.42 | 6.77 | 6.16 | 5.45 | 4.97 | 4.63 | 4.36 | 4.07 |
| Credit card | .69 | .59 | .59 | .49 | .51 | .40 | .36 | .37 | .37 | .35 |
| Installment and other | 7.47 | 7.39 | 6.83 | 6.28 | 5.64 | 5.05 | 4.61 | 4.25 | 3.99 | 3.72 |
| Real estate | 36.84 | 39.29 | 40.30 | 41.52 | 42.30 | 44.75 | 46.97 | 48.54 | 49.28 | 50.09 |
| In domestic offices | 36.83 | 39.29 | 40.30 | 41.52 | 42.30 | 44.74 | 46.97 | 48.53 | 49.28 | 50.09 |
| Construction and land development | 3.28 | 3.70 | 4.23 | 4.51 | 4.99 | 6.01 | 7.46 | 9.10 | 10.01 | 9.63 |
| Farmland | 2.95 | 3.06 | 3.04 | 3.08 | 3.13 | 3.22 | 3.25 | 3.26 | 3.38 | 3.48 |
| One- to four-family residential | 17.66 | 18.43 | 18.24 | 17.91 | 17.08 | 17.17 | 17.12 | 16.69 | 16.31 | 16.63 |
| Home equity | 1.17 | 1.28 | 1.37 | 1.62 | 1.79 | 2.11 | 2.20 | 2.06 | 2.01 | 2.11 |
| Other | 16.49 | 17.15 | 16.87 | 16.29 | 15.29 | 15.06 | 14.93 | 14.63 | 14.30 | 14.52 |
| Multifamily residential | .98 | 1.04 | 1.06 | 1.16 | 1.28 | 1.41 | 1.48 | 1.47 | 1.50 | 1.61 |
| Nonfarm nonresidential | 11.96 | 13.06 | 13.71 | 14.86 | 15.82 | 16.94 | 17.66 | 18.01 | 18.09 | 18.73 |
| In foreign offices | * | * | * | * | * | * | * | * | * | * |
| To depository institutions and acceptances of other banks | .14 | .12 | .12 | .10 | .09 | .07 | .05 | .05 | .06 | .06 |
| Foreign governments | .01 | .01 | * | * | * | * | * | * | * | * |
| Agricultural production | 4.06 | 3.85 | 3.76 | 3.64 | 3.40 | 3.26 | 3.21 | 3.22 | 3.26 | 3.24 |
| Other loans | .67 | .69 | .67 | .65 | .66 | .68 | .70 | .70 | .70 | .73 |
| Lease-financing receivables | .26 | .27 | .27 | .31 | .26 | .25 | .24 | .26 | .27 | .26 |
| Less: Unearned income on loans | -.15 | -.11 | -.09 | -.07 | -.06 | -.06 | -.05 | -.05 | -.04 | -.04 |
| Less: Loss reserves2 | -.87 | -.88 | -.88 | -.90 | -.92 | -.89 | -.87 | -.87 | -.87 | -.93 |
| Securities | 26.91 | 25.40 | 22.80 | 23.34 | 23.47 | 23.34 | 21.92 | 20.54 | 19.65 | 19.20 |
| Investment account | 26.88 | 25.38 | 22.79 | 23.33 | 23.43 | 23.34 | 21.91 | 20.52 | 19.58 | 19.16 |
| Debt | 26.34 | 24.82 | 22.49 | 23.05 | 23.12 | 23.07 | 21.70 | 20.35 | 19.41 | 18.97 |
| U.S. Treasury | 3.34 | 2.12 | 1.33 | 1.04 | .90 | .81 | .71 | .61 | .47 | .33 |
| U.S. government agency and corporation obligations | 16.89 | 16.95 | 15.27 | 16.07 | 16.23 | 16.57 | 15.64 | 14.73 | 14.01 | 13.44 |
| Government-backed mortgage pools | 3.95 | 3.47 | 3.78 | 4.54 | 4.84 | 4.76 | 4.23 | 3.62 | 3.55 | 4.80 |
| Collateralized mortgage obligations | 2.00 | 1.70 | 1.94 | 2.30 | 2.20 | 1.96 | 1.71 | 1.50 | 1.55 | 1.76 |
| Other | 10.93 | 11.78 | 9.56 | 9.23 | 9.19 | 9.85 | 9.70 | 9.61 | 8.92 | 6.88 |
| State and local government | 4.96 | 4.64 | 4.51 | 4.56 | 4.73 | 4.67 | 4.49 | 4.30 | 4.20 | 4.24 |
| Private mortgage-backed securities | .26 | .23 | .27 | .26 | .21 | .19 | .22 | .24 | .29 | .47 |
| Other | .89 | .88 | 1.11 | 1.12 | 1.05 | .83 | .65 | .48 | .43 | .49 |
| Equity | .53 | .56 | .30 | .27 | .31 | .26 | .20 | .17 | .17 | .19 |
| Trading account | .03 | .02 | .01 | .01 | .04 | .01 | .02 | .02 | .07 | .04 |
| Gross federal funds sold and reverse RPs | 4.17 | 3.22 | 5.01 | 4.26 | 4.27 | 3.33 | 3.24 | 3.53 | 3.92 | 3.29 |
| Balances at depositories1 | 1.71 | 1.59 | 1.82 | 1.95 | 2.11 | 1.86 | 1.69 | 1.64 | 1.54 | 1.84 |
| Noninterest-earning assets1 | 7.45 | 7.48 | 7.70 | 7.73 | 7.84 | 7.66 | 7.71 | 7.64 | 7.61 | 7.85 |
| Revaluation gains held in trading accounts | * | * | * | * | * | * | * | * | * | * |
| Other | 7.45 | 7.48 | 7.70 | 7.73 | 7.84 | 7.66 | 7.71 | 7.64 | 7.61 | 7.85 |
| Liabilities | 89.75 | 89.88 | 89.59 | 89.73 | 89.58 | 89.55 | 89.49 | 89.35 | 88.95 | 89.12 |
| Core deposits | 72.74 | 70.87 | 69.92 | 70.04 | 69.96 | 69.24 | 67.68 | 65.74 | 65.12 | 64.27 |
| Transaction deposits | 23.87 | 23.20 | 22.35 | 22.66 | 23.18 | 23.36 | 22.72 | 20.81 | 18.66 | 17.75 |
| Demand deposits | 12.80 | 12.64 | 12.16 | 12.24 | 12.58 | 12.77 | 12.77 | 11.97 | 10.73 | 10.06 |
| Other checkable deposits | 11.07 | 10.57 | 10.19 | 10.42 | 10.60 | 10.59 | 9.95 | 8.84 | 7.93 | 7.68 |
| Savings deposits (including MMDAs) | 19.77 | 19.19 | 19.38 | 21.32 | 22.43 | 23.24 | 22.98 | 22.66 | 22.68 | 22.56 |
| Small time deposits | 29.10 | 28.48 | 28.20 | 26.05 | 24.36 | 22.64 | 21.98 | 22.28 | 23.78 | 23.97 |
| Managed liabilities3 | 16.09 | 18.08 | 18.67 | 18.79 | 18.78 | 19.57 | 21.04 | 22.76 | 22.92 | 24.02 |
| Large time deposits | 11.52 | 12.51 | 13.55 | 13.21 | 13.07 | 13.15 | 14.53 | 16.49 | 16.91 | 16.64 |
| Deposits booked in foreign offices | .08 | .05 | .06 | .07 | .06 | .07 | .06 | .06 | .05 | .06 |
| Subordinated notes and debentures | .01 | .02 | .02 | .04 | .03 | .04 | .03 | .03 | .03 | .03 |
| Gross federal funds purchased and RPs | 1.79 | 2.06 | 1.55 | 1.51 | 1.52 | 1.76 | 1.74 | 1.82 | 1.82 | 1.87 |
| Other managed liabilities | 2.69 | 3.44 | 3.49 | 3.96 | 4.09 | 4.54 | 4.68 | 4.36 | 4.11 | 5.41 |
| Revaluation losses held in trading accounts | * | * | * | * | * | * | * | * | * | * |
| Other | .92 | .93 | 1.00 | .90 | .84 | .74 | .77 | .84 | .91 | .82 |
| Capital account | 10.25 | 10.12 | 10.41 | 10.27 | 10.42 | 10.45 | 10.51 | 10.65 | 11.05 | 10.88 |
| Memo | ||||||||||
| Commercial real estate loans4 | 16.33 | 17.91 | 19.15 | 20.67 | 22.23 | 24.50 | 26.77 | 28.81 | 29.88 | 30.34 |
| Other real estate owned5 | .11 | .11 | .12 | .14 | .15 | .14 | .13 | .12 | .16 | .35 |
| Mortgage-backed securities | 6.22 | 5.39 | 5.99 | 7.10 | 7.25 | 6.91 | 6.16 | 5.36 | 5.39 | 7.03 |
| Federal Home Loan Bank advances | n.a. | n.a. | 3.34 | 3.71 | 3.87 | 4.32 | 4.46 | 4.14 | 3.93 | 5.20 |
| Balances at the Federal Reserve1 | .93 | .93 | .76 | .79 | .87 | .78 | .70 | .57 | .45 | 1.26 |
| Interest-earning | n.a. | n.a. | n.a. | n.a. | n.a. | n.a. | n.a. | n.a. | n.a. | .82 |
| Noninterest-earning | .93 | .93 | .76 | .79 | .87 | .78 | .70 | .57 | .45 | .45 |
| Interest-earning balances at depositories other than the Federal Reserve | 1.71 | 1.59 | 1.82 | 1.95 | 2.11 | 1.86 | 1.69 | 1.64 | 1.54 | 1.71 |
| Average net consolidated assets (billions of dollars) | 652 | 655 | 675 | 704 | 742 | 768 | 805 | 840 | 862 | 882 |
| Effective interest rate (percent)6 | ||||||||||
| Rates earned | ||||||||||
| Interest-earning assets | 8.04 | 8.44 | 7.92 | 6.79 | 5.94 | 5.73 | 6.23 | 7.01 | 7.26 | 6.34 |
| Taxable equivalent | 8.17 | 8.56 | 8.03 | 6.90 | 6.05 | 5.84 | 6.33 | 7.10 | 7.35 | 6.42 |
| Loans and leases, gross | 9.27 | 9.51 | 9.01 | 7.83 | 7.08 | 6.72 | 7.17 | 7.94 | 8.13 | 7.03 |
| Net of loss provisions | 8.89 | 9.14 | 8.60 | 7.39 | 6.72 | 6.45 | 6.94 | 7.74 | 7.81 | 6.18 |
| Securities | 5.88 | 6.15 | 5.86 | 5.03 | 3.87 | 3.74 | 3.87 | 4.28 | 4.68 | 4.70 |
| Taxable equivalent | 6.29 | 6.54 | 6.27 | 5.43 | 4.26 | 4.11 | 4.24 | 4.65 | 5.06 | 5.05 |
| Investment account | 5.88 | 6.15 | 5.86 | 5.02 | 3.87 | 3.73 | 3.86 | 4.28 | 4.68 | 4.70 |
| U.S. Treasury securities and U.S. government agency obligations (excluding MBS) | n.a. | n.a. | 5.97 | 4.80 | 3.74 | 3.38 | 3.53 | 4.12 | 4.69 | 4.62 |
| Mortgage-backed securities | n.a. | n.a. | 6.20 | 5.47 | 3.58 | 3.90 | 4.17 | 4.59 | 4.96 | 5.08 |
| Other | n.a. | n.a. | 5.29 | 4.87 | 4.43 | 4.18 | 4.16 | 4.25 | 4.33 | 4.28 |
| Trading account | 3.60 | 4.01 | 6.43 | 15.38 | 2.89 | 18.95 | 7.52 | 7.50 | 4.74 | 4.34 |
| Gross federal funds sold and reverse RPs | 4.96 | 6.24 | 3.82 | 1.63 | 1.08 | 1.32 | 3.21 | 4.95 | 5.05 | 2.17 |
| Interest-bearing balances at depositories1 | 5.65 | 6.38 | 4.56 | 2.68 | 1.97 | 2.02 | 3.21 | 4.64 | 5.06 | 3.03 |
| Rates paid | ||||||||||
| Interest-bearing liabilities | 4.32 | 4.84 | 4.43 | 2.93 | 2.14 | 1.88 | 2.44 | 3.42 | 3.91 | 3.06 |
| Interest-bearing deposits | 4.21 | 4.67 | 4.31 | 2.78 | 2.02 | 1.75 | 2.29 | 3.28 | 3.81 | 2.99 |
| In foreign offices | 4.12 | 5.13 | 3.97 | 1.67 | .85 | 1.04 | 2.86 | 4.27 | 4.66 | 2.28 |
| In domestic offices | 4.21 | 4.67 | 4.31 | 2.78 | 2.02 | 1.75 | 2.29 | 3.28 | 3.80 | 2.99 |
| Other checkable deposits | 2.28 | 2.47 | 1.97 | 1.16 | .78 | .69 | .99 | 1.45 | 1.62 | 1.11 |
| Savings deposits (including MMDAs) | 3.20 | 3.56 | 2.81 | 1.72 | 1.13 | 1.04 | 1.53 | 2.34 | 2.67 | 1.65 |
| Large time deposits | 5.21 | 5.89 | 5.52 | 3.61 | 2.79 | 2.47 | 3.21 | 4.37 | 4.90 | 4.03 |
| Other time deposits | 5.24 | 5.70 | 5.60 | 3.88 | 2.96 | 2.55 | 3.04 | 4.12 | 4.79 | 4.06 |
| Gross federal funds purchased and RPs | 4.73 | 5.69 | 3.92 | 1.85 | 1.31 | 1.45 | 2.89 | 4.37 | 4.46 | 2.35 |
| Other interest-bearing liabilities | 8.25 | 9.13 | 8.08 | 6.82 | 5.31 | 4.59 | 5.01 | 5.70 | 5.81 | 4.50 |
| Income and expense as a percentage of average net consolidated assets | ||||||||||
| Gross interest income | 7.48 | 7.83 | 7.33 | 6.31 | 5.46 | 5.32 | 5.78 | 6.49 | 6.73 | 5.87 |
| Taxable equivalent | 7.60 | 7.95 | 7.44 | 6.41 | 5.56 | 5.41 | 5.87 | 6.58 | 6.82 | 5.95 |
| Loans | 5.61 | 5.99 | 5.73 | 5.01 | 4.47 | 4.35 | 4.76 | 5.35 | 5.53 | 4.83 |
| Securities | 1.58 | 1.57 | 1.32 | 1.16 | .89 | .87 | .85 | .88 | .92 | .90 |
| Gross federal funds sold and reverse RPs | .22 | .21 | .20 | .07 | .05 | .05 | .11 | .18 | .20 | .07 |
| Other | .06 | .05 | .08 | .06 | .06 | .05 | .06 | .08 | .08 | .07 |
| Gross interest expense | 3.26 | 3.64 | 3.33 | 2.22 | 1.60 | 1.41 | 1.82 | 2.56 | 2.95 | 2.33 |
| Deposits | 3.02 | 3.30 | 3.07 | 1.98 | 1.41 | 1.22 | 1.58 | 2.27 | 2.67 | 2.08 |
| Gross federal funds purchased and RPs | .08 | .12 | .06 | .03 | .02 | .02 | .05 | .08 | .08 | .04 |
| Other | .15 | .21 | .20 | .21 | .17 | .17 | .19 | .21 | .20 | .21 |
| Net interest income | 4.22 | 4.20 | 4.00 | 4.08 | 3.86 | 3.91 | 3.96 | 3.94 | 3.79 | 3.54 |
| Taxable equivalent | 4.34 | 4.31 | 4.10 | 4.19 | 3.96 | 4.00 | 4.05 | 4.03 | 3.87 | 3.62 |
| Loss provisions7 | .31 | .32 | .33 | .35 | .29 | .23 | .21 | .20 | .28 | .64 |
| Noninterest income | 1.44 | 1.31 | 1.30 | 1.39 | 1.47 | 1.38 | 1.33 | 1.31 | 1.33 | 1.19 |
| Service charges on deposits | .42 | .43 | .44 | .45 | .43 | .43 | .40 | .38 | .37 | .36 |
| Fiduciary activities | .26 | .20 | .25 | .27 | .28 | .31 | .33 | .36 | .38 | .32 |
| Trading revenue | * | * | * | * | * | * | * | * | * | * |
| Interest rate exposures | * | * | * | * | * | * | * | * | * | * |
| Foreign exchange rate exposures | * | * | * | * | * | * | * | * | * | * |
| Other commodity and equity exposures | * | * | * | * | * | * | * | * | * | * |
| Credit exposures | n.a. | n.a. | n.a. | n.a. | n.a. | n.a. | n.a. | n.a. | * | * |
| Other | .75 | .67 | .61 | .67 | .76 | .64 | .61 | .57 | .58 | .50 |
| Noninterest expense | 3.73 | 3.57 | 3.54 | 3.57 | 3.55 | 3.52 | 3.48 | 3.49 | 3.53 | 3.50 |
| Salaries, wages, and employee benefits | 1.82 | 1.78 | 1.79 | 1.82 | 1.82 | 1.81 | 1.79 | 1.82 | 1.84 | 1.76 |
| Occupancy | .49 | .47 | .47 | .46 | .45 | .45 | .44 | .44 | .44 | .44 |
| Other | 1.42 | 1.31 | 1.28 | 1.28 | 1.28 | 1.26 | 1.25 | 1.24 | 1.25 | 1.30 |
| Net noninterest expense | 2.29 | 2.26 | 2.24 | 2.18 | 2.09 | 2.14 | 2.15 | 2.18 | 2.19 | 2.32 |
| Gains on investment account securities | * | -.01 | .04 | .05 | .04 | .01 | * | -.01 | * | -.09 |
| Income before taxes and extraordinary items | 1.62 | 1.61 | 1.46 | 1.60 | 1.53 | 1.55 | 1.60 | 1.55 | 1.31 | .48 |
| Taxes | .47 | .45 | .39 | .41 | .38 | .37 | .38 | .36 | .29 | .10 |
| Extraordinary items, net of income taxes | * | * | * | -.01 | * | * | * | * | * | * |
| Net income | 1.15 | 1.17 | 1.07 | 1.18 | 1.14 | 1.18 | 1.21 | 1.19 | 1.01 | .38 |
| Cash dividends declared | .70 | .79 | .64 | .68 | .67 | .64 | .67 | .65 | .67 | .56 |
| Retained income | .46 | .38 | .43 | .50 | .47 | .54 | .54 | .53 | .35 | -.18 |
| Memo: Return on equity | 11.26 | 11.52 | 10.28 | 11.49 | 10.97 | 11.25 | 11.54 | 11.14 | 9.18 | 3.53 |
Note: Data are as of April 16, 2009.
1. Effective October 1, 2008, the Federal Reserve began paying interest on depository institutions' required and excess reserve balances. Beginning with the 2008:Q4 Call Report, balances due from Federal Reserve Banks are now reported under "Interest-earning assets" rather than "Noninterest-earning assets." Return to table
2. Includes allocated transfer risk reserve. Return to table
3. Measured as the sum of large time deposits in domestic offices, deposits booked in foreign offices, subordinated notes and debentures, federal funds purchased and securities sold under repurchase agreements, Federal Home Loan Bank advances, and other borrowed money. Return to table
4. Measured as the sum of construction and land development loans secured by real estate; real estate loans secured by nonfarm nonresidential properties or by multifamily residential properties; and loans to finance commercial real estate, construction, and land development activities not secured by real estate. Return to table
5. Other real estate owned is a component of other noninterest-earning assets. Return to table
6. When possible, based on the average of quarterly balance sheet data reported on schedule RC-K of the quarterly Call Report. Return to table
7. Includes provisions for allocated transfer risk. Return to table
* In absolute value, less than 0.005 percent. Return to table
n.a. Not available. Return to table
MMDA Money market deposit account. Return to table
RP Repurchase agreement. Return to table
MBS Mortgage-backed securities. Return to table
| Millions of dollars | ||||||||||
| Item | 1999 | 2000 | 2001 | 2002 | 2003 | 2004 | 2005 | 2006 | 2007 | 2008 |
|---|---|---|---|---|---|---|---|---|---|---|
| Gross interest income | 367,123 | 423,845 | 404,251 | 349,603 | 329,218 | 348,667 | 426,600 | 551,039 | 616,995 | 566,000 |
| Taxable equivalent | 369,758 | 426,479 | 406,937 | 352,351 | 332,000 | 351,651 | 429,556 | 554,295 | 620,456 | 568,685 |
| Loans | 279,217 | 326,804 | 311,539 | 269,397 | 257,697 | 269,408 | 328,088 | 421,879 | 464,879 | 426,181 |
| Securities | 62,415 | 67,666 | 63,061 | 59,311 | 53,316 | 58,577 | 65,864 | 78,913 | 82,710 | 81,548 |
| Gross federal funds sold and reverse repurchase agreements | 12,337 | 13,546 | 12,647 | 6,221 | 5,015 | 5,142 | 11,045 | 21,288 | 28,682 | 16,853 |
| Other | 13,157 | 15,829 | 17,006 | 14,672 | 13,189 | 15,538 | 21,602 | 28,959 | 40,723 | 41,418 |
| Gross interest expense | 175,397 | 222,161 | 188,746 | 118,741 | 94,123 | 98,541 | 162,501 | 263,372 | 310,412 | 227,066 |
| Deposits | 119,969 | 151,147 | 132,311 | 81,701 | 62,400 | 63,639 | 105,922 | 173,878 | 212,783 | 154,812 |
| Gross federal funds purchased and repurchase agreements | 21,210 | 26,860 | 19,583 | 9,920 | 7,590 | 8,842 | 19,161 | 33,775 | 37,715 | 19,755 |
| Other | 34,215 | 44,155 | 36,852 | 27,122 | 24,133 | 26,058 | 37,418 | 55,720 | 59,914 | 52,499 |
| Net interest income | 191,726 | 201,684 | 215,505 | 230,862 | 235,095 | 250,126 | 264,099 | 287,667 | 306,583 | 338,934 |
| Taxable equivalent | 194,361 | 204,318 | 218,191 | 233,510 | 237,877 | 253,110 | 267,055 | 290,923 | 310,044 | 341,619 |
| Loss provisions | 21,220 | 29,386 | 43,084 | 45,206 | 32,742 | 23,894 | 25,579 | 25,386 | 56,746 | 170,019 |
| Noninterest income | 144,800 | 153,101 | 160,902 | 168,236 | 183,792 | 188,999 | 201,768 | 222,887 | 218,554 | 207,880 |
| Service charges on deposits | 21,591 | 23,720 | 26,872 | 29,629 | 31,692 | 33,454 | 33,830 | 36,194 | 39,187 | 42,540 |
| Fiduciary activities | 20,519 | 22,202 | 21,988 | 21,404 | 22,453 | 25,088 | 26,381 | 28,312 | 32,962 | 32,907 |
| Trading revenue | 10,437 | 12,235 | 12,382 | 10,794 | 11,605 | 10,303 | 14,375 | 19,170 | 5,289 | -2,336 |
| Other | 92,256 | 94,945 | 99,658 | 106,410 | 118,042 | 120,154 | 127,180 | 139,213 | 141,115 | 134,767 |
| Noninterest expense | 205,207 | 216,375 | 225,979 | 230,128 | 243,214 | 263,304 | 274,136 | 294,890 | 321,406 | 355,910 |
| Salaries, wages, and employee benefits | 86,396 | 89,016 | 94,196 | 100,447 | 108,446 | 115,254 | 124,038 | 135,868 | 144,700 | 147,595 |
| Occupancy | 25,945 | 26,762 | 27,939 | 29,311 | 31,314 | 33,253 | 35,051 | 36,393 | 38,531 | 40,909 |
| Other | 92,867 | 100,598 | 103,846 | 100,368 | 103,453 | 114,797 | 115,048 | 122,629 | 138,177 | 167,406 |
| Net noninterest expense | 60,407 | 63,274 | 65,077 | 61,892 | 59,422 | 74,305 | 72,368 | 72,003 | 102,852 | 148,030 |
| Gains on investment account securities | 246 | -2,280 | 4,630 | 6,411 | 5,633 | 3,393 | -220 | -1,320 | -649 | -16,186 |
| Income before taxes | 110,345 | 106,741 | 111,971 | 130,176 | 148,563 | 155,322 | 165,933 | 188,960 | 146,335 | 4,698 |
| Taxes | 39,315 | 37,249 | 37,284 | 42,816 | 48,498 | 50,264 | 53,568 | 60,956 | 44,230 | 2,199 |
| Extraordinary items, net of income taxes | 169 | -31 | -324 | -68 | 427 | 59 | 241 | 2,647 | -1,672 | 5,388 |
| Net income | 71,199 | 69,461 | 74,363 | 87,291 | 100,494 | 105,115 | 112,604 | 130,652 | 100,433 | 7,887 |
| Cash dividends declared | 52,280 | 52,547 | 54,844 | 67,230 | 77,757 | 59,523 | 64,624 | 82,310 | 85,265 | 43,253 |
| Retained income | 18,919 | 16,915 | 19,519 | 20,062 | 22,738 | 45,591 | 47,981 | 48,340 | 15,168 | -35,367 |
Note: Data are as of April 16, 2009.