
Board of Governors of the Federal Reserve System
International Finance Discussion Papers
Number 861, May 2006-Screen Reader Version*
Exchange-Rate Effects on China's Trade: An Interim Report
NOTE: International Finance Discussion Papers are preliminary materials circulated to stimulate discussion and critical comment. References to International Finance Discussion Papers (other than an acknowledgment that the writer has had access to unpublished material) should be cleared with the author or authors. Recent IFDPs are available on the Web at http://www.federalreserve.gov/pubs/ifdp/. This paper can be downloaded without charge from the Social Science Research Network electronic library at http://www.ssrn.com/.
Abstract:
Though China's share of world trade is comparable to that of Japan, little is known about the response of China's trade to changes in exchange rates. The few estimates available suffer from two limitations. First, the data for trade prices are based on proxies for prices from other countries. Second, the estimation sample includes the period of China's transformation from a centrally-planned economy to a market-oriented system. To address these limitations, this paper develops an empirical model explaining the shares of China's exports and imports in world trade in terms of the real effective value of the renminbi. The specifications control for foreign direct investment and for the role of imports of parts to assemble merchandise exports. Parameter estimation uses disaggregated monthly trade data and excludes the period during which most of China's decentralization occurred. The estimation results suggest that a ten-percent real appreciation of the renminbi lowers the share of aggregate Chinese exports by a half of a percentage point. The same appreciation lowers the share of aggregate imports by about a tenth of a percentage point.
Keywords: Renminbi, foreign direct investment, income elasticity, trade shares, automated specification
JEL classification: F41, C51, C52
1 Introduction
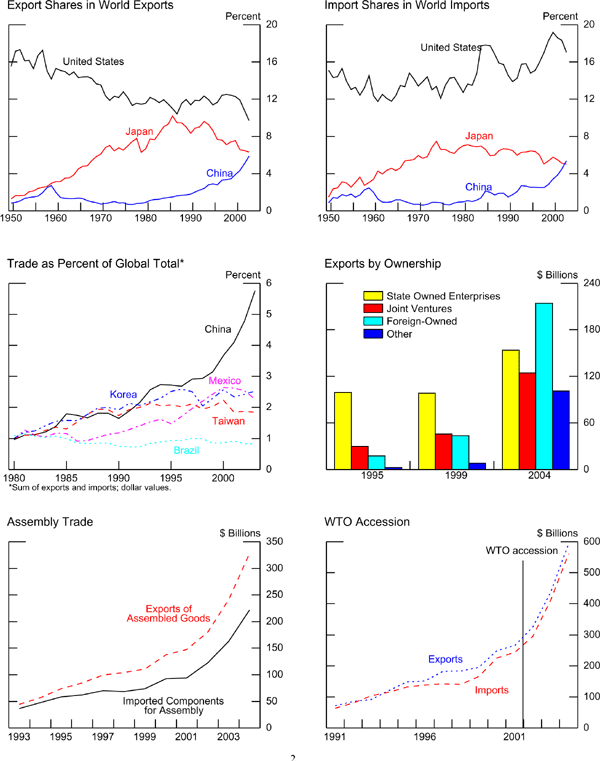
That China's role in world trade has changed from insignificance to relevance is well known. Starting from an almost completely closed economy in 1978, with trade representing just less than 1 percent of global trade, Chinese total trade in goods exceeded 6 percent of the world total in 2004 (figure 1). This share leaves Chinese trade behind only the United States and Germany in total trade value. Indeed, figure 1 shows that China doubled her share in world trade since 1993, a doubling that neither Japan nor any emerging-market economies have accomplished over such a short horizon. Given the growing importance of China in the global economy and the fact that the Chinese authorities have permitted the exchange rate to appreciate gradually since July 2005, the question of how Chinese trade responds to movements in the Chinese exchange rate is gaining attention.2
Addressing this question requires information on the effects of price changes on China's trade, but such information is not available. Indeed, it is easier to find estimates of price effects for some of the smaller industrialized countries than it is for China. There are three reasons for the lack of work on estimating price effects for Chinese trade. First, the state controlled much of the economy 25 years ago and so information on trade elasticities was not relevant; section 2 reviews the main changes in trade policies since 1978. Second, the stability of the real effective exchange rate makes it difficult to identify the effects of exchange rates on trade. Third, data on Chinese trade prices are not available. To be sure, the literature offers estimated price effects but they are based on proxies for the unobservable Chinese price data which, as section 3 reviews, are of questionable usefulness.
Our aim in this paper is to estimate the responsiveness of Chinese trade to changes in exchange rates without using proxies for trade prices. Avoidance of proxies seems a minor issue but, as a matter of principle, one would question estimated price effects if a study of U.S. trade were to rely solely on prices for U.S. trade with Mexico as a proxy for U.S. multilateral trade prices, or even worse, if the study were using Canadian trade prices as a proxy for all U.S. trade prices. For the case of China, one would question the usefulness of estimated exchange-rate effects based on trade prices from half of Chinese trade or on trade prices from Hong Kong or other countries to proxy for all Chinese trade prices. Yet, that is the basis for the information that is currently available on exchange-rate effects.
To avoid reliance on such proxies, we model Chinese nominal trade shares instead of trade volumes. Section 4 highlights the advantages of our strategy and notes its main drawback: one cannot identify the price responsiveness of trade volumes. However, given that previous results on Chinese trade rely on proxies that are far from perfect, our approach may be a way of getting an untainted picture of what will actually happen to the value of Chinese trade, albeit not a picture of what will happen to the volume of Chinese trade.
To estimate the responsiveness of China's trade to changes in exchange rates, section 5 develops specifications to explain movements in trade shares in terms of movements in economic activity, movements in the real effective value of the renminbi, and the stock of foreign direct investment, an important factor associated with Chinese trade. Indeed, foreign-owned companies were the largest exporters in 2004 and their share of exports rose from 13 percent in 1995 to more than one-third by 2004 (figure 1). The specifications also allow for the use of imports of parts in the assembly of exports of goods; this usage quickly grew and approached 50 percent of total Chinese trade by the mid 1990s (figure 1).
As section 6 documents, we use Chinese trade data disaggregated into imports of components for assembly, exports of the assembled goods, imports of final products, and exports of final products. Using these data may help to explain why some studies have not found a strong relationship between the value of the exchange rate and the volume of trade (however measured). Indeed, because China uses imports of components to meet the demand for the exports of the goods assembled from these imports, it is not clear (ex-ante) what effect a change in the exchange rate would have on the demand for the assembled goods. Specifically, the effect of an exchange-rate appreciation on the demand for exports of assembled goods could be muted by the effect on the price of the imports of the components for assembly. What is clear, though, is that the estimation of exchange-rate effects should be done separately for these two groups of goods.
The results, described in section 7, suggest that a ten percent real appreciation of the renminbi lowers China's export share of world trade by about one-half of a percentage point in the long-run. The response of China's import share depends on the type of product. For imports of final products, the ten percent appreciation lowers the share by one-tenth of a percentage point whereas for imports of components for assembly of exportables, the appreciation raises the share by a negligible amount. Combining these two responses suggests that a real appreciation of the renminbi lowers China's import share of world trade.
We want to emphasize that our results refer to multilateral trade and ignore potential differences in the exchange-rate sensitivity of China's trade across trading partners. In addition, we abstract from the multitude of patterns of bilateral exchange-rate re-alignments that might be associated with a hypothetical one percent appreciation of the real effective exchange rate.
Figure 1
2 Deregulation of China's Trade Policies
The status of China's trade before 1978 is best summarized by Lardy (2002). Before 1978, China's regulations affected international trade through three channels. First, most decisions about trade were planned by the state in terms of physical quantities. Inputs to the production process that could not be supplied domestically were imported, and goods that were in excess supply were exported in order to finance imports. When exports were not sufficient to finance imports, domestic consumption was cut in order to allow for more exports. Second, trade was carried out by a handful of state-owned trading companies, each with a monopoly on trade in certain goods. Third, international prices played no role in determining supply and demand behavior. If goods were to be exported, the producer received the government-set domestic price of the good, regardless of the world market price. Similarly, imports were sold at the domestic market price of comparable goods, regardless of the good's world market price or the exchange rate.
In 1978, China's President Deng initiated unprecedented economic reforms that affected international trade in several ways. First, through 1988, economic reforms diminished both the physical planning of imports and the use of exports as a means to finance imports. Second, tariff exemptions were extended to imports for the purpose of processing, assembly, and re-export. Indeed, assembly trade quickly grew and approached 50 percent of total Chinese trade by the mid 1990s (figure 1). This process allowed China's assembly industry to take advantage of a large labor endowment and freed the assembly sector from existing domestic price distortions. From 1990 to 2001, the number of goods exempt from any tariff increased, and the use of non-tariff barriers declined significantly. Domestic prices also reflected market forces and, by the end of the 1990s, market-determined prices had become the norm within China.3 Since accession to WTO in 2001, China has eliminated virtually all non-tariff barriers to imports; figure 1 shows the associated expansion of China's trade.
An important implication of this deregulation process is that parameter estimation should use data from the mid-1990s onward. As Lardy (2002, p. 55) notes
Through the mid-1980s the volume of exports and the volume of imports generally were not responsive to changes in the real exchange rate. Because the government specified quantitative targets for most imports and exports, changes in relative domestic and international prices had no discernible effect on the volume of exports or imports.
To address this limitation, we use high-frequency data beyond 1990.
3 Literature Review
There are several reasons for the lack of work on estimating Chinese trade elasticities, especially relative to other countries whose share of world trade is much smaller than China's share. First, because the state controlled much of the economy 25 years ago, including almost all trade, neither the exchange rate nor other relative prices played an allocative role in Chinese trade. Thus, estimates of trade elasticities were not important. Even after state control of Chinese trade was dismantled from the late 1970s to the mid 1990s, at which time Chinese trade had become almost completely market driven, the Chinese exchange rate was managed by the authorities. There was little movement in the nominal exchange rate, and there was relatively little movement in the real effective exchange rate and both features complicate identifying the effects of exchange rates on trade. Finally, anyone who tried to estimate trade elasticities using conventional models was left having to deal with a host of data problems, including most importantly a lack of Chinese data on trade prices.
Cerra and Dayal-Gulati (1999) model both exports and imports using quarterly data from 1983 through 1997. They use the world unit price of manufactured goods to deflate Chinese exports and a composite index of partner-country export prices to deflate Chinese imports. They found that breaking the sample in 1988 improved results significantly, with the later period yielding statistically significant results for the export and import price elasticities.
Cerra and Saxena (2003) look at Chinese exports to determine the extent to which Chinese export supply responds to market signals. They construct an index of export unit values and an index of export volumes for Chinese exports. However, they are only able to do this for a subsample of all trade. In the larger of the two data sets they use, they have data for more than 50 percent of total export trade, with the best coverage for commodities, but with about 95 percent of the missing data being from manufacturing industries. They use quarterly data from 1985 to 2001. Notably among their results, they find that their estimate of the price elasticity of export supply changes over time as the export regime was reformed, and in fact the estimate changes sign between the early and late periods of their sample.
Lau, Mo, and Li (2004) estimate export and import trade elasticities for China using a sample of quarterly data from 1995 to 2003. This choice of dates avoids the period of structural adjustment during which previous papers found the exchange rate to have little effect on trade. They report results for real exports and real imports but do not specify the way in which they deflated the nominal data. However, their export equation focuses only on exports to the G3 countries. Thus it is possible they are using import prices from those partner countries. Also of interest is the fact that in modeling Chinese imports, they break down imports into imports for domestic use and imports for processing and re-export. In none of their equations do they get a significant coefficient on the exchange rate, but the results from the equations suggest that modeling processing and ordinary trade separately may be useful.
Eckaus (2004) reports exchange-rate effects on China's exports to the United States using annual data from 1985 to 2002. He considers two specifications that differ in the dependent variable: the level of China's exports to the United States and the share of U.S. imports from China. For the first specification, Eckaus does not indicate whether the dependent variable is measured in nominal or real terms and, if the latter, the paper does not indicate which deflator is being used to estimate the volume of exports. Because neither China nor the United States report bilateral prices for this trade during Eckaus' sample, the presumption is that a proxy price is being used to measure the volume of bilateral exports. The specification in terms of shares avoids the use of proxies and the associated results suggest that exchange rates do not have a statistically significant effect on China's exports to the United States.
Kamada and Takagawa (2005) estimate the exchange-rate effects for the growth rate of multilateral, aggregate imports in real terms in terms of the growth rates of real GDP, of the real exchange rate, and of future exports; the estimation period is from 1994 to 2000. The paper uses a fixed export-share model to determine China's aggregate exports as the weighted sum of other countries' imports. The paper uses Japanese export prices as a proxy for China's import prices and the estimation results indicate that changes in the real exchange rate do not have an effect on the growth rate of China's imports.4 In their model simulations, a ten percent appreciation of the Yuan raises China's imports by 1.4 after one year; the increase of exports is negligible.
Liang and Fung (2005) use a sample from 1990 to 2004 of quarterly data on Chinese exports and imports, which they deflate using Hong Kong data on total export and total import unit value data, respectively. They also estimate separate equations for Chinese total imports and imports for domestic use. Their results for exports were of the expected sign and statistically significant, but the results for their import equations did not yield statistically significant results. Because some of Chinese trade goes through Hong Kong, one could argue that their proxy is the best one. But even if the choice of this proxy were reasonable for their study, the evolution of China's trade is undermining the reliability of using the price of imports for Hong Kong as representative of the composition of imports of China. Indeed, the share of Chinese imports shipped through Hong Kong declined from 10 percent in 1993 to 2 percent in 2004; the corresponding decline in the export share is from 24 percent in 1993 to 17 percent in 2004.5
Thorbecke (2006) estimates income and exchange-rate elasticities for China's multilateral exports and for trade with the United States (exports and imports). The parameter estimates associated with multilateral exports are obtained using a panel that includes trade with 30 countries from 1982 to 2003; the trade data are disaggregated across final products, intermediate products, and capital goods. To express the value of these trade flows into their real counterparts, the paper uses the U.S. consumer price index. For China's trade with the United States, the estimates rest on a sample from 1987 to 2004 and, again, the U.S. CPI is used to deflate the value of trade. Thorbecke finds that the evidence for China is not conclusive enough to characterize the effect of a change in the exchange rate on China's trade.
Rodrik (2006) offers several observations about the character of China's trade based on the relationship between a country's productivity and the commodity composition of the country's exports. Rodrik reports that the degree of "sophistication" of the commodity composition of China's exports is above that found in countries with productivity similar to that of China. Rodrik does not examine the role of exchange rates on China's trade.
Overall, these papers offer two important lessons that we adopt. First, one needs to use data starting in the 1990s and exclude the period when China's trade regime was being transformed from state controlled to market oriented. To recognize this consideration, we use monthly data from 1992 to 2004. Second, disaggregation of trade matters for estimation. Indeed, the papers reviewed here find that separating imports for domestic use from imports used for assembly of products for exports influences significantly the characterization of the behavior of China's trade. The existing literature also offers a challenge: is it possible to obtain a useful characterization of Chinese trade that does not rely on proxies for prices?
4 Implications of Proxies for Modeling Trade
The conventional approach for estimating trade elasticities assumes that foreign and domestic products are imperfect substitutes for each other (see Goldstein and Khan, 1985). For imports, this assumption is implemented as
| (1) |
where ![]() is the volume of
imports,
is the volume of
imports, ![]() is real GDP,
is real GDP,
![]() is the relative price
of imports measured as
is the relative price
of imports measured as
![]() ,
,
![]() is the deflator
for imports,
is the deflator
for imports, ![]() is the
GDP deflator,
is the
GDP deflator, ![]() is the
income elasticity, and
is the
income elasticity, and ![]() is the price elasticity.
is the price elasticity.
Parameter estimation of the imperfect substitute model needs
data for the volume of trade and for the level of real income,
![]() and
and ![]() Typically, data for these variables
are generated by deflating the value of trade and the value of
income by the corresponding price deflators,
Typically, data for these variables
are generated by deflating the value of trade and the value of
income by the corresponding price deflators, ![]() and
and ![]() However, because the data for
these deflators are not generally available for China, one needs to
deflate these nominal magnitudes using proxies that replace the
unobservable prices. The proxies for Chinese trade prices include
unit values constructed from a subset of Chinese trade data, trade
unit values for the world or other countries, and trade price data
from China's trading partners, especially from Hong Kong.
However, because the data for
these deflators are not generally available for China, one needs to
deflate these nominal magnitudes using proxies that replace the
unobservable prices. The proxies for Chinese trade prices include
unit values constructed from a subset of Chinese trade data, trade
unit values for the world or other countries, and trade price data
from China's trading partners, especially from Hong Kong.
To emphasize how such proxies are applied, suppose we use the import price of Hong Kong as the proxy for the import price of China and China's CPI as the proxy for China's domestic prices. In that case, the variables used in the model would be constructed as


where ![]() is the value of
imports,
is the value of
imports,
![]() ,
,
![]() is the value of GDP,
is the value of GDP,
![]() is the CPI,
is the CPI,
![]() is the import
price of Hong-Kong in US$, and
is the import
price of Hong-Kong in US$, and
![]() is the
price of a renminbi in terms of U.S. dollars (an increase means a
nominal appreciation of the renminbi). Based on these proxies,
equation (1) becomes
is the
price of a renminbi in terms of U.S. dollars (an increase means a
nominal appreciation of the renminbi). Based on these proxies,
equation (1) becomes
 |
(2) |
which allows the estimation of ![]() and
and ![]()
With these estimates, one can predict the volume of imports as
where the symbol `
![]() '
represents an estimate. But predictions for import volumes that are
conditioned on price proxies are biased and, as a result,
predictions for the value of imports are also biased. To emphasize
this result, we assume (for expository reasons only) that
'
represents an estimate. But predictions for import volumes that are
conditioned on price proxies are biased and, as a result,
predictions for the value of imports are also biased. To emphasize
this result, we assume (for expository reasons only) that
| (3) |
where ![]() is the "correct"
but unobserved import price index for Chinese imports and
is the "correct"
but unobserved import price index for Chinese imports and ![]() is the
unobserved measurement error; there is no presumption that
is the
unobserved measurement error; there is no presumption that
![]() will have an
expected value of zero. With this assumption, the prediction for
the volume of imports is given by substituting equation (3) into equation
(2):
will have an
expected value of zero. With this assumption, the prediction for
the volume of imports is given by substituting equation (3) into equation
(2):
|
||
|
The term
![]() measures the prediction bias
of the volume of imports due to using a proxy for the import price.
As a result, the predicted value of
imports is given by
measures the prediction bias
of the volume of imports due to using a proxy for the import price.
As a result, the predicted value of
imports is given by
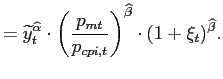
| (4) | ||
![$\displaystyle =[\widetilde{y}_{t}^{\widehat{\alpha}}\cdot\left( \frac{p_{mt}}{p... ...a}}\cdot(1+\xi_{t})^{\widehat{\beta}}]\cdot\left[ p_{mt}\cdot(1+\xi_{t})\right]$](img36.gif)
|
||
![$\displaystyle =[\widetilde{y}_{t}^{\widehat{\alpha}}\cdot\left( \frac{p_{mt}}{p... ... }\right) ^{\widehat{\beta}}]\cdot p_{mt}\cdot(1+\xi_{t})^{1+\widehat{\beta} }.$](img37.gif)
|
In addition to showing that the forecasts for the value of imports are biased, equation (4) shows that the
magnitude of this bias depends on the magnitude of the price
elasticity. Specifically, if this elasticity is minus one (
![]() ),
then
),
then
![]() meaning that the
forecast of the value of imports is not biased on account of the
use of a proxy for import prices. Intuitively, the measurement
error in
meaning that the
forecast of the value of imports is not biased on account of the
use of a proxy for import prices. Intuitively, the measurement
error in
![]() cancels with the measurement error in
cancels with the measurement error in
![]() leaving the forecast of the value of imports unaffected. However,
such canceling requires knowing in advance the answer to the
question that is being posed here - namely, what is the price
responsiveness of China's imports - and so it is not pursued here.
leaving the forecast of the value of imports unaffected. However,
such canceling requires knowing in advance the answer to the
question that is being posed here - namely, what is the price
responsiveness of China's imports - and so it is not pursued here.
To avoid these pitfalls, we replace models explaining the volume
of trade with models explaining the share of China in world trade.
Our focus on trade shares does not remove all measurement errors
because official statistics are still subject to errors associated
with smuggling, misreporting, and misrecording. Our approach,
however, avoids the distortions induced by deflating trade values
with proxies for trade prices. One advantage of this strategy is
that one can generate forecasts of the value of China's trade
without depending on proxies for trade prices. To illustrate this
property, we postulate that the import share (![]() depends on economic activity
(
depends on economic activity
(![]() ) and the real exchange
rate (
) and the real exchange
rate (![]() ):
):
|
(5) |
where
![]() is the
value of world imports excluding China's and
is the
value of world imports excluding China's and ![]() is the vector of unknown
parameters, the estimation of which is the focus of this paper.
Given these estimates, and forecasts for
is the vector of unknown
parameters, the estimation of which is the focus of this paper.
Given these estimates, and forecasts for ![]()
![]() and
and
![]() , the
forecast of the value of Chinese imports is
, the
forecast of the value of Chinese imports is
| (6) |
This approach has two advantages. First, the forecasts are not influenced by proxies for trade prices or by assumptions about price elasticities. Second, all of the explanatory variables are available at high frequency with minimal reporting delays. Whether this approach is helpful, however, depends on the properties of the parameter estimates and the statistical reliability of the associated equations. To these issues we now turn.
5 Trade Share Model
5.1 Imports
We express the dollar value of China's imports relative to the
dollar value of rest of the world
imports, ![]() as
as
|
(7) |
where ![]() is the dollar
price of exports to China,
is the dollar
price of exports to China, ![]() is the volume of imports,
is the volume of imports, ![]() is the volume of imports of
the rest of world, and
is the volume of imports of
the rest of world, and
![]() is the
dollar price of those imports. Though neither
is the
dollar price of those imports. Though neither ![]() nor
nor ![]() are observed directly, their product
is recorded by Chinese statistical agencies.6
are observed directly, their product
is recorded by Chinese statistical agencies.6
Our choice of scaling variable is motivated by forecast
considerations. Specifically, the alternative of scaling by the
dollar value of world imports,
![]() is not
helpful from a forecasting standpoint. Indeed, if one were to
forecast Chinese imports conditioned on world trade, then one would
be, in effect, conditioning on
is not
helpful from a forecasting standpoint. Indeed, if one were to
forecast Chinese imports conditioned on world trade, then one would
be, in effect, conditioning on
![]() which is
what one wants to forecast. This consideration would not be
relevant if China's trade shares were either small or constant but
they are large and growing. Another scaling variable is the value
of China's nominal GDP but the associated data are not available at
the monthly frequency that is used here.
which is
what one wants to forecast. This consideration would not be
relevant if China's trade shares were either small or constant but
they are large and growing. Another scaling variable is the value
of China's nominal GDP but the associated data are not available at
the monthly frequency that is used here.
We assume that ![]() depends on three factors: the real exchange rate, China's economic
activity, and the stock of foreign-direct investment in China.
Reliance on income and the real exchange rate as explanatory
factors implies that trade flows are driven by demand
considerations. However, the formulation controls for the effect of
foreign-direct investment on trade flows (Swenson, 2004). The
estimating equation that we postulate is
depends on three factors: the real exchange rate, China's economic
activity, and the stock of foreign-direct investment in China.
Reliance on income and the real exchange rate as explanatory
factors implies that trade flows are driven by demand
considerations. However, the formulation controls for the effect of
foreign-direct investment on trade flows (Swenson, 2004). The
estimating equation that we postulate is
| (8) |
where ![]() is the lag operator,
is the lag operator,
![]() is China's industrial
production,
is China's industrial
production, ![]() is
the stock of foreign direct investment in China scaled by
is
the stock of foreign direct investment in China scaled by
![]() ,
,
![]() is the
real effective value of the renminbi, and
is the
real effective value of the renminbi, and ![]() is a random disturbance.7 The estimating equation includes dummy
variables to capture monthly seasonality, China's accession to the
WTO, and China's New Year, a widely celebrated holiday. The
long-run coefficients are
is a random disturbance.7 The estimating equation includes dummy
variables to capture monthly seasonality, China's accession to the
WTO, and China's New Year, a widely celebrated holiday. The
long-run coefficients are
![]() for industrial production;
for industrial production;
![]() for foreign direct investment; and
for foreign direct investment; and
![]() for the real exchange rate.
for the real exchange rate.
We expect an increase in industrial production to raise the
demand for imports and thus to raise China's share of world
trade-that is, we expect ![]() Strong prior beliefs about
Strong prior beliefs about ![]() are difficult to defend because, as
Swenson (2004) documents, the effect of an increase in foreign
direct investment depends on whether this investment generates
substitution or complementary effects in the host country.
Substitution effects arise if foreign-direct investment activities
are geared to producing in the host country what would otherwise be
imported. Complementarity effects arise if the investment induces
an increase in the host country's demand for other products that
originate in the multinational's country or in their foreign
competitors. From an empirical standpoint, Swenson (2004) notes
that disaggregation of trade is central to differentiating between
these two effects.
are difficult to defend because, as
Swenson (2004) documents, the effect of an increase in foreign
direct investment depends on whether this investment generates
substitution or complementary effects in the host country.
Substitution effects arise if foreign-direct investment activities
are geared to producing in the host country what would otherwise be
imported. Complementarity effects arise if the investment induces
an increase in the host country's demand for other products that
originate in the multinational's country or in their foreign
competitors. From an empirical standpoint, Swenson (2004) notes
that disaggregation of trade is central to differentiating between
these two effects.
The coefficient ![]() denotes the response of the import share to changes in the real
exchange rate. The expectation is for a real appreciation to raise
the volume of China's imports and for such an increase to raise
China's import share. This response depends, however, not just on
the response of the volume of imports but also on the response of
prices and, thus, the sign of the exchange-rate effect on the
import share is not known in advance. Specifically, appendix
(9.1) shows that
denotes the response of the import share to changes in the real
exchange rate. The expectation is for a real appreciation to raise
the volume of China's imports and for such an increase to raise
China's import share. This response depends, however, not just on
the response of the volume of imports but also on the response of
prices and, thus, the sign of the exchange-rate effect on the
import share is not known in advance. Specifically, appendix
(9.1) shows that
![$\displaystyle \frac{\partial w_{m}}{\partial q_{\frac{f}{R}}}=\left[ \frac{p_{m... ...{\ast} }{\partial q_{\frac{f}{R}}}(\varepsilon_{m}^{\ast}+1)\right] \gtrless0, $](img71.gif)
where
![]() is the
response of Chinese import prices to changes in the renminbi;
is the
response of Chinese import prices to changes in the renminbi;
![]() is the
price elasticity of the volume of China's imports;
is the
price elasticity of the volume of China's imports;
![]() is the response of the price of imports for the rest of the world;
and
is the response of the price of imports for the rest of the world;
and
![]() is the price elasticity of the volume of imports of the rest of the
world. The first term captures the drawback of not having price
data: using data for trade values does not allow differentiating
between price and volume responses. The second term recognizes that
movements in
is the price elasticity of the volume of imports of the rest of the
world. The first term captures the drawback of not having price
data: using data for trade values does not allow differentiating
between price and volume responses. The second term recognizes that
movements in ![]() are also
influenced by changes in the value of the rest of the world's
imports.
are also
influenced by changes in the value of the rest of the world's
imports.
Despite this lack of identification, one may study how
alternative assumptions might reduce the number of factors
affecting
![]() For
example, if one is willing to assume that the price elasticity of
For
example, if one is willing to assume that the price elasticity of
![]() is one (
is one (
![]() ), then8
), then8
 |
(9) |
This expression reveals that the sign of the exchange-rate effect
on the import share depends on the response of the dollar import
price of China and on the magnitude of the price elasticity of
China's imports. If one is willing to assume further that China's
domestic products are not suitable substitutes for imports (
![]() ) and that an appreciation
of the renminbi raises China's dollar import prices (
) and that an appreciation
of the renminbi raises China's dollar import prices (
![]() )
then
)
then
![]() : an appreciation of the renminbi raises China's import
share of world trade. We emphasize that these assumptions are not
designed to solve the identification problem by assuming it away
but, rather, to assess the extent to which the empirical evidence
shown below is consistent with theory.
: an appreciation of the renminbi raises China's import
share of world trade. We emphasize that these assumptions are not
designed to solve the identification problem by assuming it away
but, rather, to assess the extent to which the empirical evidence
shown below is consistent with theory.
5.2 Exports
For exports, the trade `` share'' is
 |
(10) |
where ![]() is China's dollar
export price,
is China's dollar
export price, ![]() is the
volume of exports,
is the
volume of exports, ![]() is the volume of exports of the rest of
world, and
is the volume of exports of the rest of
world, and
![]() is the
dollar price of those exports. Again, neither
is the
dollar price of those exports. Again, neither ![]() nor
nor ![]() are observed directly, but their
product is recorded by Chinese statistical agencies. Note that the
alternative of re-scaling by the dollar value of world trade is not helpful from a forecasting
standpoint as one would be conditioning on what is being
forecasted.
are observed directly, but their
product is recorded by Chinese statistical agencies. Note that the
alternative of re-scaling by the dollar value of world trade is not helpful from a forecasting
standpoint as one would be conditioning on what is being
forecasted.
We assume that ![]() depends on four factors: World economic activity, the real exchange
rate, the stock of foreign-direct investment in China, and imports
of components that are used to assemble exports. Reliance on world
economic activity and the real exchange rate as explanatory factors
implies that trade flows are driven by demand considerations. The
formulation also controls for the role of imports of parts that are
used to assemble exports. Indeed, as noted by Lau, Mo, and Li
(2004) and documented in figure 1, a substantial fraction of
China's imports are used for producing goods for exports.9 Finally, as Lardy (2005), documents,
China has experienced rapid increases in FDI from firms that use
China as a platform for their exports.
depends on four factors: World economic activity, the real exchange
rate, the stock of foreign-direct investment in China, and imports
of components that are used to assemble exports. Reliance on world
economic activity and the real exchange rate as explanatory factors
implies that trade flows are driven by demand considerations. The
formulation also controls for the role of imports of parts that are
used to assemble exports. Indeed, as noted by Lau, Mo, and Li
(2004) and documented in figure 1, a substantial fraction of
China's imports are used for producing goods for exports.9 Finally, as Lardy (2005), documents,
China has experienced rapid increases in FDI from firms that use
China as a platform for their exports.
The estimating equation that we postulate is
| (11) |
where ![]() is the world's
industrial production,
is the world's
industrial production,
![]() is the share
of imports of parts and assembly, and
is the share
of imports of parts and assembly, and ![]() is a random disturbance. The
equation also includes dummy variables to control for monthly
seasonality along with China's New Year and China's accession to
the WTO. The long-run coefficients are
is a random disturbance. The
equation also includes dummy variables to control for monthly
seasonality along with China's New Year and China's accession to
the WTO. The long-run coefficients are
![]() for industrial
production;
for industrial
production;
![]() for imports of
parts and assembly products;
for imports of
parts and assembly products;
![]() for foreign
direct investment; and
for foreign
direct investment; and
![]() for the real
exchange rate.
for the real
exchange rate.
We expect that
![]() meaning
that an increase in the world's industrial production will raise
the demand for Chinese exports
meaning
that an increase in the world's industrial production will raise
the demand for Chinese exports![]() We expect that
We expect that
![]() meaning
that an increased availability of imports of parts for assembly
facilitates exports. The inclusion of foreign direct investment in
the specification is controversial as it could be interpreted as
suggesting that supply creates its own demand. Nevertheless, we
expect that
meaning
that an increased availability of imports of parts for assembly
facilitates exports. The inclusion of foreign direct investment in
the specification is controversial as it could be interpreted as
suggesting that supply creates its own demand. Nevertheless, we
expect that
![]() to
reflect the increasing role of Asian firms using China as a
platform for their exports (Lardy, 2005).
to
reflect the increasing role of Asian firms using China as a
platform for their exports (Lardy, 2005).
The coefficient
![]() denotes the
response of the export share to changes in the real exchange rate.
The expectation is for a real appreciation to lower the volume of
China's exports and for such a decline to lower China's export
share-that is,
denotes the
response of the export share to changes in the real exchange rate.
The expectation is for a real appreciation to lower the volume of
China's exports and for such a decline to lower China's export
share-that is,
![]() As in
the case of imports, this response depends not just on the response
of the volume of exports but also on the response of prices and
thus, without information about these magnitudes, the effect of the
exchange-rate changes on the export share is not known in advance.
Specifically, appendix (9.2) shows that
As in
the case of imports, this response depends not just on the response
of the volume of exports but also on the response of prices and
thus, without information about these magnitudes, the effect of the
exchange-rate changes on the export share is not known in advance.
Specifically, appendix (9.2) shows that
![$\displaystyle \frac{\partial w_{x}}{\partial q_{\frac{f}{R}}}=\left[ \frac{(p_{... ...q_{\frac{f}{R}}}\cdot\left( 1+\varepsilon_{x}^{\ast}\right) \right] \gtrless0, $](img103.gif)
where
![]() is the
response of China's export prices to changes in the renminbi and
is the
response of China's export prices to changes in the renminbi and
![]() is the
price elasticity of the volume of China's exports.
is the
price elasticity of the volume of China's exports.
However, if one is willing to assume that
![]() , then
, then
![$\displaystyle \frac{\partial w_{x}}{\partial q_{\frac{f}{R}}}\vert _{\varepsilo... ...ac{\partial p_{x}}{\partial q_{\frac{f}{R}}}\cdot(1+\varepsilon _{x})\right] . $](img107.gif)
Further, if one is willing to assume that China's exports face
suitable substitutes abroad (
![]() )
and that an appreciation of the renminbi raises China's dollar
export prices (
)
and that an appreciation of the renminbi raises China's dollar
export prices (
![]() )
then
)
then
![]() : an appreciation of the renminbi lowers China's export
share of world trade. Confidence in the assumption that
: an appreciation of the renminbi lowers China's export
share of world trade. Confidence in the assumption that
![]() is not warranted, however. Specifically, an appreciation of the
renminbi lowers the cost of imports of raw materials and of
machinery and could lead to a decline in production costs. Such a
decline could then be followed by either an expansion in profit
margins with constant export prices or by an unchanged profit
margin with a decline in export prices. Which of these outcomes
will materialize is not known in advance but, importantly, one
cannot rule a-priori that
is not warranted, however. Specifically, an appreciation of the
renminbi lowers the cost of imports of raw materials and of
machinery and could lead to a decline in production costs. Such a
decline could then be followed by either an expansion in profit
margins with constant export prices or by an unchanged profit
margin with a decline in export prices. Which of these outcomes
will materialize is not known in advance but, importantly, one
cannot rule a-priori that
![]()
6 Data
6.1 International Trade
We disaggregate non-oil trade into finished products and components for assembly. By trade in finished products we refer to goods imported into or exported from China that are (1) not subject to further processing and (2), in the case of exports, not assembled from imported components. These flows are labeled by Chinese statistical agencies as `ordinary' and we follow their convention. By trade in components for assembly we refer to three types of flows: (1) exports of components for assembly outside of China; (2) imports of components for assembly into exportables; and (3) exports of goods assembled using imported components. These products are labeled by Chinese statistical agencies as `processing and assembly' and we follow that convention. Figures 2 and 3 show the decomposition of China's trade into these categories using monthly data since 1992; the observations are not seasonally adjusted and are scaled by the value of world merchandise trade excluding China's trade. Data for China's exports and imports come from CEIC; data for world trade come from the IMF.
For the share of aggregate exports, the data show an increase from four percent in 2000 to eight percent by 2004 (figure 2). In terms of the composition of exports, the share of products for processing and assembly has increased faster than the share of ordinary products. For imports, the data show an increase from three percent in 2000 to nearly seven percent by the end of 2004 (figure 3). In terms of the composition of imports, the share for ordinary products experience the largest increase. Imports of oil are a relatively small fraction of China's share of rest of the world imports.
Figure 2. Shares of China's Exports in Rest of World Exports-Selected Categories
Figure 3. Shares of China's Imports in Rest of World Imports-Selected Categories
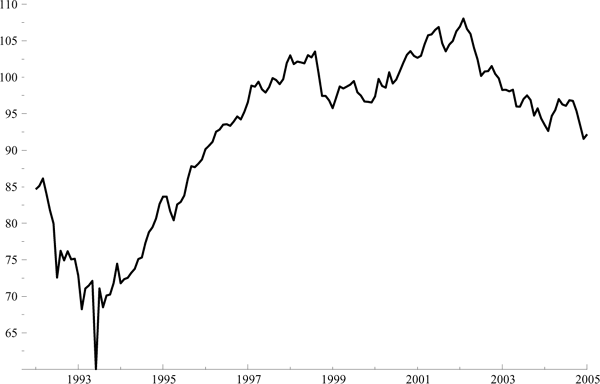
Real Effective Exchange Rates Our analysis uses the IMF's measure of the real effective exchange rate which is constructed as
where ![]() is the number
of currencies included in the index;
is the number
of currencies included in the index;
![]() is
the weight for the
is
the weight for the ![]() currency; and
currency; and
![]() is the bilateral, real
exchange rate used by the IMF; see Bayoumi et al. (2005) for the
choice of weights and list of countries. The data reveal that the
renminbi appreciated in real terms from 1993 to 2002 and that it
has depreciated since then (figure 4).
is the bilateral, real
exchange rate used by the IMF; see Bayoumi et al. (2005) for the
choice of weights and list of countries. The data reveal that the
renminbi appreciated in real terms from 1993 to 2002 and that it
has depreciated since then (figure 4).
Figure 4. IMF's Measure of China's Real Effective Exchange Rate
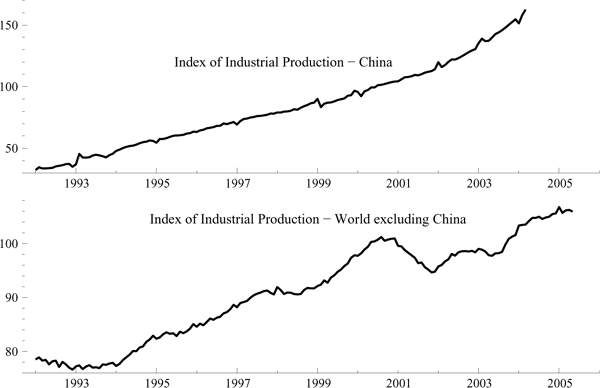
6.2 Economic Activity
To measure China's economic activity, we use the index of industrial production; the data are assembled from series available in CEIC. As figure 5 shows, China's expansion of industrial production has been steady during the sample period without experiencing a single cyclical contraction.
Data for world's economic activity, ![]() are constructed as a
weighted average of the IMF's industrial production series:
are constructed as a
weighted average of the IMF's industrial production series:
where
![]() and
and
![]() is the share
of China's exports to the
is the share
of China's exports to the ![]() country.10 In
contrast to the Chinese experience, industrial production in the
rest of the world experiences several business-cycle swings.
country.10 In
contrast to the Chinese experience, industrial production in the
rest of the world experiences several business-cycle swings.
Figure 5. Measures of Industrial Production
6.3 Foreign Direct Investment
China has experienced rapid increases in foreign direct investment and, as Lardy (2005) documents, such inflows come from firms interested in producing in China to take advantage of low unit labor costs. Based on CEIC data since 1997, the top panel of figure 6 shows that foreign direct investment averages about $4 billion per month though this average is accompanied by large fluctuations. Because of the lack of data for the associated initial value of foreign claims, we estimate the foreign direct-investment position by cumulating the associated flows; the resulting estimate understates the actual value of the stock of foreign investment in China. With this consideration in mind, the middle panel shows that our estimate of the stock of foreign investment in China has grown steadily since 1997, exceeding $400 billion by the middle of 2005. To get a sense of the relative importance of this stock, we scale it by world imports excluding Chinese imports. The resulting ratio is
where ![]() is the dollar
flow of foreign direct investment into China during the
is the dollar
flow of foreign direct investment into China during the
![]() month. The bottom
panel shows that after growing faster than world trade, the stock
of foreign-direct investment has stabilized around 4 percent of
world trade excluding China.
month. The bottom
panel shows that after growing faster than world trade, the stock
of foreign-direct investment has stabilized around 4 percent of
world trade excluding China.
Figure 6. Foreign Direct Investment into China
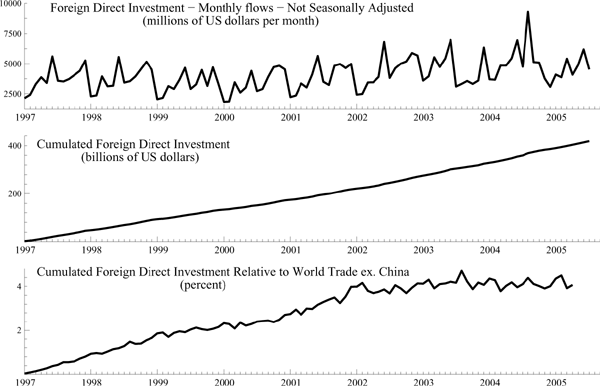
One limitation of our series is that it does not identify the source of the country undertaking the investment. Indeed, Lardy (2005) notes an interesting pattern in the destination of the production of foreign firms operating in China. Specifically, Asian firms use China as a platform for their exports whereas American firms orient their production towards the Chinese market. This feature is not captured by our data and this limitation should be kept in mind when evaluating the results.
7 Econometric Analysis
For parameter estimation, we use monthly data from January 1997 to February 2004. The reason for the brief sample period is the lack of monthly data on foreign direct investment in China prior to 1997. To avoid having the estimation rely solely on this consideration, we also report estimated income and exchange-rate effects based on monthly data from 1994 to 2004 with a specification that excludes foreign direct investment.
The estimation method is ordinary least squares and our focus is on the long-run coefficients. Reliance on OLS carries several limitations and one of them is that it does not recognize the truncation in the range of values of the dependent variable. Specifically, because the trade shares cannot take negative values, the residuals cannot take just any value. Indeed, the relevant disturbance needs to have a finite lower bound so as to avoid draws so large that the share would be negative. OLS ignores this consideration and addressing it involves using a different estimation method and we have delayed this consideration for further research.11
For the specification of dynamic adjustments, we include contemporaneous values and 13 lags for each predetermined variable, except foreign direct investment which has no contemporaneous value and just one lag. The relatively large number of parameters does not involve a sacrifice in degrees of freedom because data for income and the real effective exchange rate are available prior to 1997.
Given the relatively large number of parameters, we implement a General-to-Specific strategy. The general formulation corresponds to an equation with all the variables and their lags whereas the specific formulation is obtained by implementing the automated-specification algorithm developed by Hendry and Krolzig (2001); appendix (9.3) describes the algorithm.12 Greatly simplified, this algorithm combines least squares with a selection strategy that excludes insignificant variables. The differentiating feature of this algorithm is that the critical values used to exclude a variable are not fixed in advance but, rather, are calculated sequentially to recognize the joint nature of model specification and parameter estimation. Central to this strategy is for the estimating equation to have white-noise residuals and constant parameters. We assess the generality of the general specification by using several initial lags.
7.1 Parameter Estimates
7.1.1 Imports
For imports of ordinary products, the results indicate that a
real appreciation of the renminbi lowers, in the long-run, the
associated import share (top panel of table 1); this effect is
statistically different from zero and robust to lag length. Though
this result contradicts our expectations, two factors may account
for the gap between priors and evidence. First, state-owned
enterprises have played an active role in determining imports
during the sample period and these enterprises might have operated
in an environment where the allocative role of prices was not their
main concern. Thus, the type of substitution effect that an
exchange-rate change is expected to induce has been absent. Second,
a negative sign is not necessarily inconsistent with theory.
Specifically, equation (9) predicts a
negative exchange-rate on the import share under two conditions:
Chinese products are not good substitutes for imports (
![]() and an appreciation of the
renminbi lowers the dollar export price to China (
and an appreciation of the
renminbi lowers the dollar export price to China (
![]() .
Of course, we do not know whether these conditions hold in China
and thus one cannot rule out the case in which our results are
inconsistent with theory.
.
Of course, we do not know whether these conditions hold in China
and thus one cannot rule out the case in which our results are
inconsistent with theory.
The evidence also reveals that movements in Chinese industrial production are important in explaining movements in these imports: the income effect is positive, statistically significant, and robust to lag length. Finally, the results indicate that an increase in foreign direct investment raises China's imports of ordinary products suggesting that foreign direct investment (FDI) has complementarity effects. In terms of the fit of the equation, the specification with 13 lags offers the best description of the data. Specifically, the residuals are white noise and one cannot reject the hypothesis of parameter stability.
Extending the sample period and excluding foreign direct investment (bottom panel of table 1) reveals a notable degradation of the statistical reliability of the equations: rejection of parameter constancy and residuals that are not white noise. Such a degradation reflects the use of observations during China's transition from centrally planned to market economy. With this consideration in mind, the results suggest that the income effects are comparable to those based on the 1997-2004 sample. For the price effects, we still find negative coefficients and the estimates are substantially greater than the estimates based on the 1997-2004 sample.
For imports of parts for assembly, the results indicate that the effect of a real appreciation of the renminbi depends on the specification of dynamics (table 2). For six or fewer lags, the effect is positive meaning that the real appreciation raises the share of imports; this result is consistent with our prior expectations. Movements in Chinese industrial production are quite important in explaining movements in imports of parts and assembly products. Specifically, the coefficient for income is positive, statistically significant, and quite robust to the number of lags. Finally, an increase in foreign-direct investment lowers the import share of parts and assembly and the effect is statistically strong for short lags. In other words, FDI is generating substitution effects in the sense that foreign firms in China produce the parts that would otherwise be imported. In terms of the fit of the equation, the test results indicate that the residuals are white noise and that one cannot reject the hypothesis of parameter stability.
Extending the sample period and excluding foreign direct investment (bottom panel of table 2) reveals a degradation of the statistical reliability of the equations. With this consideration in mind, the estimated income effects are comparable to those based on the 1997-2004 sample but the price effects are quite different. Specifically, in every case, an appreciation of the yen lowers the share of China in world trade. Further, the estimates are substantially greater than the estimates based on the 1997-2004 sample.
Table 1. Import Share of Ordinary Products - Long-Run Coefficients Sensitivity to Synamic Specification and Sample Periods
| Lags | Real Income | Real Exch. Rate | FDI | Lagged Dep. Var. | SER | Parameter Stability (a): CHW1 | Parameter Stability (a): CHW2 | Properties of Residuals (b): Normality | Properties of Residuals (b): Independ. | Properties of Residuals (b): Homosked. | |
|---|---|---|---|---|---|---|---|---|---|---|---|
1997-2004 | 13 |
0.028 |
-0.014 |
0.456 |
0.669 |
0.135 |
na |
0.361 |
0.694 |
0.846 |
0.964 |
1997-2004: Standard Error | 13 |
(0.0092) |
(0.0055) |
(0.1448) |
(0.0741) |
-- |
-- |
-- |
-- |
-- |
-- |
1997-2004 | 6 |
0.035 |
-0.014 |
0e |
0.163 |
0.185 |
0.055 |
0.084 |
0.167 |
0.710 |
0.830 |
1997-2004: Standard Error | 6 |
(0.0019) |
(0.0013) |
-- |
(0.13) |
-- |
-- |
-- |
-- |
-- |
-- |
1997-2004 | 3 |
0.024 |
-0.008 |
0.164 |
0.183 |
0.160 |
0.119 |
0.065 |
0.104 |
0.529 |
0.064 |
1997-2004: Standard Error | 3 |
(0.0024) |
(0.0016) |
(0.0435) |
(0.0688) |
-- |
-- |
-- |
-- |
-- |
-- |
1997-2004 | 1 |
0.023 |
-0.007 |
0.172 |
0.193 |
0.164 |
0.041 |
0.062 |
0.386 |
0.637 |
0.134 |
1997-2004: Standard Error | 1 |
(0.0025) |
(0.0016) |
(0.0452) |
(0.0705) |
-- |
-- |
-- |
-- |
-- |
-- |
1997-2004 | 0 |
0.024 |
0e |
0.138 |
-- |
0.172 |
0.033 |
0.014 |
0.544 |
0.394 |
0.433 |
1997-2004: Standard Error | 0 |
(0.0024) |
-- |
(0.04349) |
-- |
-- |
-- |
-- |
-- |
-- |
-- |
1994-2004 | 13 |
0.085 |
-0.040 |
-- |
0.870 |
0.165 |
0.695 |
0.790 |
r |
0.290 |
0.450 |
1994-2004: Standard Error | 13 |
(0.02) |
(0.01) |
-- |
(0.04) |
-- |
-- |
-- |
-- |
-- |
-- |
1994-2004 | 6 |
0.036 |
-0.050 |
-- |
0.370 |
0.230 |
r |
0.030 |
r |
0.220 |
0.180 |
1994-2004: Standard Error | 6 |
(0.002) |
(0.005) |
-- |
(0.09) |
-- |
-- |
-- |
-- |
-- |
-- |
1994-2004 | 3 |
0.032 |
-0.004 |
-- |
0.360 |
0.210 |
r |
0.040 |
r |
0.190 |
0.500 |
1994-2004: Standard Error | 3 |
(0.0016) |
(0.004) |
-- |
(0.08) |
-- |
-- |
-- |
-- |
-- |
-- |
1994-2004 | 1 |
0.030 |
-0.040 |
-- |
0.240 |
0.210 |
r |
0.020 |
0.030 |
r |
0.150 |
1994-2004: Standard Error | 1 |
(0.0012) |
(0.003) |
-- |
(0.06) |
-- |
-- |
-- |
-- |
-- |
-- |
1994-2004 | 0 |
0.027 |
-0.036 |
-- |
-- |
0.250 |
r |
0.210 |
0.270 |
r |
0.680 |
1994-2004: Standard Error | 0 |
(0.001) |
(0.003) |
-- |
-- |
-- |
-- |
-- |
-- |
-- |
-- |
standard errors in parentheses; r means rejects null hypothesis; na means that sample is not long enough for test
0e: Selection algorithm excludes this variable for lack of statistical significance
(a): CHW1: Chow test with 0.5 sample split. CHW2: Chow test with a 0.9 sample split.
(b): significance level needed to reject the associated null hypothesis. Entries in bold denote rejection at the 5% significance level.
Normality: Jarque-Bera test; Serial independence: Autoregressive test; Homoskedasticity: ARCH
Table 2. Import Share for Parts and Components - Long-Run Coefficients Sensitivity to Dynamic Specification to Dynamic Specification and Sample Dates
| Lags | Real Income | Real Exch. Rate | FDI | Lagged Dep. Var. | SER | Parameter Stability (a): CHW1 | Parameter Stability (a): CHW2 | Properties of Residuals (b): Normality | Properties of Residuals (b): Independ. | Properties of Residuals (b): Homosked. | |
|---|---|---|---|---|---|---|---|---|---|---|---|
1997-2004 | 13 |
0.015 |
-0.030 |
0e |
0.622 |
0.079 |
na |
0.532 |
0.351 |
0.527 |
0.704 |
1997-2004: Standard Error | 13 |
(0.0021) |
(0.0098) |
-- |
(0.07) |
-- |
-- |
-- |
-- |
-- |
-- |
1997-2004 | 6 |
0.015 |
0.003 |
0e |
0.600 |
0.080 |
0.420 |
0.016 |
0.920 |
0.160 |
0.406 |
1997-2004: Standard Error | 6 |
(0.001) |
(0.0016) |
-- |
(0.071) |
-- |
-- |
-- |
-- |
-- |
-- |
1997-2004 | 3 |
0.013 |
0.004 |
0e |
0.465 |
0.078 |
0.180 |
0.059 |
0.960 |
0.050 |
0.782 |
1997-2004: Standard Error | 3 |
(0.0013) |
(0.0012) |
-- |
(0.0659) |
-- |
-- |
-- |
-- |
-- |
-- |
1997-2004 | 1 |
0.016 |
0.002 |
-0.093 |
0e |
0.078 |
0.143 |
0.858 |
0.180 |
0.954 |
0.433 |
1997-2004: Standard Error | 1 |
(0.001) |
(0.0008) |
(0.0174) |
-- |
-- |
-- |
-- |
-- |
-- |
-- |
1997-2004 | 0 |
0.016 |
0.002 |
-0.090 |
-- |
0.081 |
0.534 |
0.154 |
0.393 |
0.264 |
0.955 |
1997-2004: Standard Error | 0 |
(0.00109) |
(0.00078) |
(0.0182) |
-- |
-- |
-- |
-- |
-- |
-- |
-- |
1994-2004 | 13 |
0.013 |
-0.006 |
-- |
0.380 |
0.070 |
0.110 |
0.120 |
0.920 |
0.280 |
0.590 |
1994-2004: Standard Error | 13 |
(0.001) |
(0.002) |
-- |
(0.07) |
-- |
-- |
-- |
-- |
-- |
-- |
1994-2004 | 6 |
0.012 |
-0.005 |
-- |
0.077 |
0.085 |
0.070 |
0.030 |
0.550 |
0.750 |
0.650 |
1994-2004: Standard Error | 6 |
(0.0008) |
(0.0014) |
-- |
(0.05) |
-- |
-- |
-- |
-- |
-- |
-- |
1994-2004 | 3 |
0.012 |
-0.004 |
-- |
0.210 |
0.080 |
r |
0.020 |
0.420 |
0.250 |
0.420 |
1994-2004: Standard Error | 3 |
(0.0008) |
(0.0014) |
-- |
(0.07) |
-- |
-- |
-- |
-- |
-- |
-- |
1994-2004 | 1 |
0.011 |
-0.003 |
-- |
0.290 |
0.076 |
r |
0.080 |
0.320 |
0.280 |
0.780 |
1994-2004: Standard Error | 1 |
(0.0008) |
(0.0015) |
-- |
(0.06) |
-- |
-- |
-- |
-- |
-- |
-- |
1994-2004 | 0 |
0.011 |
-0.002 |
-- |
-- |
0.0845 |
r |
r |
0.570 |
r |
0.700 |
1994-2004: Standard Error | 0 |
(0.001) |
(0.0011) |
-- |
-- |
-- |
-- |
-- |
-- |
-- |
-- |
standard errors in parentheses; r means rejects null hypothesis; na means that sample is not long enough for test
0e: Selection algorithm excludes this variable for lack of statistical significance
(a): CHW1: Chow test with 0.5 sample split. CHW2: Chow test with a 0.9 sample split.
(b): significance level needed to reject the associated null hypothesis. Entries in bold denote rejection at the 5% significance level.
Normality: Jarque-Bera test; Serial independence: Autoregressive test; Homoskedasticity: ARCH
7.1.2 Exports
For exports of ordinary products, a real appreciation of the renminbi lowers the share of China's exports in world trade, a result consistent with our expectations (table 3, top panel).13 This inverse association is statistically significant for specifications with three or more lags. In addition, the results reveal that the share of China's exports is quite responsive to movements in world industrial production though the magnitude of this effect is not robust to the number of lags. Finally, the evidence suggests that movements in foreign-direct investment do not matter for this export share, except in the case where no lags are included in the specification. In terms of the fit of the equation, the tests support the hypothesis of white noise and parameter constancy for all specifications except the one with no lags. As in the case for imports, we find that extending the sample period and excluding foreign direct investment (bottom panel of table 3) yields a deterioration of the statistical reliability of the equations.
For exports of parts and assembly products, the results reveal that the number of lags matters greatly for characterizing the data (table 4, top panel). With this consideration in mind, the estimates reveal several properties of interest. First, a real appreciation of the renminbi lowers the share of China's exports in world trade for specifications with six or more lags. For three or fewer lags, however, the evidence suggests that an appreciation of the real exchange rate raises the share of China's exports though these specifications are not suitable characterizations of the data because of their parameter instability. Second, income effects are positive and significant for specifications with six or more lags. Otherwise, income effects are not statistically relevant. Third, imports of parts to produce these exports play an important role and the coefficient is always nearly one, a result robust to the number of lags. Notice that the coefficient for these imports exceeds one for equations with six or fewer lags. In effect, imports of parts become a proxy for world industrial production. Finally, foreign-direct investment matters only for equations with six or fewer lags.
Extending the sample period and excluding foreign direct investment (bottom panel of table 4) reveals an instability of income and price effects in response to changes in the dynamic specification. Such changes also affect greatly the coefficient for imports of parts and assembly products. This instability can be traced to the finding of a unit root in these equations.
Table 3. Export Share of Ordinary Products - Long-Run Coefficients Sensitivity to Dynamic Specification and Sample Period
| Lags | Foreign Income | Real Exch. Rate | FDI | Lagged Dep. Variable | SER | Parameter Stability (a): CHW1 | Parameter Stability (a): CHW2 | Properties of Residuals (b): Normality | Properties of Residuals (b): Independ. | Properties of Residuals (b): Homosked. | |
|---|---|---|---|---|---|---|---|---|---|---|---|
1997-2004 | 13 |
0.055 |
-0.033 |
0e |
0.659 |
0.133 |
na |
0.020 |
0.390 |
0.560 |
0.060 |
1997-2004: Standard Error | 13 |
(0.009) |
(0.009) |
-- |
(0.1) |
-- |
-- |
-- |
-- |
-- |
-- |
1997-2004 | 6 |
0.049 |
-0.027 |
0e |
0.550 |
0.128 |
0.132 |
0.020 |
0.480 |
0.550 |
0.390 |
1997-2004: Standard Error | 6 |
(0.0075) |
(0.007) |
-- |
(0.09) |
-- |
-- |
-- |
-- |
-- |
-- |
1997-2004 | 3 |
0.096 |
-0.056 |
0e |
0.875 |
0.115 |
0.216 |
0.849 |
0.480 |
0.633 |
0.398 |
1997-2004: Standard Error | 3 |
(0.042) |
(0.0312) |
-- |
(0.0728) |
-- |
-- |
-- |
-- |
-- |
-- |
1997-2004 | 1 |
0.028 |
0e |
0e |
0.864 |
0.131 |
0.025 |
0.239 |
0.192 |
0.029 |
0.496 |
1997-2004: Standard Error | 1 |
(0.0053) |
-- |
-- |
(0.596) |
-- |
-- |
-- |
-- |
-- |
-- |
1997-2004 | 0 |
0.017 |
0e |
0.125 |
-- |
0.205 |
r |
r |
0.898 |
r |
0.247 |
1997-2004: Standard Error | 0 |
(0.00069) |
-- |
(0.03201) |
-- |
-- |
-- |
-- |
-- |
-- |
-- |
1994-2004 | 13 |
0.020 |
0e |
-- |
0.840 |
0.153 |
0.100 |
0.290 |
0.730 |
0.170 |
0.240 |
1994-2004: Standard Error | 13 |
(0.002) |
-- |
-- |
(0.065) |
-- |
-- |
-- |
-- |
-- |
-- |
1994-2004 | 6 |
0.063 |
-0.024 |
-- |
0.620 |
0.156 |
r |
0.088 |
0.120 |
0.680 |
0.860 |
1994-2004: Standard Error | 6 |
(0.011) |
(0.007) |
-- |
(0.086) |
-- |
-- |
-- |
-- |
-- |
-- |
1994-2004 | 3 |
0.070 |
-0.024 |
-- |
0.658 |
0.149 |
0.025 |
0.336 |
0.680 |
0.210 |
0.370 |
1994-2004: Standard Error | 3 |
(0.013) |
(0.0075) |
-- |
(0.069) |
-- |
-- |
-- |
-- |
-- |
-- |
1994-2004 | 1 |
0.058 |
-0.0185 |
-- |
0.594 |
0.166 |
r |
0.300 |
0.120 |
r |
0.110 |
1994-2004: Standard Error | 1 |
(0.011) |
(0.0067) |
-- |
(0.06) |
-- |
-- |
-- |
-- |
-- |
-- |
1994-2004 | 0 |
0.040 |
-0.011 |
-- |
-- |
0.217 |
r |
0.030 |
0.210 |
r |
0.020 |
1994-2004: Standard Error | 0 |
(0.0055) |
(0.0034) |
-- |
-- |
-- |
-- |
-- |
-- |
-- |
-- |
standard errors in parentheses; r means rejects null hypothesis; na means that sample is not long enough for test
0e: Selection algorithm excludes this variable for lack of statistical significance
(a): CHW1: Chow test with 0.5 sample split. CHW2: Chow test with a 0.9 sample split.
(b): significance level needed to reject the associated null hypothesis. Entries in bold denote rejection at the 5% significance level.
Normality: Jarque-Bera test; Serial independence: Autoregressive test; Homoskedasticity: ARCH
Table 4. Export Share for Parts - Long-Run Coefficients Sensitivity to Dynamic Specification and Sample Periods
| Lags | Foreign Income | Real Exch. Rate | Imports of Parts & Assmbly | FDI | Lagged Dep. Variable | SER | Parameter Stability (a): CHW1 | Parameter Stability (a): CHW2 | Properties of Residuals (b): Normality | Properties of Residuals (b): Independ. | Properties of Residuals (b): Homosked. | |
|---|---|---|---|---|---|---|---|---|---|---|---|---|
1997-2004 | 13 |
0.050 |
-0.031 |
0.975 |
0e |
0.400 |
0.080 |
na |
0.360 |
0.350 |
0.950 |
0.840 |
1997-2004: Standard Error | 13 |
(0.008) |
(0.006) |
(0.17) |
-- |
(0.11) |
-- |
-- |
-- |
-- |
-- |
-- |
1997-2004 | 6 |
0.011 |
-0.006 |
1.269 |
0.083 |
0.222 |
0.083 |
0.015 |
0.070 |
0.309 |
0.110 |
0.580 |
1997-2004: Standard Error | 6 |
(0.0046) |
(0.0039) |
(0.072) |
(0.0213) |
(0.0499) |
-- |
-- |
-- |
-- |
-- |
-- |
1997-2004 | 3 |
0e |
0.010 |
1.165 |
0.228 |
0.658 |
0.091 |
r |
r |
0.404 |
0.293 |
0.481 |
1997-2004: Standard Error | 3 |
-- |
(0.0018) |
(0.1406) |
(0.0418) |
(0.0701) |
-- |
-- |
-- |
-- |
-- |
-- |
1997-2004 | 1 |
0e |
0.009 |
1.099 |
0.186 |
0.504 |
0.098 |
r |
r |
0.451 |
0.823 |
0.864 |
1997-2004: Standard Error | 1 |
-- |
(0.0011) |
(0.0992) |
(0.0292) |
(0.0684) |
-- |
-- |
-- |
-- |
-- |
-- |
1997-2004 | 0 |
0e |
0e |
1.058 |
0.157 |
-- |
0.131 |
r |
r |
0.520 |
0.404 |
0.471 |
1997-2004: Standard Error | 0 |
-- |
-- |
(0.0667) |
(0.0193) |
-- |
-- |
-- |
-- |
-- |
-- |
-- |
1994-2004 | 13 |
-0.060 |
0.052 |
-4.235 |
-- |
1.030 |
0.109 |
r |
0.570 |
0.650 |
0.060 |
0.220 |
1994-2004: Standard Error | 13 |
(0.16) |
(0.144) |
(13.31) |
-- |
(0.057) |
-- |
-- |
-- |
-- |
-- |
-- |
1994-2004 | 6 |
0.047 |
-0.002 |
0.880 |
-- |
0.604 |
0.109 |
0.123 |
0.098 |
0.570 |
0.100 |
0.030 |
1994-2004: Standard Error | 6 |
(0.0097) |
(0.0054) |
(0.2) |
-- |
(0.077) |
-- |
-- |
-- |
-- |
-- |
-- |
1994-2004 | 3 |
-0.087 |
0.002 |
3.990 |
-- |
1.060 |
0.117 |
0.360 |
0.240 |
0.410 |
0.090 |
0.050 |
1994-2004: Standard Error | 3 |
(0.083) |
(0.053) |
(2.8) |
-- |
(0.06) |
-- |
-- |
-- |
-- |
-- |
-- |
1994-2004 | 1 |
0.058 |
0.001 |
0.230 |
-- |
0.760 |
0.127 |
r |
0.230 |
0.460 |
0.130 |
0.090 |
1994-2004: Standard Error | 1 |
(0.025) |
(0.009) |
(0.63) |
-- |
(0.11) |
-- |
-- |
-- |
-- |
-- |
-- |
1994-2004 | 0 |
0.040 |
0e |
0.790 |
-- |
-- |
0.155 |
r |
r |
0.170 |
r |
0.040 |
1994-2004: Standard Error | 0 |
(0.003) |
-- |
(0.11) |
-- |
-- |
-- |
-- |
-- |
-- |
-- |
-- |
standard errors in parentheses; r means rejects null hypothesis; na means that sample is not long enough for test
0e: Selection algorithm excludes this variable for lack of statistical significance
(a): CHW1: Chow test with 0.5 sample split. CHW2: Chow test with a 0.9 sample split.
(b): significance level needed to reject the associated null hypothesis. Entries in bold denote rejection at the 5% significance level.
Normality: Jarque-Bera test; Serial independence: Autoregressive test; Homoskedasticity: ARCH
7.1.3 Dynamic Responses
Comparing the estimation results for exports with those for imports one cannot fail to notice that lagged responses may matter more for exports than for imports. There are several reasons for this asymmetry. First, Chinese exporters do not have a captive market, as is the case for China's importers. Indeed, China's exports face substitutes in their destination markets and, thus changes in exchange rates are not likely to translate into immediate responses in China's exports as exporters try to gauge the response of their competition. Second, China has not experienced, in our sample, the type of business-cycle developments that can be captured with lagged terms. For example, economic activity has not experienced the contractionary phase of a business cycle and the real value of the renminbi has not experienced the large swings that major currencies have experienced. Unlike the experience of China, world industrial production shows several business cycles (figure 5 above). Thus identifying dynamic responses for imports is more difficult than for exports.
7.2 Elasticity Estimates
One drawback of estimating parameters of an equation linear in the variables is that the magnitude of the coefficient estimates depends on the units of the regressors. To avoid this limitation, we re-express the point estimates in terms of elasticities; this transformation also helps to compare the estimation results to those generated using alternative formulations. Note that the elasticities of our linear formulations give the percent change of the trade share in response to a one percent change in the explanatory variables. For example, the elasticity of the import share with respect to income is
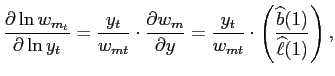
and it varies in response to changes in import shares and income. We remove the seasonal effects of these variables by using their moving averages. Thus, the income elasticity is computed as
 |
(12) |
where ![]() is the 12-month
moving average of
is the 12-month
moving average of ![]() We
apply this method for each of the elasticities.
We
apply this method for each of the elasticities.
7.2.1 Imports
Figure 7 shows the evolution of the 95% confidence band for the import shares. To provide perspective on the evolution of these elasticities, the figure includes estimates prior to 1997. The evidence shows that the income elasticity for ordinary imports grows from slightly below one to a peak of 2.5 in 1999, right before China's accession to the WTO, with a subsequent decline to 1.5 by 2004. This pattern reflects that the share of China's imports in world trade has grown faster than China's industrial production since joining the WTO. For imports of parts, the income elasticity rises from 0.7 to slightly above one by 2002 and stabilizes at that level.
Figure 7. 95% Confidence Intervals for Elasticities of Import Shares
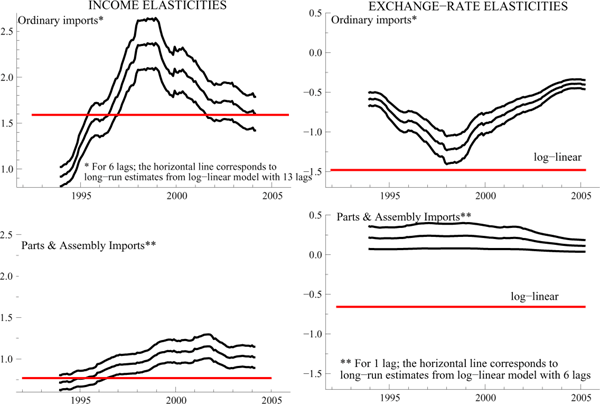
The exchange-rate elasticity for imports of ordinary products is negative meaning that an appreciation of the renminbi lowers China's share in world trade. This elasticity grows (in absolute value) until 1999, prior to China's accession to the WTO. This rise is due to the sharp appreciation of the renminbi over this period (figure 4 above). After China's accession to the WTO, the expansion in the import share lowers the elasticity (in absolute value) through 2004. For imports of parts, the exchange-rate elasticity is positive and significant but the point estimate shows a slight downward trend.
To assess the sensitivity of these estimates to the choice of formulation, the figure includes the long-run elasticity estimates from a log-linear formulation:
| (13) |
The chief feature of equation (13) is that the elasticities are constant. For example, the elasticity of the import share with respect to the real exchange rate is
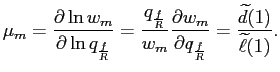
From a theoretical standpoint, treating ![]() as a constant implies that
the recorded changes
as a constant implies that
the recorded changes
![]() are being fully offset
by changes in
are being fully offset
by changes in
![]() a
pattern that lacks theoretical justification. From a practical
standpoint, however, the relevant question is whether the implied
elasticities are all that different from the ones that are allowed
to change.
a
pattern that lacks theoretical justification. From a practical
standpoint, however, the relevant question is whether the implied
elasticities are all that different from the ones that are allowed
to change.
For parameter estimation we apply the same specification strategy that is applied to equation (8). What the results suggest is that reliance on the conventional log-linear formulation yields a rather different characterization of trade than the one based on the linear model. First, the constant-elasticity formulation understates the response of China's import shares to changes in income. Second, the log-linear model overstates the responsiveness of the real exchange rate, and both elasticities are negative.
Settling which of these two formulations, equation (8) or equation
(13), offers the
best characterization of China's import share is beyond the scope
of this paper. However, the estimation results for equation
(8) cannot reject
the hypothesis that
![]() is
constant and such a finding constitutes evidence against the
instability of
is
constant and such a finding constitutes evidence against the
instability of
![]() that
is required by the log-linear model. Overall, then, there is
tentative support for preferring the estimates from equation
(8).
that
is required by the log-linear model. Overall, then, there is
tentative support for preferring the estimates from equation
(8).
To assess the sensitivity of the estimates to the level of aggregation, we estimate the parameters of
| (14) |
where
![]() is
the share of China's non-oil imports in rest-of-the-world imports.
For parameter estimation we apply the same specification strategy
that is applied to equation (8). Table 5 shows
the estimation results and figure 8 compares the elasticities for
components of the aggregate against the elasticity of the
aggregate.
is
the share of China's non-oil imports in rest-of-the-world imports.
For parameter estimation we apply the same specification strategy
that is applied to equation (8). Table 5 shows
the estimation results and figure 8 compares the elasticities for
components of the aggregate against the elasticity of the
aggregate.
Figure 8. 95% Confidence Intervals for Elasticities of Import Shares -- Sensitivity to Level of Aggregation
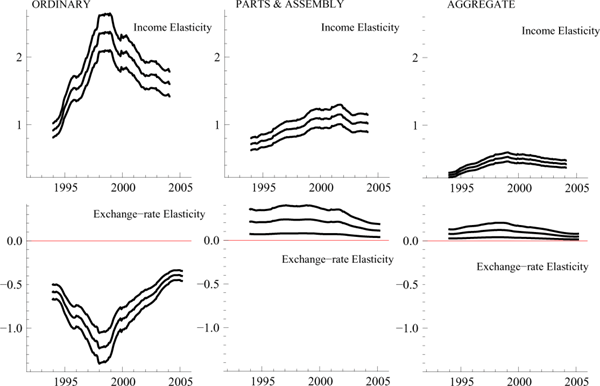
Inspection of the evidence suggests two important results. First, the elasticities for the share of aggregate imports are consistent with prior expectations about the response of trade: an increase in income or a real appreciation of the renminbi raises China's share of imports in world trade. Second, one cannot infer the response of the components based on the response of the aggregate: reliance on an aggregate formulation carries a loss of information. For example, the income elasticity for the aggregate share is below one whereas the income elasticity for the disaggregate shares are above one. Similarly, the exchange-rate elasticity for the aggregate share suggests that an appreciation of the renminbi raises the share of aggregate imports whereas the corresponding elasticity for ordinary products points to a reduction of that import share. Viewed as a whole, the evolution of the estimated elasticities is sufficiently different across the two types of products to suggest that reliance on a model for aggregate imports, even if consistent with our prior expectations, would suffer from an aggregation bias.
Table 5. Aggregate Import Share - Long-Run Coefficients Sensitivity to Dynamic Specificaton and Sample Period
| Lags | Domestic Income | Real Exch. Rate | FDI | Lagged Dep. Variable | SER | Parameter Stability (a): CHW1 | Parameter Stability (a): CHW2 | Properties of Residuals (b): Normality | Properties of Residuals (b): Independ. | Properties of Residuals (b): Homosked. | |
|---|---|---|---|---|---|---|---|---|---|---|---|
1997-2004 | 13 |
0.105 |
-0.051 |
1.170 |
0.870 |
0.160 |
r |
0.670 |
0.750 |
0.020 |
0.160 |
1997-2004: Standard Error | 13 |
(0.04) |
(0.026) |
(0.89) |
(0.08) |
-- |
-- |
-- |
-- |
-- |
-- |
1997-2004 | 6 |
0.046 |
-0.010 |
0e |
-0.170 |
0.210 |
0.020 |
0.095 |
0.010 |
0.680 |
0.850 |
1997-2004: Standard Error | 6 |
(0.0016) |
(0.001) |
-- |
(0.05) |
-- |
-- |
-- |
-- |
-- |
-- |
1997-2004 | 3 |
0.045 |
-0.009 |
0e |
0e |
0.200 |
0.026 |
0.020 |
0.250 |
0.490 |
0.110 |
1997-2004: Standard Error | 3 |
(0.0018) |
(0.0016) |
-- |
-- |
-- |
-- |
-- |
-- |
-- |
-- |
1997-2004 | 1 |
0.047 |
-0.011 |
0e |
0e |
0.220 |
0.220 |
0.080 |
0.060 |
0.210 |
0.140 |
1997-2004: Standard Error | 1 |
(0.001) |
(0.0011) |
-- |
-- |
-- |
-- |
-- |
-- |
-- |
-- |
1997-2004 | 0 |
0.047 |
-0.129 |
0e |
-- |
0.214 |
0.030 |
0.020 |
0.450 |
0.270 |
0.020 |
1997-2004: Standard Error | 0 |
(0.001) |
(0.014) |
-- |
-- |
-- |
-- |
-- |
-- |
-- |
-- |
1994-2004 | 13 |
0.146 |
-0.144 |
-- |
0.820 |
0.19 |
0.130 |
0.100 |
0.730 |
0.320 |
0.800 |
1994-2004: Standard Error | 13 |
(0.037) |
(0.042) |
-- |
(0.05) |
-- |
-- |
-- |
-- |
-- |
-- |
1994-2004 | 6 |
0.040 |
-0.043 |
-- |
0.020 |
0.295 |
r |
0.040 |
r |
0.250 |
0.950 |
1994-2004 | 6 |
(0.002) |
(0.004) |
-- |
(0.08) |
-- |
-- |
-- |
-- |
-- |
-- |
1994-2004 | 3 |
0.040 |
-0.041 |
-- |
0.140 |
0.29 |
r |
0.020 |
r |
0.350 |
0.940 |
1994-2004 | 3 |
(0.002) |
(0.0047) |
-- |
(0.06) |
-- |
-- |
-- |
-- |
-- |
-- |
1994-2004 | 1 |
0.039 |
-0.041 |
-- |
0.180 |
0.284 |
r |
0.080 |
r |
0.650 |
0.790 |
1994-2004 | 1 |
(0.003) |
(0.0048) |
-- |
(0.06) |
-- |
-- |
-- |
-- |
-- |
-- |
1994-2004 | 0 |
0.038 |
-0.038 |
-- |
-- |
0.298 |
r |
0.310 |
r |
0.060 |
0.990 |
1994-2004 | 0 |
(0.0023) |
(0.004) |
-- |
-- |
-- |
-- |
-- |
-- |
-- |
-- |
standard errors in parentheses; r means rejects null hypothesis; na means that sample is not long enough for test
0e: Selection algorithm excludes this variable for lack of statistical significance
(a): CHW1: Chow test with 0.5 sample split. CHW2: Chow test with a 0.9 sample split.
(b): significance level needed to reject the associated null hypothesis. Entries in bold denote rejection at the 5% significance level.
Normality: Jarque-Bera test; Serial independence: Autoregressive test; Homoskedasticity: ARCH
7.2.2 Exports
Figure 9 shows the evolution of the 95% confidence band for the elasticities of the export shares; to assess the sensitivity to the choice of formulation, the figure includes the long-run elasticity estimates from a log-linear formulation. Inspection of the results suggest that the income elasticities exceed one by a significant margin but the gap has narrowed significantly since China's accession to the WTO. The evidence also reveals that the exchange-rate elasticity is negative and statistically significant. This finding suggests that China's exports face good substitutes in their destination markets. Note that the results suggest that using log-linear formulations tends to over state the exchange-rate elasticity for China's exports for the most recent period.
Figure 9. 95% Confidence Intervals for Elasticities of Export Shares
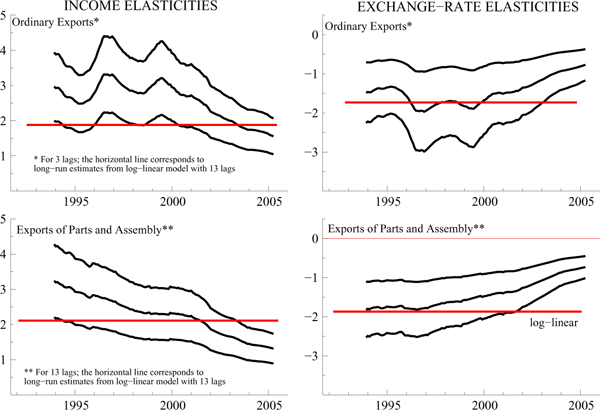
To assess the sensitivity of the estimates to the level of aggregation, we estimate the parameters of
| (15) |
where
![]() is
the share of China's exports in rest-of-the-world imports. For
parameter estimation we apply the same specification strategy that
is applied to equation (11) and the
estimation results are shown in table 6. Figure 10 compares the
elasticities for components of the aggregate against the elasticity
of the aggregate.
is
the share of China's exports in rest-of-the-world imports. For
parameter estimation we apply the same specification strategy that
is applied to equation (11) and the
estimation results are shown in table 6. Figure 10 compares the
elasticities for components of the aggregate against the elasticity
of the aggregate.
Figure 10. 95% Confidence Intervals for Elasticities of Export Shares -- Sensitivity to Level of Aggregation
Inspection of the evidence suggests that reliance on the elasticity of the aggregate export shares does not involve a loss of information. Specifically, the gap between the aggregate of the elasticities and the elasticity of the aggregate is numerically small and statistically insignificant. Notice, however, that the two categories of exports have quite different lag structures and thus exclusive reliance on an equation for the aggregate export share will not offer a reliable portrayal of the adjustment pattern of the components of exports.
Table 6. Aggregate Export Share - Long-Run Coefficients Sensitivity to Dynamic Specification and Sample Period
| Lags | Foreign Income | Real Exch. Rate | FDI | Lagged Dep. Variable | SER | Parameter Stability (a): CHW1 | Parameter Stability (a): CHW2 | Properties of Residuals (b): Normality | Properties of Residuals (b): Independ. | Properties of Residuals (b): Homosked. | |
|---|---|---|---|---|---|---|---|---|---|---|---|
1997-2004 | 13 |
0.130 |
-0.078 |
0e |
0.570 |
0.210 |
r |
0.260 |
0.540 |
0.760 |
0.300 |
1997-2004: Standard Error | 13 |
(0.02) |
(0.01) |
-- |
(0.08) |
-- |
-- |
-- |
-- |
-- |
-- |
1997-2004 | 6 |
0.120 |
-0.068 |
0e |
0.627 |
0.230 |
0.610 |
0.160 |
0.420 |
0.700 |
0.030 |
1997-2004: Standard Error | 6 |
(0.02) |
(0.016) |
-- |
(0.086) |
-- |
-- |
-- |
-- |
-- |
-- |
1997-2004 | 3 |
0e |
0.410 |
6.100 |
0.988 |
0.190 |
0.370 |
0.750 |
0.140 |
0.780 |
0.400 |
1997-2004: Standard Error | 3 |
-- |
(1.47) |
(20.5) |
(0.04) |
-- |
-- |
-- |
-- |
-- |
-- |
1997-2004 | 1 |
0e |
0e |
0.840 |
0.850 |
0.228 |
0.300 |
0.020 |
0.520 |
0.390 |
0.240 |
1997-2004: Standard Error | 1 |
-- |
-- |
(0.14) |
(0.05) |
-- |
-- |
-- |
-- |
-- |
-- |
1997-2004 | 0 |
0.050 |
-0.010 |
0.290 |
-- |
0.370 |
r |
r |
0.190 |
r |
r |
1997-2004: Standard Error | 0 |
(0.009) |
(0.0086) |
(0.058) |
-- |
-- |
-- |
-- |
-- |
-- |
-- |
1994-2004 | 13 |
0.149 |
-0.038 |
-- |
0.744 |
0.230 |
0.050 |
0.190 |
0.760 |
0.350 |
0.770 |
1994-2004: Standard Error | 13 |
(0.03) |
(0.0177) |
-- |
(0.077) |
-- |
-- |
-- |
-- |
-- |
-- |
1994-2004 | 6 |
0.157 |
-0.036 |
-- |
0.689 |
0.247 |
0.070 |
0.200 |
0.100 |
0.340 |
0.190 |
1994-2004: Standard Error | 6 |
(0.024) |
(0.014) |
-- |
(0.073) |
-- |
-- |
-- |
-- |
-- |
-- |
1994-2004 | 3 |
0.120 |
0e |
-- |
0.780 |
0.260 |
0.040 |
0.030 |
0.030 |
0.850 |
0.020 |
1994-2004: Standard Error | 3 |
(0.02) |
-- |
-- |
(0.07) |
-- |
-- |
-- |
-- |
-- |
-- |
1994-2004 | 1 |
0.094 |
0e |
-- |
0.660 |
0.290 |
r |
0.020 |
0.950 |
r |
0.550 |
1994-2004: Standard Error | 1 |
(0.011) |
-- |
-- |
(0.06) |
-- |
-- |
-- |
-- |
-- |
-- |
1994-2004 | 0 |
0.098 |
-0.012 |
-- |
-- |
0.357 |
r |
r |
r |
r |
r |
1994-2004: Standard Error | 0 |
(0.009) |
(0.0057) |
-- |
-- |
-- |
-- |
-- |
-- |
-- |
-- |
standard errors in parentheses; r means rejects null hypothesis; na means that sample is not long enough for test
0e: Selection algorithm excludes this variable for lack of statistical significance
(a): CHW1: Chow test with 0.5 sample split. CHW2: Chow test with a 0.9 sample split.
(b): significance level needed to reject the associated null hypothesis. Entries in bold denote rejection at the 5% significance level.
Normality: Jarque-Bera test; Serial independence: Autoregressive test; Homoskedasticity: ARCH
7.3 Exchange-rate Effects
Though elasticity estimates facilitate comparing the results across rather different specifications, elasticities are not ideally suited for drawing rules of thumb about the exchange-rate effects on China's trade shares. Specifically, the response of the import share to a change in the level of the real exchange-rate index is
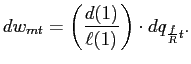
Thus, the effect on the import share of a hypothetical percent change in
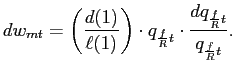
For a one-percent appreciation (
 ), the
estimated rule of thumb is
), the
estimated rule of thumb is
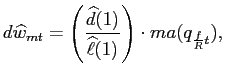
where we replace the unknown parameters with their estimates and use the moving average of the real exchange rate to smooth the estimate of the share effect.
Based on this derivation, figure 11 shows the 95 percent confidence intervals for the estimated long-run effects of a one-percent real appreciation of the renminbi on the China's trade shares. The results indicate that a one-percent real appreciation of the renminbi lowers the export share of ordinary products by 2.5 basis points (0.025); the decline in the export share for parts and assembly products is 3 basis points. For imports, the results reveal that a one-percent appreciation lowers the import share of ordinary products by a bit over one basis point; the corresponding effect on the import share of parts and assembly products is negligible. These results suggest that a ten percent real appreciation of the renminbi would lower the aggregate export share by about a half of a percentage point; the same appreciation would lower the aggregate import share by about a tenth of a percentage point.
Figure 11. 95% Confidence Intervals for Exchange-Rate Effects on Trade Shares
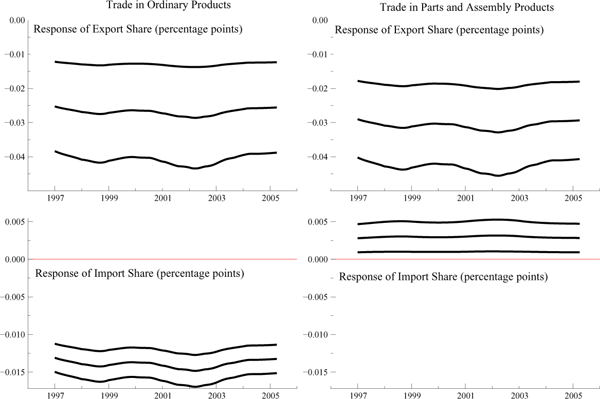
8 Conclusions
In relative terms, China's share of world trade is comparable to that of Japan and yet little is known about the response of China's trade to changes in exchange rates. And the scant evidence available relies on proxies for prices and samples that include the decentralization period. These two features call into question the usefulness of such estimates for assessing the effects of an appreciation on China's trade. This paper offers one approach for addressing these difficulties. Specifically, the paper replaces the formulation explaining trade volumes with a formulation explaining the shares of China's exports and imports in world trade. In addition, the estimates are from a sample that excludes the decentralization period.
We quantify the effects of a real appreciation on China's trade share by applying least squares to a specification that assumes that trade is driven by demand considerations; the associated parameter estimates are based on single equations that treat the exchange rate as exogenous. The evidence offers several findings. First, disaggregation of trade across products is relevant for modeling Chinese imports but less so for exports. Second, the choice of sample period matters for estimating the exchange-rate effects. Specifically, reliance on data from the early 1990s for imports leads to a deterioration in the statistical quality of the results. Third, the choice of formulation is relevant for characterizing the evolution of Chinese trade. Specifically, reliance on constant-elasticity models tends to overstate the responsiveness of Chinese trade to changes in exchange rates. Fourth, the estimation results suggest that a ten-percent real appreciation of the renminbi lowers the share of aggregate Chinese exports by a half of a percentage point. The same appreciation lowers the share of aggregate imports by about a tenth of a percentage point.
Finally, these estimates cannot differentiate between price and volume responses. Only as additional reliable price data become available will it be possible to disentangle these responses. But, in the interim, we hope our estimates might assist the discussion of the effects of exchange rates on China's trade.
9 Appendix
9.1 Exchange-rate Effect on Import Share
The partial derivative of the share with respect to the real exchange rate is
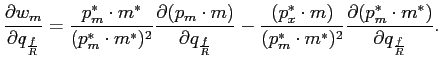
|
(16) |
The next steps involve finding expressions for the partial derivatives on the right-hand side of this expression. The expression for the first partial derivative is

|
|
|
|
||
|
||
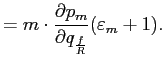
|
(17) |
The expression for the second partial derivative is

|
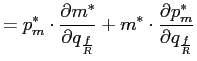
|
|
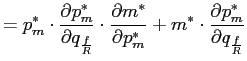
|
||
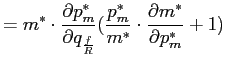
|
||
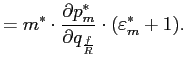
|
(18) |
Substituting the equations for
![]() and
and
![]() into the equation for
into the equation for
![]() yields
yields
![$\displaystyle \frac{\partial w_{m}}{\partial q_{\frac{f}{R}}}=\left[ \frac{p_{m... ..._{m}^{\ast} }{\partial q_{\frac{f}{R}}}\cdot(\varepsilon_{m}^{\ast}+1)\right] ,$](img168.gif) |
(19) |
which is what we use in the paper.
9.2 Exchange-Rate Effect on Export Share
The partial derivative with respect to the real exchange is
|
(20) |
The next step is to find an expression for
![]() :
:

|
|
|
|
||
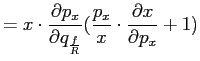
|
||
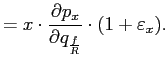
|
(21) |
The expression for the second partial derivative is

|
|
|
|
||
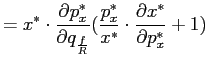
|
||
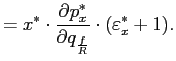
|
(22) |
Thus substituting the equations for
![]() and
and
![]() into the equation for
into the equation for
![]() yields
yields
![$\displaystyle \frac{\partial w_{x}}{\partial q_{\frac{f}{R}}}=\left[ \frac{(p_{... ...{\partial q_{\frac{f}{R}}}\cdot\left( 1+\varepsilon_{x}^{\ast}\right) \right] ,$](img183.gif)
|
(23) |
which is what we use in the paper.
9.3 Estimation Algorithm
The automated-specification algorithm developed by Hendry and Krolzig (2001) offers three advantages relative to implementing a General-to-Specific strategy interactively. First, their algorithm considers all of the statistically valid specifications. Second, the algorithm adjusts the significance levels for statistical tests to recognize the joint nature of model specification and parameter estimation. Finally, each step in the process of automated search can be replicated at once.
The algorithm combines least squares with a selection strategy that is implemented in four stages:
- Estimate the parameters of a general formulation - equation (11) for example - and test for congruency (white-noise residuals).
- Implement multiple `` simplification paths'' simultaneously. One simplification path could get started by excluding the least significant variable whereas another simplification path could get initiated by excluding a block of variables that are jointly insignificant.
- Test whether the specification from a simplification path is congruent. If it is, then implement another round of simplifications and re-test for congruency; continue this process until the specification violates congruency. In that case, the algorithm selects the immediately prior specification and labels it Final model.
- Collect the Final models from all simplification paths and apply encompassing tests to them. The specification that encompasses all others becomes the Specific model. If there is no single encompassing model, then the algorithm forms a `` union'' model using the variables from all of the Final models and re-starts the specification search from step (2). If this strategy fails to yield a single Specific model, then the algorithm applies three information criteria (Akaike, Schwarz, and Hannan-Quinn) to the Final models and selects the one that minimizes all these criteria; that model becomes the Specific model. Otherwise, the algorithm fails to find a Specific model.
9.4 Direction of Vertical Specialization
The design of the estimating equations assumes that the share of
imports of parts for assembly products (
![]() ) affects the
share of exports of parts and goods using those imports (
) affects the
share of exports of parts and goods using those imports (
![]() but that
but that
![]() does not
affect
does not
affect
![]() One
approach to see if this design strategy is consistent with the data
is to estimate the parameters of two equations
One
approach to see if this design strategy is consistent with the data
is to estimate the parameters of two equations
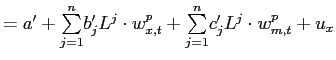
|
||
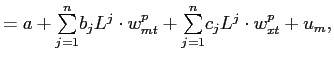
|
where the equations also include dummy variables to control for monthly seasonality along with China's New Year and China's accession to the WTO.
In this context, if movements in the share of exports of parts
are informative for explaining movements in the share of imports of
parts, then the hypothesis that
![]() should be rejected.
Similarly, if movements in the
should be rejected.
Similarly, if movements in the
![]() are
informative for explaining movements in
are
informative for explaining movements in
![]() , then the
hypothesis that
, then the
hypothesis that
![]() should be rejected.
should be rejected.
To carry out these tests, we apply the general to specific
methodology to these two equations and test whether the relevant
parameters are jointly equal to zero. We use monthly data from
January 1997 to February 2004 and use 13 lags for each variable
(![]() in the general
formulation.
in the general
formulation.
The results indicate that one cannot reject the hypothesis that
![]() In other words, movements
in the export share of parts are not informative in explaining
movements in the import share of parts (table 7, top panel).
However, the results reject the hypothesis that
In other words, movements
in the export share of parts are not informative in explaining
movements in the import share of parts (table 7, top panel).
However, the results reject the hypothesis that
![]() meaning that movements in the import share of parts are informative
in explaining movements in the export share of parts. Specifically,
the significance level for the
meaning that movements in the import share of parts are informative
in explaining movements in the export share of parts. Specifically,
the significance level for the ![]() test of the joint hypothesis for rejection of
the selected coefficients is 0.0018. Taken together, the estimates
suggest an asymmetry in the treatment of trade in parts with
movements in imports of parts is informative for predicting exports
of parts but not the other way around.
test of the joint hypothesis for rejection of
the selected coefficients is 0.0018. Taken together, the estimates
suggest an asymmetry in the treatment of trade in parts with
movements in imports of parts is informative for predicting exports
of parts but not the other way around.
Table 7a. Automated Granger Causality Tests -- 1997-2004 - Dep. Var: Imports of Parts (SER=0.09337)
| Equation | Lag Structure: 1 | Lag Structure: 2 | Lag Structure: 3 | Lag Structure: 4 | Lag Structure: 5 | Lag Structure: 6 | Lag Structure: 7 | Lag Structure: 8 | Lag Structure: 9 | Lag Structure: 10 | Lag Structure: 11 | Lag Structure: 12 | Lag Structure: 13 | Tests | p-value |
|---|---|---|---|---|---|---|---|---|---|---|---|---|---|---|---|
-- | -- |
-- |
-- |
-- |
-- |
-- |
-- |
-- |
-- |
-- |
-- |
-- |
-- |
CHW1 | 0.1088 |
Own Lags | 0.4714 |
0e |
0e |
0e |
0e |
0e |
0e |
0e |
0e |
0e |
0e |
0.4129 |
0e |
CHW2 | 0.0736 |
Own Lag: Standard Error | (0.0691) |
-- |
-- |
-- |
-- |
-- |
-- |
-- |
-- |
-- |
-- |
(0.0725) |
-- |
normality | 0.9406 |
-- | -- |
-- |
-- |
-- |
-- |
-- |
-- |
-- |
-- |
-- |
-- |
-- |
-- |
Serial Indep. | 0.0372 |
Exports of Parts | 0e |
0e |
0e |
0e |
0e |
0e |
0e |
0e |
0e |
0e |
0e |
0e |
0e |
Homoskedast. | 0.9952 |
Export of Parts: Standard Error | -- |
-- |
-- |
-- |
-- |
-- |
-- |
-- |
-- |
-- |
-- |
-- |
-- |
-- |
-- |
0e: Selection algorithm excludes this variable for lack of statistical significance
CHW1: Chow test with a 0.5 sample split. CHW2: Chow test with a 0.9 sample split.
Normality: Jarque-Bera test; Serial independence: Autoregressive test; Homoskedasticity: ARCH
Table 7b. Automated Granger Causality Tests -- 1997-2004 - Dep. Var: Exports of Parts (SER=0.1103)
| Equation | Lag Structure: 1 | Lag Structure: 2 | Lag Structure: 3 | Lag Structure: 4 | Lag Structure: 5 | Lag Structure: 6 | Lag Structure: 7 | Lag Structure: 8 | Lag Structure: 9 | Lag Structure: 10 | Lag Structure: 11 | Lag Structure: 12 | Lag Structure: 13 | Tests | p-value |
|---|---|---|---|---|---|---|---|---|---|---|---|---|---|---|---|
Own Lags | 0.3432 |
0e |
0e |
0.0868 |
0.3606 |
0e |
0e |
0e |
0e |
0.2207 |
0e |
0e |
0e |
CHW1 | 0.2288 |
Own Lag: Standard Error | (0.0931) |
-- |
-- |
(0.0929) |
(0.1424) |
-- |
-- |
-- |
-- |
(0.0777) |
-- |
-- |
-- |
CHW2 | 0.2304 |
-- | -- |
-- |
-- |
-- |
-- |
-- |
-- |
-- |
-- |
-- |
-- |
-- |
-- |
normality | 0.0153 |
Imports of Parts | 0e |
0.2271 |
0e |
0e |
-0.4196 |
0e |
0e |
0e |
0e |
0e |
0e |
0.2979 |
0e |
Serial Indep. | 0.5714 |
Import of Parts: Standard Error | -- |
(0.1131) |
-- |
-- |
(0.1623) |
-- |
-- |
-- |
-- |
-- |
-- |
(0.1312) |
-- |
Homoskedast. | 0.261 |
0e: Selection algorithm excludes this variable for lack of statistical significance
CHW1: Chow test with a 0.5 sample split. CHW2: Chow test with a 0.9 sample split.
Normality: Jarque-Bera test; Serial independence: Autoregressive test; Homoskedasticity: ARCH
References
1. Bayoumi, T., J. Lee, and S. Jayanthi, 2005, `` New Rates from New Weights,'' IMF Working Paper, WP/05/99.
2. Cerra, V. and A. Dayal-Gulati, 1999, `` China's Trade Flows: Changing Price Sensitivities and the Reform Process,'' mimeo International Monetary Fund, Washington DC.
3. Cerra, V. and S. Saxena, 2003, `` How Responsive is Chinese Export Supply to Price Signals?'' China Economic Review, 14, 240-270.
4. Doornik, J. and D. F. Hendry, 2000, Modeling Dynamic Systems using PcGive, volume 2, Timberlake, London.
5. Eckaus, R., 2004, `` Should China Appreciate the Yuan?'' MIT Working Paper 04-16. Cambridge: MA.
6. Goldstein, M. and M. Khan, 1985, `` Income and Price Effects in Foreign Trade,'' in R. Jones and P. Kenen (eds.), Handbook of International Economics, vol 2. North-Holland, Amsterdam.
7. Hendry, D.F. and H. Krolzig, 2001, Automated Econometric Model Selection Using PcGets, Timberlake, London.
8. Hooper, P., K. Johnson, J. Marquez, 2000, `` Trade Elasticities for the G-7 Countries,'' Princeton Studies in International Economics, No. 87 (August).
9. Hope, N. and L. Lau, 2004, `` China's Transition to the Market: Status and Challenges,'' Stanford Center for International Development, Working Paper No. 210.
10. Kamada, K., and I. Takagawa, 2005, `` Policy Coordination in East Asia and Across the Pacific,'' International Economics and Economic Policy, 2, 275-306.
11. Lardy, N., 2002, Integrating China into the Global Economy, Brookings, Washington, DC.
12. Lardy, N., 2005, `` China: The Great New Economic Challenge?'' in F. Bergsten (ed.), The United States and the World Economy, Institute for International Economics, Washington, DC.
13. Lau F., Y. Mo, and K. Li, 2004, `` The Impact of a Renminbi Appreciation on Global Imbalances and Intra-Regional Trade,'' Hong Kong Monetary Authority Quarterly Bulletin, March, 16-26.
14. Liang H. and E. Fung, 2005, `` Will a 5 Appreciation Matter for Trade Balance?'' Asia-Pacific Analyst, Issue No 05/07, Goldman Sachs Economic Research.
15. Rodrik, D., 2006, `` What Is So Special About China's Exports?'' NBER Working Paper No. 11947.
16. Rossi, V., 2005, `` Is Revaluation of the Renminbi Good News?'' CESifo Forum, 6, No. 3, 29-36.
17. Swenson, D., 2004, `` Foreign Direct Investment and the Mediation of Trade Flows,'' Review of International Economics, 2, 609-629.
18. Thorbecke, W., 2006, `` The Effects of Exchange Rate Changes on Trade in East Asia,'' RIETI Discussion Paper Series 05-E-009.
19. U.S. Congress, 2003, `` China's Exchange Rate Regime and Its Effects on the U.S. Economy,'' Hearings before the Subcommittee on Domestic and International Monetary, Trade, and Technology, October 1, serial No. 108-56.
20. World Bank, 2005, China: Integration of National Product and Factor Markets, Report No. 31973-CHA, World Bank, Washington DC.
Footnotes
1. Corresponding author. e-mail address is [email protected] Paper prepared for CPBS 2006 Annual Pacific Basin Conference; Federal Reserve Bank of San Francisco; June 16-17, 2006. The calculations are based on PcGets; see Hendry and Krolzig (2001) and PcGive; see Doornik and Hendry (2000). We are grateful to Dale Henderson for detailed comments on this paper. Also, comments on an earlier version of this paper from David Bowman, Neil Ericsson, Joe Gagnon, Bill Helkie, and Steve Kamin are gratefully acknowledged. We also thank participants at the Fall 2004 Midwest International Economics Group and at the Federal Reserve Board's Workshop series for their observations. Finally, we thank Menzie Chinn for pointing out key references and Koichiro Kamada for providing unpublished details on the paper by Kamada and Takagawa (2005). The views in this paper are solely the responsibility of the authors and should not be interpreted as reflecting the views of the Board of Governors of the Federal Reserve System or of any other person associated with the Federal Reserve System. Return to text
2. See Rossi (2005), Eckaus (2004), and the remarks by M. Goldstein and J. Taylor during the October 1, 2003 Hearings on China's exchange rate regime and its effects on the U.S. economy. Return to text
3. See Hope and Lau (2004) and the World Bank (2005). Based on data from the World Bank (2005), the share of transactions using official prices in agricultural products declined from 37 percent in 1985 to 2.7 percent in 2001; the corresponding decline for industrial products is from 64 percent in 1985 to 10 percent in 2004; and the decline for retail services is from 97 percent in 1985 to 3 percent in 2004 (see World Bank (2005), page 7, table 2.1). Return to text
4. We are grateful to Koichiro Kamada for this information. To conserve space, their paper does not report the measure of prices used to translate nominal imports into their real counterpart, nor the model's coefficient estimates. Return to text
5. These data come from CEIC. Return to text
6. Eckaus (2004) also explains
Chinese trade in terms of shares. Also, note that
![]() is what we called
earlier
is what we called
earlier
![]() Return to
text
Return to
text
7. Thorbecke (2006) also considers autoregressive distributed lags as in equation (8). Return to text
8. Hooper, Johnson, and Marquez (2000). Return to text
9. Appendix 9.4 reports the empirical results showing that movements in imports of parts are informative for predicting exports of parts but not the other way around. Return to text
10. The countries included are Belgium, Canada, Finland, France, Germany, Hungary, Ireland, Italy, Japan, Korea, Mexico, Netherlands, Norway, Spain, Sweden, the United Kingdom, and the United States. Exports to these countries account for two-third of China's exports. Return to text
11. Note that the use of a logarithmic formulation does not avoid this statistical issue because, in this case, the distribution of the residuals needs to have an upper bound as the logarithm of the share cannot take positive values. Return to text
12. We use Package version 1.02 of PcGets with its default settings. Return to text
13. Note that the estimating equation excludes, by design, the share of imports of parts and assembly products. The reason for this decision is that the data for exports of ordinary products exclude, by construction in official statistics, exports of products that are assembled using imports of parts. Return to text
This version is optimized for use by screen readers. A printable pdf version is available.