
Board of Governors of the Federal Reserve System
International Finance Discussion Papers
Number 899, July 2007 --- Screen Reader
Version*
What Can the Data Tell Us about Carry Trades in Japanese Yen?
NOTE: International Finance Discussion Papers are preliminary materials circulated to stimulate discussion and critical comment. References in publications to International Finance Discussion Papers (other than an acknowledgment that the writer has had access to unpublished material) should be cleared with the author or authors. Recent IFDPs are available on the Web at http://www.federalreserve.gov/pubs/ifdp/. This paper can be downloaded without charge from the Social Science Research Network electronic library at http://www.ssrn.com/.
Abstract:
This paper examines the available data that may shed light on the carry trade in Japanese yen. We define an individual or a sector to be engaged in the carry trade if it has a short position in yen and a long position in other currencies. The tendency of large yen movements to be skewed toward appreciations is consistent with the existence of substantial carry positions, and other evidence from market prices provides some modest support for an effect from the carry trade. Data on bank loans and bond holdings by currency reveal a large apparent yen carry position of the Japanese official sector and modest carry positions in the Japanese and foreign banking sectors. The Japanese private non-banking sector has a large long foreign-currency position, but does not have a short yen position, and is thus not engaged in the yen carry trade in the aggregate. However, it is possible that exporters and investors in Japan use the derivatives markets to hedge some of their long foreign-currency exposure, with the private non-banking sector outside of Japan (including most hedge funds) likely to be taking on most of the associated carry exposure.
Keywords: foreign exchange, interest rate parity, hedge fund
JEL classification: F31, F32.
* Division of International Finance, Board of Governors of the Federal Reserve System, Washington DC 20551. Thanks to Sigga Benediktsdottir, David Bowman, Sally Davies, Hali Edison, Dick Freeman, Jun Iwasaki, Karen Johnson, Steve Kamin, Michael Leahy, and Ugur Lel for comments and to Josh Hausman, Christian Miller, Charles Murry, and Marcus Newman for technical assistance. The views in this paper are solely the responsibility of the authors and should not be interpreted as reflecting the views of the Board of Governors of the Federal Reserve System or of any other person associated with the Federal Reserve System. Return to text
Introduction and Summary
The carry trade has attracted much attention in the financial press in recent months, with widely disparate evidence cited for its existence and importance. This note assesses the extent to which publicly available data can shed light on the carry trade. We focus on the carry trade in Japanese yen because the yen is the currency most commonly cited by market participants as the funding currency for carry trades, and because Japan has had the lowest interest rates in the world for more than 10 years. These low interest rates imply that carry traders would have been taking short positions in yen and long positions in all other currencies over this entire period, simplifying our attempts to measure the carry trade. We devote particular attention to October 1998, May 2006, and February 2007 as periods in which yen carry trades are commonly reported to have unwound rapidly.
The available data can provide only indirect evidence on the existence and magnitude of carry trades at the level of individual agents. We examine price data from the spot and options foreign exchange markets, volume and positions data from the currency futures market, and balance sheet data for broad sectors of the Japanese and rest-of-world economies that break down assets and liabilities by currencies. Available data on off-balance sheet (derivatives) positions are generally not able to yield much information on carry trade activity, which clearly imposes an important limitation on our results.
From price data, we find possible evidence for the carry trade in the asymmetric distribution of tail events in exchange rate movements. We also find evidence in the asymmetric market price of protection against yen appreciation as opposed to depreciation. However, the price of protection did not take on especially extreme values in the two more recent putative episodes of carry trade unwinding.
Balance-sheet data breaking down assets and liabilities by currencies show that the Japanese official sector could be viewed as having the largest net carry position of the sectors analyzed. However, the motivation behind this position is clearly very different than that of a private institution and would likely not be viewed as standard yen carry trade by most analysts. The Japanese banking sector has a modest net yen carry position. The Japanese private non-banking sector has large net foreign-currency exposure, but even larger net yen exposure. As it is not leveraged on balance, we do not consider it to be a carry position; it is less exposed to exchange rate risk than a carry position. The official sector outside of Japan on balance has a small leveraged position opposite to the yen carry trade. The banking sector outside of Japan has a very small carry exposure. The private non-banking sector outside of Japan probably has greater yen assets than liabilities, and thus does not have a net carry position based on balance sheet data.
Although we have no measurements of carry positions in derivatives markets, we conjecture that the Japanese private non-banking sector (investors and exporters) may desire to hedge some of its net foreign-currency exposure. Hedging demand in the opposite direction is likely to be much smaller, reflecting the fact that Japan is running a trade surplus and has foreign assets that greatly exceed its liabilities. Thus, many of the derivatives counterparties to Japanese exporters and investors are likely to be engaged in the carry trade. Likely candidates to hold these carry positions include hedge funds, pension funds, investment banks, charitable endowments, and individual investors, mainly outside of Japan.
Definition of Carry Trade
There is no generally accepted definition of what constitutes a carry trade. At its narrowest the carry trade refers to borrowing in low-interest currencies to fund deposits in high-interest currencies. At its broadest the carry trade refers to any financial transaction that increases one's high-yielding assets relative to one's low-yielding assets, even when no foreign exchange transaction is involved, such as when a household uses low-interest-bearing short-term deposits to purchase long-term bonds. The broadest definition of the carry trade could describe the behavior of any trader seeking to maximize returns on his portfolio.
We take a middle ground that views taking long positions in high-interest-rate currencies simultaneously with short positions in low-interest-rate currencies as carry trades.1 In addition to outright borrowing in low-interest-rate currencies, the carry trade could operate through currency forward and futures contracts on margin. For example, a hedge fund can enter a forward contract to buy dollars for yen at some future date. This contract has the effect of creating a short position in yen and a long position in dollars.
A common characteristic of carry trades under this definition is that they are leveraged. In general, investors use leverage to raise the expected return on their capital, but this higher return comes at the cost of greater risk. An important feature of leveraged positions is that adverse price movements draw down the collateral pledged by the investor to the lender or counterparty. When the value of the remaining collateral falls below an agreed floor, the lender or counterparty typically demands that the investor provide additional collateral or else the loan is called or the derivatives position is unwound. Unwinding of carry trades under these conditions puts positive feedback and extra volatility into market price movements. The possibility that many carry investors could be forced to cover their short positions at the same time adds to the risk already amplified by leverage. Of course, unleveraged investors may be influenced by many of the same factors that motivate leveraged investors, but, in general, unleveraged investors are less likely to cause immediate positive feedback in market prices because they do not face margin calls.
Profitability of Carry Trades
That carry trades are profitable on average has been known at least since the seminal paper by Meese and Rogoff (1983). According to Meese and Rogoff, for industrial countries, the best predictor of next month's exchange rate is today's exchange rate. Thus, investors can make money on average by borrowing in currencies with low interest rates and investing the proceeds in currencies with high interest rates.2 This finding is evidence against open interest rate parity, which states that expected future exchange rate changes ought to be equal to the interest rate differential, with high-interest-rate currencies expected to depreciate. In fact, most researchers have found that high-interest-rate currencies tend to appreciate against low-interest rate currencies over short and medium horizons, though the predictive power of this effect is quite small.3
The most robust empirical prediction about exchange rates is that, over periods of many years and even decades, exchange rates tend to move in line with inflation differences across countries. In other words, real exchange rates are fairly stable in the very long run. This finding has led some researchers to argue that open interest parity may hold better in terms of long-term indexed bond yields and real exchange rates, though the evidence is weak at best.
The failure of open interest parity, at least over short horizons, remains one of the main puzzles of international finance. Carry trades, by increasing demand for high-interest currencies and reducing demand for low-interest currencies, tend to push up the former currencies and push down the latter.4 Holding interest and inflation differentials constant and, importantly, assuming that real exchange rates are mean-reverting in the long run, carry trades could make future movements in exchange rates more consistent with open interest parity if the currency they initially caused to appreciate gradually falls back and the opposite happens to the currency that initially depreciated. Under this logic, the failure of open interest parity could be attributed in part to an insufficient volume of carry tradesimmediately after an interest differential opens up.5 Indeed, the empirical tendency of exchange rates to move in the direction opposite to that predicted by interest parity, at least temporarily, could be the result of the build-up in carry positions occurring only gradually after an interest differential is established.6
Many hedge funds now view carry trades as part of a broad spectrum of liquid investments, and they design optimal exposures to foreign exchange and other risks based on the estimated levels and covariances of expected returns. By expanding the range of investments as far as possible across countries and instruments they seek the highest prospective returns within their tolerance for risk. Many funds use rolling estimates of expected returns and their covariances. The period of low volatility in foreign exchange markets over the past few years may have encouraged these funds to increase their exposure to the carry trade. Such funds may have underestimated the risk of a resumption of normal volatility and the potential losses that could result from crowded trades as many players seek to exit the carry trade at the same time. Indeed, to a modest extent, this risk seems to have materialized for a short period at the end of February and the beginning of March 2007.
Three Episodes of Unwinding Carry Trades?
We are aware of at least three episodes of yen appreciation that have been widely attributed to an unwinding of yen carry trades. The most dramatic of these occurred in October 1998, immediately after the LTCM crisis, as many banks were reported to be cutting back on the leverage of their hedge fund clients. Two more recent periods that are commonly mentioned as periods of unwinding carry trades are May 2006 and February 2007.7 In the following sections we will look for similarities between these episodes and features that may be consistent with unwinding of carry trades.
Price Measures of the Carry Trade
Each of the three episodes of alleged carry trade unwinding was associated with an appreciation of the yen that was sharp, at least in terms of daily movements. Chart 1 shows that the October 1998 episode, which contained the largest ever one-day movement of the dollar-yen exchange rate, is clearly visible using monthly data. The May 2006 episode is less pronounced, but still noticeable. The episode that began on February 27, 2007 also led to a small uptick in the March 2007 monthly average. (The final observation in Chart 1 is April 2007.)
After the March 2007 meeting of the ECB Governing Council, President Trichet warned that recent low levels of volatility may have lulled traders into a false sense of security about the risk and return of the carry trade. He implied that the carry trade may have pushed the yen below its fundamental value.8 Chart 1 shows that the real dollar-yen exchange rate is currently at a 20-year low, but it recorded even lower levels before 1985. If one were to view the fundamental value of the dollar-yen exchange rate as its long-run average in real terms, then Chart 1 provides some support for President Trichet's statement. However, there are two caveats. First, the long-run average is sensitive to the sample chosen. The real yen exchange rate is not lower than its average over the past 40 years but it is very much below its average over the past 20 years.9 Second, real long-term interest rates in Japan are lower than in the United States. If open interest parity holds in real terms over long horizons then one should expect the real yen exchange rate to be below its long-run average. With 10-year indexed bond yields more than 100 basis points lower in Japan than in the United States, the yen should be more than 10 percent below its long-run equilibrium in real terms, assuming that equilibrium is expected to be reached within 10 years.
As discussed above, the leveraged nature of carry trades imparts positive feedback into exchange rate movements. Moreover, this positive feedback is asymmetric, as margin calls can force the unwinding of positions when exchange rates move adversely, but there is no similar forced action when exchange rates move favorably. Thus, we should expect to find the historical distribution of exchange rate movements skewed toward appreciations of low-interest-rate currencies and depreciations of high-interest-rate currencies.10 That expected asymmetry in exchange rate movements is mainly evident in the relative frequencies of large upward and downward exchange rate movements. Table 1 shows, for three currencies, the frequencies of daily exchange rate movements versus the dollar since 1990, split at their respective means and broken down by increasing standard deviations. European and U.S. interest rates have been relatively similar over the past 20 years; thus we would not expect carry trades to be a significant factor between these currencies. Table 1 shows that for the euro-dollar exchange rate (and that of the German mark before 1999), there is little asymmetry in the distribution of small and large movements. For the yen, which has had consistently lower interest rates since the early 1990s and is a common funding currency for carry trades, the frequency of tail events is clearly higher for appreciations than for depreciations. For the Australian dollar, a relatively high-interest-rate currency, tail events are more common for depreciations than for appreciations. While we cannot directly attribute all these tail events to the impact of carry trades, the evidence is consistent with the hypothesis that carry positions are important and that they are more fragile and more subject to positive feedback than non-carry positions.11
An alternative way of looking for asymmetries induced by leveraged carry trades is to check if volatilities are higher around times of sharp appreciations of currencies bearing low interest rates than they are around times of sharp depreciations. Chart 2 shows that volatility (both actual and implied) of the dollar-yen exchange rate was very high around the time of the sharp yen appreciation of October 1998. The next largest monthly yen appreciations over this period occurred in May 1997 and September 2003. In both cases, realized and implied volatilities jumped, but not to an unusual extent. There was a modest spike in implied dollar-yen volatility during the yen appreciation of May 2006, but realized volatility was little changed because the magnitude of the appreciation was not particularly large. We also note a small spike in volatility with the most recent episode in February-March 2007, although overall levels of volatility remained near historical lows.
A more systematic way to examine this asymmetry is to correlate the level of volatility with the change in the exchange rate. If yen appreciations are associated with higher volatility than yen depreciations, this correlation should be negative.12 Chart 3 shows that implied volatility indeed is generally negatively correlated with changes in the dollar-yen exchange rate. However, measured realized volatility has little systematic correlation with the direction of exchange rate changes, perhaps because the skewness in the distribution of exchange rate movements owes to a relatively small number of tail events.
Many commentators have pointed to risk reversals based on options on exchange rates as evidence of carry trades. Riskless arbitrage ensures that a fully hedged carry position yields zero excess returns; the cost of hedging equals the return from carry. However, it is often possible to purchase protection against extreme losses and still retain positive expected profits. To do this, a yen carry trader purchases a call option on yen that is far out of the money. Thus, we might expect that as more yen carry positions are held, the price of protection against yen appreciation should rise relative to the price of protection against yen depreciation, particularly for options that are significantly out of the money. The relative price of protection is known as a risk reversal.
Chart 4 shows risk reversals for dollar-yen and dollar-euro based on the differences in prices between significantly out-of-the-money call options and significantly out-of-the-money put options. The risk reversal on dollar-euro is generally close to zero, consistent with a low level of carry trades in this currency pair. The risk reversal on yen was close to zero during the summer of 1998. This was a time of strong downward pressure on the yen, which many observers attributed to the carry trade. The price of protection against yen appreciation did not increase until after the yen appreciated sharply in early October, just when carry trades were supposedly unwinding. Risk reversals also widened immediately after the yen appreciations of May 2006 and February 2007, but were not large in the months prior to these dates when carry trades were purportedly building up.
One interpretation of these results is that risk reversals reflect primarily the changing risk appetites or risk perceptions of market participants (potentially including carry traders) rather than changing shares of carry versus non-carry traders. The fact that prices rise more for protection against yen appreciation than depreciation suggests that it may be the risk perceptions of the carry traders that are fluctuating most strongly.
Many observers have noted the fact that in late February 2007, when the yen appreciated sharply, several high-interest-rate currencies depreciated significantly, including the Brazilian real and the New Zealand dollar. Such moves are consistent with the unwinding of carry trades. Chart 5 displays rolling 24-month correlations of dollar-yen with dollar-New Zealand dollar (in black) and dollar-Brazilian real (in red). The yen has been negatively correlated with these currencies recently, and the correlations also turned negative around October 1998, but the negative correlations around these three episodes are not large either in absolute terms or relative to other periods.
Volume Measures of Carry Trade
The two main channels of the carry trade are through 1) borrowing in low-interest currencies and investing the proceeds in high-interest currencies, which we term the "canonical carry trade;" and 2) taking on leveraged positions in derivatives markets, particularly through currency futures and forward contracts, which we term the "derivatives carry trade." The realized profit from either channel is identical, reflecting the fact that major derivatives dealers hedge forward contracts by borrowing and lending in the interbank market. Equations (1)-(3) demonstrate the equality of returns from both channels of the carry trade.
(1) Profit![]() = i
= i![]() - i
- i![]() + e
+ e![]() - e
- e![]()
(2) Profit![]() = e
= e![]() - f
- f
(3) f = e![]() + i
+ i
![]() i
i![]()
Equation (1) defines the profit from the canonical carry trade
as equal to the difference between interest earned in foreign
currency (i![]() minus interest paid in Japanese yen
(i
minus interest paid in Japanese yen
(i![]() plus the appreciation of foreign
currency (e) in terms of yen, where period 0 denotes the initiation
of the position and period 1 denotes the closing.13
Equation (2) defines the profit from the derivatives carry trade as
equal to the difference between the value of foreign currency at
closing (e
plus the appreciation of foreign
currency (e) in terms of yen, where period 0 denotes the initiation
of the position and period 1 denotes the closing.13
Equation (2) defines the profit from the derivatives carry trade as
equal to the difference between the value of foreign currency at
closing (e![]() and the price paid in the forward
contract (f). Equation (3) is the arbitrage condition governing the
price of the forward contract in the interbank market (also known
as covered interest rate parity). A derivatives dealer (most of
whom participate in the interbank market) can hedge his forward
sale of foreign currency (f) by buying foreign currency in the spot
market (e
and the price paid in the forward
contract (f). Equation (3) is the arbitrage condition governing the
price of the forward contract in the interbank market (also known
as covered interest rate parity). A derivatives dealer (most of
whom participate in the interbank market) can hedge his forward
sale of foreign currency (f) by buying foreign currency in the spot
market (e![]() . His opportunity cost is the domestic
interest rate (i
. His opportunity cost is the domestic
interest rate (i![]() , but he can earn income
(i
, but he can earn income
(i![]() by investing in the foreign-currency
interbank market. Substituting equation (3) into equation (2) and
rearranging terms shows that Profit
by investing in the foreign-currency
interbank market. Substituting equation (3) into equation (2) and
rearranging terms shows that Profit![]() =
Profit
=
Profit![]() .
.
Derivatives Carry Trade
A measure of the derivatives carry trade proposed by some observers is the share of currency futures contracts accounted for by net long positions by non-commercial investors on the Chicago Mercantile Exchange. For this measure to be valid, we must assume that a large share of the investors who declare themselves to be non-commercial are speculators using this market to engage in the carry trade and that commercial investors are hedging their real-side activities (and not engaged in the carry trade). Under these assumptions, non-commercial investors should have net short positions in currencies with low interest rates.
Chart 6 shows that, on average, since 1997, non-commercial investors on the Chicago Mercantile Exchange have been short Japanese yen.14 But the fluctuations are large and there are many weeks when non-commercial investors are net long in yen, despite the fact that Japanese interest rates were below U.S. rates throughout this period. Moreover, the timing of changes in positions is often not quite right. For instance, the sharp movement to a net long yen position in late 1998 occurred more than a month before the sharp yen appreciation of October 1998, therefore before the actual unwinding of carry trades.15 In light of the restrictive assumptions needed to connect these data to the carry trade, the small size of futures markets relative to over-the-counter forward contracts, and the fact that these data are from just one of several futures markets in dollar-yen, we are not inclined to draw broad conclusions about the existence and magnitude of carry trade behavior from these volatile data.
Data on the broader derivatives markets, including over-the-counter contracts, do not provide information on the direction of exposure for individual traders or even for aggregate sectors or countries. The BIS semi-annual survey measures only the gross notional and fair market values of contracts by major derivatives dealers. The TIC-D and similar surveys by other governments collect the market values of positions vis-à-vis foreign residents segregated according to whether they are positive or negative. But neither survey collects information on the directions of exposures by currency or other asset class, which are critical to identifying the carry trade. Gross notional volumes have grown very rapidly over the years, which is consistent with a growing volume of carry trades. But the data are not collected at the daily (or even monthly) frequency that would be helpful in linking specific episodes of market behavior to the carry trade.
According to the December 2006 BIS global over-the-counter derivatives survey, outstanding foreign exchange contracts (not counting those on futures exchanges) had a gross notional value of more than $40 trillion. It is widely assumed that hedge funds use derivatives contracts to enter carry trade positions. To some extent, pension funds, charitable endowments, investment banks, and wealthy individuals may also be engaged in carry trades through derivatives. Because derivatives positions are in zero net supply, there must be an equal volume of opposing positions. If the opposing positions were also speculative in nature, there would be no reason to expect to see the asymmetry in market risk pricing that we observed in the previous section. However, as discussed in the following section, there are reasons to believe that the overall positions of hedgers in yen derivatives markets are significantly skewed in a direction opposed to the carry trade. This asymmetry in the riskiness of derivatives positions may explain the asymmetry in risk pricing of derivatives that is apparent in Charts 3 and 4.
Canonical Carry Trade
Data on financial stocks and flows allow us to say a bit more about the size and location of canonical carry trades as opposed to derivatives carry trades. Nevertheless, we are greatly restricted by the aggregate nature of the data. Gross stocks of yen-denominated liabilities provide an upper bound to the carry trade, but this bound is likely to be so far above the level of borrowing in yen for the carry trade as to be nearly useless. Ideally, we would like to identify carry trades according to whether the individual or institution is simultaneously net short yen and net long other currencies. But the best we can do is to see whether broad sectors by country are net short yen and net long other currencies.
We define a carry position to exist for a sector as a whole if the sector has yen-denominated debt liabilities that exceed its yen-denominated debt claims and it has foreign-currency-denominated debt claims that exceed its foreign-currency-denominated debt liabilities. This is what we mean by a net yen short, net foreign-currency long position. Note that we are excluding equity and real estate claims and liabilities.16The size of the carry position is given by the smaller of the net yen short position and the net foreign-currency long position. If a sector is long in both yen and foreign currencies, or if it is short in both yen and foreign currencies, then under this definition it does not have a carry position. If it is long yen and short foreign currency, then it has a negative carry position.
Our sectoral measures could either understate or overstate true underlying carry trades at the individual level. For example, if some individuals have a negative carry position, the aggregate sectoral measure will understate the size of the positive carry positions. On the other hand, if some individuals are short yen but not long in foreign currency and other individuals are long in foreign currency but not short yen, their positions may aggregate up to an apparent carry trade at the sectoral level that overstates the sum of carry trades held at the individual level.
The country breakdown we choose is Japan versus the rest of the world. The sectors we examine are official, bank, and private non-bank. At the outset we note that Japan has had large current account surpluses for more than 20 years. As of end-2006 Japan had net debt claims on the rest of the world valued at $2.2 trillion.17Japan's gross debt claims were $3.7 trillion and gross debt liabilities were $1.5 trillion. It is likely that most of the claims were in foreign currencies and most of the liabilities were in yen. Thus, Japan in the aggregate fits our definition of a yen carry trader, with the rest of the world on balance taking the opposite position (long yen, short other currencies) but we do not have sufficient information on the currency breakdown of these assets to calculate the net carry position.
The Japanese official sector, on our definition, has an enormous carry position. It holds $875 billion in foreign currency assets that are funded entirely by yen liabilities as it has essentially no foreign-currency liabilities.18 (Indeed, the government of Japan has issued yen liabilities far in excess of its foreign exchange assets.) However, it is important to note that the motivations of the Japanese official sector are very different from those of private investors. In particular, the Japanese government is not subject to margin calls and probably has a greater tolerance for risk than private investors.
The official sector outside of Japan has assets that are reported to be denominated in yen of $106 billion and assets whose currency is not reported of $1.7 trillion; it is believed that the vast majority of the latter figure is denominated in dollars and euros.19 The extent of yen borrowing by the official sector in the rest of the world is not known, but is likely to be small. Non-yen borrowing by this sector, of course, is enormous. On balance, the official sector outside of Japan is probably taking a leveraged position in the opposite direction of the yen carry trade of at least $106 billion, but probably not much more than $106 billion. Again, the motivations behind this position are very different from those of the private sector.
According to the BIS locational banking statistics, the banking sector outside of Japan has roughly equal claims and liabilities denominated in yen, $582 billion and $593 billion respectively as of December 2006, implying a very small net carry position of $11 billion. (This sector has large positive net claims in foreign currencies.)
The data are less complete for the private non-banking sector outside of Japan. An upper bound on gross canonical carry trades in this sector is provided by total claims by banks on non-banks outside of Japan denominated in yen, shown in Chart 7.20 Note that this measure does not net out positions within the non-banking sector. There are three components to these yen funds: first, banking offices in Japan lend yen to foreign residents (the red portion of the bars); second, banking offices outside of Japan lend yen outside of their home markets (excluding loans to Japan) (in yellow); and third, banking offices outside of Japan lend yen in their home markets (in blue).
The bars in Chart 7 are an upper bound on gross canonical carry trades because there are many reasons besides the carry trade for private non-banks outside of Japan to borrow in yen. For example, an American company could finance the purchase of a Japanese subsidiary or yen-denominated financial assets by borrowing in yen. There do not appear to be large surges of yen lending during the periods widely viewed as characterized by rising carry trades, notably early 1998 and early 2006. (The data end in 2006:Q4.) The modest uptick in 1998:Q4 almost certainly represents the valuation effect of the yen appreciation that quarter when translating yen loans into dollars. Altogether, gross canonical yen carry trades by the private non-banking sector outside of Japan surely total less than the $300 billion displayed in Chart 7.
An upper bound on net canonical carry trades by private non-banks outside of Japan is net claims denominated in yen by Japanese banks on all foreigners.21 Chart 8 shows net claims of Japanese banking offices on foreign residents in yen (in green) and in other currencies (in orange). Net claims in yen were nearly $300 billion in 1996, fell to $200 billion by the middle of 1998, turned slightly negative in 2004, and have since rebounded to just over $100 billion. Once again, there does not appear to be a runup in net yen lending during early 1998 when carry trades were believed to be on the increase, and the rise from 2005 to 2006 is rather modest. Overall, this upper bound for canonical yen carry trades is small relative to the size of global financial markets. Moreover, much if not most of the $1.5 trillion in debt liabilities of Japan to the rest of the world is likely to be held by the private non-banking sector outside of Japan, and most of these liabilities are likely to be denominated in yen. Thus, it is probable that this sector does not have a net short yen position and thus does not have a canonical net yen carry position.
Despite the secular decline in net cross-border claims in yen (shown in Chart 8), net cross-border claims of the Japanese banking sector in foreign currencies have trended up.22 As of end-2006, cross-border claims in foreign currencies exceeded cross-border liabilities in foreign currencies by $270 billion.23 Data on local foreign-currency claims and liabilities of Japanese banks from the BIS locational banking statistics show that most of the external currency mismatch, or $230 billion as of last year, is offset by net foreign-currency liabilities in Japan.24 On balance, the data indicate that the Japanese banking sector has a canonical net yen carry position of $40 billion.25
The Japanese private non-banking sector is a very large net holder of foreign bonds, most of which are in foreign currencies. According to the International Investment Position data reported by the Ministry of Finance, total Japanese private non-banking sector holdings of foreign assets (excluding direct investment and equities) were $1544 billion at year-end 2006. There is no reported currency breakdown of these assets. However, the IMF Coordinated Portfolio Investment Survey (CPIS) data report a currency breakdown for Japanese private holdings of foreign debt securities through 2005.26 The first column of Table 2 displays estimates of the foreign-currency cross-border holdings of the Japanese private non-banking sector under the assumption that these assets have a currency breakdown identical to that reported in the CPIS for private debt securities. These estimates also assume that the cross-border liabilities of the private non-banking sector are entirely in yen. These liabilities totaled $382 billion in 2006.
The second column of Table 2 shows the private non-banking sector's net foreign-currency claims on the banking sector. The third column shows that total net foreign-currency claims of the Japanese private non-banking sector are around $1.3 trillion. This position cannot be considered a carry trade, however, because the private non-banking sector has an even larger net long position in yen assets, as most of the $4.6 trillion of Japanese public sector bonds are held by this sector.27
Finally, Charts 9 and 10 present securities flow data which are often cited by observers writing on the carry trade. These data have a strong seasonal pattern which we have removed to permit analysis. The primary feature of both securities inflows and outflows is their volatility. Debt outflows (Chart 9) reversed briefly around or just before the times of the three episodes of hypothesized carry trade unwinding (October 1998, May 2006, and February 2007).28 But these reversals were not unusually large. Inflows (Chart 10) jumped up in all three episodes, but these increases were large only for the most recent episodes. Overall, it is not clear that these data have much to say about the carry trade.
Conclusions
Data on market prices can provide some limited and indirect information on the carry trade. The yen has appreciated abruptly in periods that some market participants believe to have been associated with a net unwinding of yen carry trades, and some high-interest-rate currencies have depreciated sharply at those times. However, to attribute these exchange rate movements to the carry trade may reflect an ex post search for a plausible explanation. More systematic evidence derives from the observed asymmetry in the distribution of tail events between low-interest-rate and high-interest-rate currencies, which is consistent with the existence of carry positions. Also suggestive is the fact that market participants are typically more willing to pay for protection against yen appreciation than against yen depreciation, which is consistent with the view that short-yen positions are dominated by speculators and long-yen positions are dominated by hedgers. The price of protection jumps more after yen appreciation than after yen depreciation, suggesting that carry traders are spooked by losses. However, there is no tendency for the price of protection to rise in periods when carry trades are purported to have been rising (just before the episodes of unwinding).
Data on market volumes can provide rough estimates of the sizes of net positions by broad sectors through balance-sheet assets and liabilities. However, there is essentially no useful data on positions through derivatives markets. The balance-sheet data do not exhibit large movements in positions around periods that have been linked to carry trade behavior in the financial press. However, as with the equity markets, it may be that developments in the carry trade primarily determine the prices at which assets are held, rather than the quantities.
Balance-sheet data identify canonical carry-trade-like positions of roughly the following magnitudes. (See Table 3.) The Japanese official sector has a net yen carry position of $875 billion. The Japanese banking sector has a net yen carry position of $40 billion. The Japanese private non-banking sector has positive net foreign-currency assets of around $1.3 trillion. However, the position of the private non-banking sector cannot be considered a carry position, because the sector is not leveraged; it is net long yen assets by an even larger magnitude.29 The official sector outside of Japan has a net leveraged position in the opposite direction of the yen carry trade, but not by much more than $100 billion. The banking sector outside of Japan has a very small yen carry position. The private non-banking sector outside Japan most likely does not have a net yen carry position on its balance sheet.
There are no published data on the magnitude of the yen carry trade through derivatives markets. As every derivatives contract creates two parties with opposite positions, one can explore the derivatives carry trade through either the demand side or the supply side. Possible sources of supply are Japanese exporters and Japanese households holding foreign-currency assets, both of whom may wish to hedge the value of their foreign-currency claims.30 Sources of demand for yen carry positions include hedge funds, pension funds, investment banks, charitable endowments, and individual investors. Most of the demand for the derivatives yen carry trade likely arises in the private non-banking sector outside of Japan.
References
Burnside, Craig, Martin Eichenbaum, Isaac Kleshchinski, and Sergio Rebelo (2006) "The Returns to Currency Speculation," National Bureau of Economic Research Working Paper No. 12489, August.
Engel, Charles (1996) "The Forward Discount Anomaly and the Risk Premium: A Survey of Recent Evidence," Journal of Empirical Finance 3, 123-92.
Klitgaard, Thomas, and Laura Weir (2004) "Exchange Rate Changes and Net Positions of Speculators in the Futures Market," Federal Reserve Bank of New York Economic Policy Review 10, May.
Lewis, Karen (1995) "Puzzles in International Financial Markets," in Gene Grossman and Kenneth Rogoff (eds.) Handbook of International Economics, Amsterdam: North-Holland.
Meese, Richard, and Kenneth Rogoff (1983) "Empirical Exchange Rate Models of the Seventies: Do They Fit Out of Sample?" Journal of International Economics 14, 3-24.
Plantin, Guillaume, and Hyun Song Shin (2006) "Carry Trades and Speculative Dynamics," manuscript, Carnegie Mellon University, March.
Chart 1. The Exchange Value of the Yen (in terms of US Dollars)
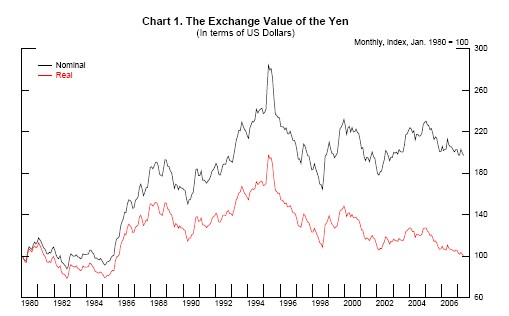
Chart 2. Dollar-Yen Implied and Realized Volatilities
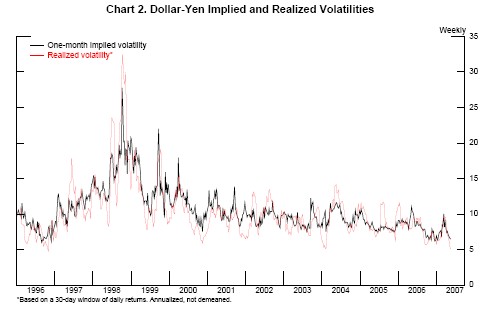
*Based on a 30-day window of daily returns. Annualized, not demeaned.
Chart 3. 120-Day Moving Correlations of Volatilities and Movements in the Dollar-Yen Exchange Rate
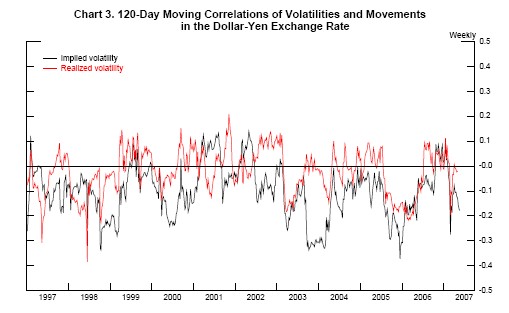
Chart 4. Far Out-of-the-Money Risk Reversals* (based on one-month 10-delta options)
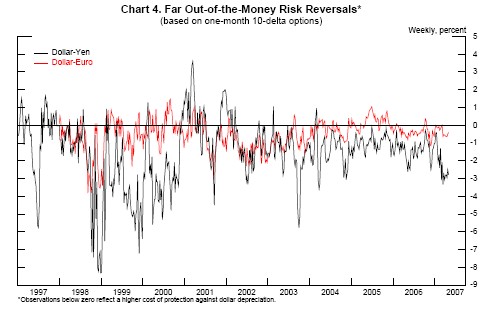
* Observations below zero reflect a higher cost of protection against dollar depreciation.
Chart 5. 24-Month Moving Correlations of Changes in Japanese Exchange Rate with New Zealand and Brazilian Exchange Rates (Exchange rates expressed in terms of U.S. dollars)
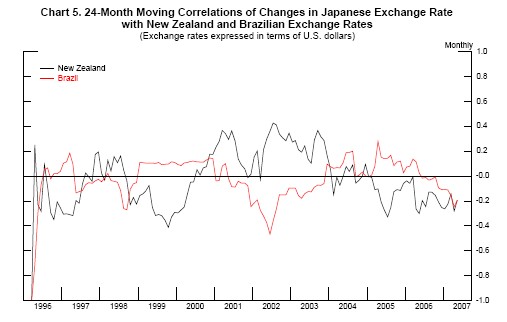
Chart 6. Non-Commercial Net Long Positions in Japanese Yen (Chicago Mercantile Exchange)
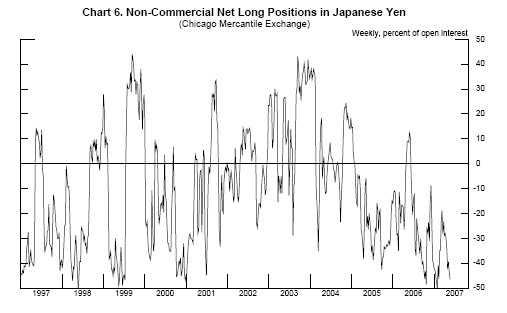
Chart 7. Total Yen Bank Claims on Non-banks Outside of Japan
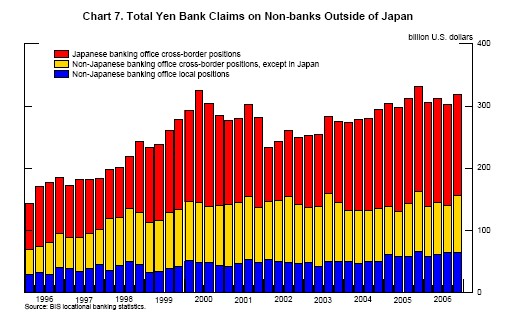
Source: BIS locational banking statistics.
Chart 8. Net Cross-border Claims of Banking Offices in Japan
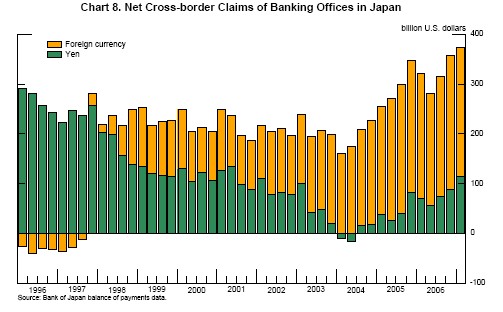
Source: Bank of Japan balance of payments data.
Chart 9. Net Purchases of Foreign Securities by Japanese Residents
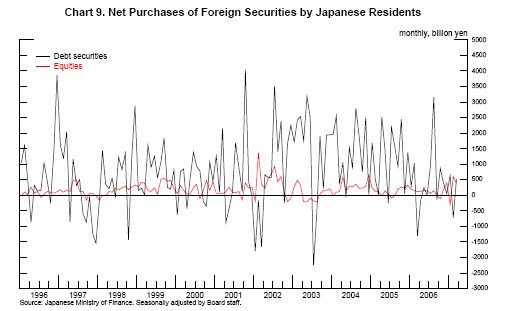
Source: Japanese Ministry of Finance. Seasonally adjusted by Board staff.
Chart 10. Net Purchases of Japanese Securities by Foreign Residents
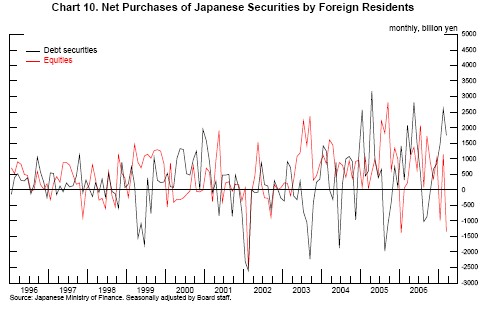
Source: Japanese Ministry of Finance. Seasonally adjusted by Board staff.
Table 1. Frequency of Daily Exchange Rate Movements Above and Below Mean: Exchange rates expressed as dollars per foreign currency* (1990-2006)
| Euro (D. Mark) | Euro (D. Mark) | Yen | Yen | Australian Dollar | Australian Dollar | |
|---|---|---|---|---|---|---|
| Size of Movements | % below | % above | % below | % above | % below | % above |
| All | 51.12 | 48.88 | 50.81 | 49.19 | 46.99 | 53.01 |
| >= 1 s.d. | 13.53 | 14.18 | 12.67 | 12.32 | 12.96 | 13.17 |
| >= 2 s.d. | 2.70 | 2.48 | 2.17 | 3.20 | 3.25 | 2.27 |
| >= 3 s.d. | 0.50 | 0.57 | 0.41 | 0.93 | 0.67 | 0.26 |
| >= 4 s.d. | 0.12 | 0.10 | 0.12 | 0.31 | 0.31 | 0.05 |
* Below-mean movements are in the general direction of dollar appreciation, above-mean movements are in the direction of dollar depreciation
Table 2. Net Foreign-currency Claims of Japanese Private Non-banking Sector
| Year | Cross-Border* | vis-a-vis Japanese Banks |
end of year, $ billions Total |
|---|---|---|---|
| 2000 | 643 | 32 | 676 |
| 2001 | 600 | 71 | 671 |
| 2002 | 653 | 53 | 706 |
| 2003 | 794 | 82 | 876 |
| 2004 | 953 | 82 | 1,035 |
| 2005 | 989 | 134 | 1,123 |
| 2006 | 1,138 | 112 | 1,250 |
Source: IMF coordinated portfolio investment statistics, Ministry of Finance international investment position data, BIS locational banking statistics. *Assumes foreign-currency share of private non-banking sector holdings of foreign non-equity assets equals foreign-currency share of portfolio debt securities (from CPIS, 2006 share extrapolated at 2005 level). Also assumes all private non-banking liabilites to foreigners are denominated in yen.
Table 3. Canonical Net Yen Carry Positions* ($ billions, December 2006)
| Japan | Rest of World | |
|---|---|---|
| Official Sector | 875 | ~-150** |
| Banking Sector | 40 | 10 |
Private, Non-banking Sector |
0 | 0 |
Sources: IMF COFER, CPIS and IFS databases, BIS locational banking statistics, Japan Ministry of Finance international investment position data, Bank of Japan balance of payments data. * Short yen, long foreign currency positions in debt claims and liabilities. Does not account for derivatives holdings. Does not include ($ billions, December 2006) equity or real estate. ** Position opposite to yen carry trade -- long yen and short foreign currency. Based on foreign exchange reserves data reported to the IMF. Of reserves for which currency breakdown is available, $106 billion are in yen. Of reserves for which no currency breakdown is available only a small fraction is assumed to be yen.
Footnotes
1. In principle we wish to combine both financial and commercial positions. An exporter to Japan may take a short financial position in yen to offset his long commercial position, and we would not wish to view him as engaging in the carry trade. In practice, it is difficult to identify such offsetting positions. Return to text
2. Not all leveraged investors in foreign exchange markets are motivated primarily by interest rate differentials. Some traders believe they can predict future exchange rate movements well enough to make profits. Of course, the data do not speak to the underlying rationale for any given market trade. Return to text
3. See Lewis (1995) and Engel (1996) for reviews of the literature. See Burnside, Eichenbaum, Kleshchelski, and Rebelo (2006) for a recent treatment. Return to text
4. Because central banks hold short-term interest rates fixed in the short run and move them only gradually over the medium run, the main impact of carry trades is on exchange rates. It is generally accepted that carry positions are concentrated in short-term instruments. Return to text
5. Of course, in a purely rational frictionless world, exchange rates would jump to their new equilibrium values without any trades, but in the real world not all agents continuously optimize, and price adjustments may require the more active agents to take new or additional positions. Return to text
6. Plantin and Shin (2006) build a model with this feature. Return to text
7. The yen appreciated somewhat more in April 2006 than in May, but other asset movements were greater in May and the episode is generally dated as May 2006. Return to text
8. Low volatility may also encourage greater diversification into non-yen assets by unleveraged Japanese investors, though, to some extent, there will be offsetting flows into yen assets from unleveraged non-Japanese investors. Return to text
9. The Balassa-Samuelson hypothesis suggests that Japan's equilibrium real exchange rate was rising secularly during the period of its postwar catchup to the United States, so that one may not wish to extend the average back too far. Return to text
10. It is widely accepted that equity prices are skewed toward declines. One reason may be the positive feedback induced by holding stocks in margin accounts. Borrowing yen to purchase dollars may be expected to have a similar effect on the exchange rate as borrowing cash to purchase equities has on the equity price. Return to text
11. The asymmetry in tail events in the expected direction is also present for the New Zealand dollar and for the Brazilian real, two other common target currencies for the carry trade. Despite relatively low interest rates in Switzerland, there is little apparent asymmetry in movements of the Swiss franc, which is highly correlated with the euro. Return to text
12. The exchange rate is defined in terms of yen per dollar, so a yen appreciation is a negative movement. Return to text
13. The spot and forward exchange rates are expressed in logarithms. The profit is thus measured as a percent of notional principal. Return to text
14. These positions are normalized by total open interest. Open interest has risen sharply over the past year, which would impart a notable downward trend if non-commercial positions were plotted in absolute rather than relative terms. We believe that it is positions relative to the size of the market that are most informative, particularly as trading on the CME represents a very small fraction of total derivatives contracts in dollar-yen. Return to text
15. Studies have found, however, that non-commercial positions are not generally good predictors of future exchange rate changes. See, for example, Klitgaard and Weir (2004). Return to text
16. Equity and real estate are not generally associated with the carry trade and their values are not as strongly correlated with exchange rates as the values of debt instruments. Return to text
17. International investment position data are from the website of the Japanese Ministry of Finance, www.mof.go.jp. Return to text
18. IMF IFS database. Position reported as of December 2006. Return to text
19. IMF COFER database. Positions reported as of December 2006. Return to text
20. This chart does not include yen-denominated bonds issued by private non-banks outside of Japan and held by non-banks, for which data do not exist. It does include such bonds when held by banks of any location. This chart also does not include yen-denominated assets of banks in countries that do not report assets by currency to the BIS. Nearly all industrial countries and many large developing countries report bank claims by currency to the BIS. Return to text
21. This measure does not include yen-denominated claims of Japanese non-banks on private non-banks outside of Japan, for which data do not exist. As noted earlier, banks outside of Japan have very little net currency mismatch, so almost all yen lending from a Japanese bank to a foreign bank must be lent onward in yen. We also assume that the official sector outside of Japan is not a significant borrower in yen. Return to text
22. In the BIS locational banking statistics and in the Japanese balance of payments statistics, each country's banking sector includes all banking offices in that country, including offices of foreign banks. Data on financial institutions accounts from the Bank of Japan show that as of December 2006 offices of foreign banks in Japan had liabilities to Japanese residents of $299 billion (total liabilities minus liabilities to foreign affiliates) but there is no information on the currency denomination of either the liabilities or the assets held by these offices. Net funding of overseas affiliates from foreign bank offices in Japan was fairly small, at $19 billion. Return to text
23. These data are from the balance of payments statistics, which do not include trust accounts or investment trusts (mutual funds) managed by banks. The BIS locational banking statistics, which include such accounts, show total foreign-currency assets of nearly $1100 billion as of December 2006. In the BIS data, the liabilities corresponding to these trust assets are typically reported in yen. However, the net worth of banks is not directly exposed to fluctuations in the value of trust assets because the value of the claims of the ultimate holders of the trusts moves with the value of the underlying assets. Return to text
24. Of this $230 billion, roughly half reflects deposits of foreign exchange reserves by the official sector and half reflects net claims by the private non-banking sector in Japan. Return to text
25. The banking sector's non-debt claims (equity and real estate) roughly equal its non-debt liabilities (net worth) so that positive net foreign-currency debt claims imply negative net yen debt claims. Return to text
26. The CPIS data include claims of Japanese banks but exclude non-security debt claims such as loans and deposits. More than 80 percent of the non-banking claims consist of debt securities. As of year-end 2005, 74 percent of the CPIS claims were denominated in foreign currency. Return to text
27. Foreign holdings of Japanese public sector bonds are $401 billion. The yen exposure from holdings of public sector bonds by the Japanese banking sector are effectively passed through to the non-banking sector through yen deposits. Public sector bond data are from the Japanese Ministry of Finance website and refer to December 2006. Return to text
28. March 2007 is the final observation shown in the charts. Return to text
29. Much attention lately has been devoted to the rise of foreign exchange margin trading by Japanese households. Typical estimates of gross open retail foreign exchange positions in Japan are well under $100 billion, so that this sector is not short yen in the aggregate. However, some individual investors may be short yen. Return to text
30. Given Japan's large trade surplus, it is plausible that hedging demand from Japanese exporters exceeds hedging demand in the opposite direction from foreign exporters to Japan. Similarly, given that Japanese holdings of foreign assets greatly exceed foreign holdings of Japanese assets (even after netting out foreign exchange reserves) it is plausible that hedging demand from Japanese investors exceeds hedging demand in the opposite direction from foreign investors. Return to text
This version is optimized for use by screen readers. Descriptions for all mathematical expressions are provided in LaTex format. A printable pdf version is available. Return to text