
QE 1 vs. 2 vs. 3... A Framework for Analyzing Large Scale Asset Purchases as a Monetary Policy Tool*
Keywords:
Abstract:
1 Introduction
For the last fifty years or so, the primary tool of monetary policy has been the Federal Funds rate. During the recent crisis, however, the Federal Reserve unveiled a variety of new policy measures never used before in its history. What forced its hand initially was the disruption of credit markets in the wake of the deterioration of the subprime mortgage market, which began in August of 2007. By December of 2008, however, a second factor came into play: The Funds rate effectively reached its zero lower bound, implying that, despite the severity of the recession, the conventional option of reducing the Funds rate was no longer available. Beyond managing expectations of the future path of the Funds rate, the new unconventional measures afforded the Fed the only avenue for stimulating the economy.
Because of their dramatic impact on the size of the Fed's balance sheet, the most visible of the new policy measures have been large asset scale purchases (LSAPs), known more generally as quantitative easing (QE). Shortly after the meltdown of the shadow banking system that followed the Lehman failure in September 2008, the Fed initiated what is now known as QE1: the purchase over time of a variety of high grade securities, including agency mortgage backed securities (AMBS), agency debt, and long term government bonds, with AMBS ultimately accounting for the bulk of the purchases. It also set up a commercial paper lending facility, which effectively involved the purchase of commercial paper since the Fed accepted these instruments as collateral for the loans made to the facility. In October 2010, the Fed announced a second wave of asset purchases (QE2), this time restricted to long term government bonds and smaller in scale than QE1. Finally, in September 2011, the Fed embarked on a variation of QE, known as Operation Twist. This action was essentially a sterilized acquisition of long term government bonds financed by selling some of its short term bonds. Twist was extended in the summer of 2012 and the possibility of more LSAPs remains under discussion.
A lengthy empirical literature has emerged attempting to identify the effects of the LSAP programs on market interest rates and economic activity1. Though not without considerable controversy, a common theme of this research is that the LSAPs have indeed been effective in reducing various interest rates and interest rate spreads and, as a consequence, in stimulating economic activity. In addition, the weight of the evidence also suggests that QE1 was more effective in this regard than either QE2 or Operation Twist.
At the same time, given the descriptive nature of much of this empirical work, the precise mechanism through which LSAPs may have affected the economy remains an open question. So too is a theoretical account for why QE1 may have had different effects than than the subsequent LSAP programs. In addition, to being larger in scale, QE1 differed from the other LSAPs in several other important respects. First, the asset purchases involved securities with at least some degree of private payoff risk, whereas QE2 and Operation Twist were restricted to the acquisition of government bonds. In addition, QE1 was undertaken at the height of the crisis when financial markets and institutions were under maximum duress. By contrast, QE2 and Operation Twist were undertaken in periods of greater normalization of credit markets. Exactly which of these factors could account for differences in the impact of various LSAP programs has yet to be resolved.
The purpose of this paper is to develop a macroeconomic model that presents a unified approach to analyzing LSAPs as a monetary policy tool. A number of papers have analyzed specific types of LSAPs. For example Gertler and Karadi (2011), Curdia and Woodford (2011), Del Negro, Eggertsson, Ferrero and Kiyotaki (2011) and Williamson (2012) have considered central bank purchases of imperfectly secured private claims, as in QE1. Others have considered purchases of long term government bonds, such as Vayanos and Vila (2009) and Chen, Curdia, and Ferrero (2011). The mechanisms emphasized both within and across these strands of work have been somewhat different. Our goal is to present a single framework that can be used to analyze the impact of LSAPs across the variety that are used in practice.
As in Gertler and Karadi (2011; GKa) and Gertler and Kiyotaki (2011; GKi), we start from the perspective that LSAPs reflect central bank intermediation. Like any private intermediary, the central bank funds asset acquisition by issuing interest bearing short term claims. In the early stages of QE1 the Fed raised funds by issuing short term government debt it borrowed from the Treasury. Shortly thereafter, it made use of its recently acquired power to pay interest on reserves. It funded subsequent expansion of its balance sheet by issuing interest bearing reserves, which can be thought of as overnight government debt. Seen from this vantage, it is clear that LSAPs can usefully affect real activity only to the extent there exist limits to arbitrage in private financial intermediation. If an extranormal return on a particular asset is present, one would expect private intermediaries to expand their balance sheets to eliminate this premium, so long as they do not face any constraints in borrowing. In this instance, as we will make clear, central bank intermediation of the asset is neutral: It does not affect asset prices and returns: It simply displaces private intermediation.
If however private intermediaries are constrained in their ability to borrow, LSAPs can matter. The advantage the central bank has is that it is able to obtain funds elastically by issuing riskless government debt. It is this advantage in borrowing over private intermediaries that introduce a role for central bank intermediation in reducing excess returns. In this regard, as GKa show, the net benefits from LSAPs can be positive even if the central bank is less efficient than the private sector in intermediating the assets, so long as this efficiency differential is not "too large." Further, these net benefits are likely to be increasing in a financial crisis since in this instance limits to private arbitrage are likely to be unusually tight.
Along these lines, one can interpret QE1 as the Federal Reserve increasing central bank intermediation to offset the disruption of private intermediation brought about by the demise of the shadow banking system.2Indeed, the assets it purchased were held largely by the financial institutions that had devolved into distress. Further, given that various measures of credit spreads suggested that excess returns were at a peak in the wake of the Lehman collapse, the expected gains from central bank intermediation were likely largest at this point. It is this kind of reasoning about the effect of QE1 that our model will capture.
We will also argue that a similar logic applies to the purchase of long term government bonds. Absent limits to arbitrage in the private sector, central bank exchanges of short term for long term government debt should be neutral. To the extent that credit market frictions give rise to an extranormal term premium in the market for government bonds, there is scope for LSAPs to reduce long term rates.3 The way they reduce long term rates is by reducing inefficiently large term premia. Of course, one should expect limits to arbitrage to be weaker in markets for government bonds than for private securities. We incorporate this feature in our model. The net effect is that a dollar purchase of government bonds has a weaker effect on excess returns than a dollar purchase of private sector assets. This accords with the conventional wisdom that the liquidity of the government bond market makes purchases of this asset less effective everything else equal than purchases of less liquid assets such as AMBS or commercial paper.
An alternative view of how LSAPs affect the economy stresses household asset demands that are less sensitive to returns than a standard frictionless model might predict, due to factors such as a "preferred habitat" for particular maturities.4Given these frictions in asset demand, changes in asset supplies in the private sector brought about by LSAPs affect prices and returns of competing assets. What matters however is the behavior of the marginal investors, which in reality are likely to be leveraged financial intermediaries.
Indeed, as Table 1 shows, in 2008 leveraged financial institutions held significant fractions of the types of assets ultimately acquired under the various LSAP programs, including roughly forty-five percent of the AMBS outstanding, forty percent of the agency debt, and sixteen percent of the government debt.5 Thus, any characterization of how LSAPs affect the economy must take into account the behavior of these institutions. In this respect, even if household demands for long maturity assets are "excessively inelastic", arbitrage by private intermediaries could render central bank purchases of long term government bonds neutral. We clarify this point within our formal analysis.
Section 2 presents the key elements of our model. We derive a set of qualitative results regarding how LSAPs affect the economy. Section 3 adds the production sector and then characterizes the complete equilibrium. Section 4 then presents some numerical experiments to illustrate the impact of LSAPs. Here we emphasize the implications of purchases of securities with private risks versus long term government bonds. We also consider the implications of the zero lower bound and also compare LSAPs with conventional interest rate adjustments. Concluding remarks are in section 6.
2 The Model: Key Ingredients
The framework is based on GKa. It is a reasonably standard New-Keynesian model modified to allow for banks that transfer funds from households to non-financial firms, as well as to the government. An agency problem constrains the ability of banks to obtain funds from households. It ultimately makes the balance sheet of the banking sector a critical determinant of the cost of credit that borrowers face. One difference from GKa is that banks may intermediate the funding of long term government bonds as well the funding of non-financial firms.
In addition, there is a central bank that can conduct monetary policy either by adjusting the short term interest rate (so long as the zero lower bound is not binding) or by engaging in asset purchases. The central bank may purchase long term government bonds as well as private securities.
In this section we characterize the distinctive elements of the model, which involve the behavior of households, banks and the central bank. We defer a description of the production sector and complete equilibrium to the next section. For didactic reasons, we start with the case where banks intermediate all the funding of non-financial firms and long-term government bonds. This simple setup allows us to starkly illustrate some of key results regarding the effects of central bank asset purchases. We then subsequently allow households to directly hold long term securities subject to transactions costs and then draw out the implications of this more general setting.
In the interest of parsimony, we abstract from a number of the features present in conventional quantitative DSGE models that are not central to understanding the effects of central bank asset purchases (e.g, variable capital utilization, wage rigidity, price and wage indexation, etc.). However we include two standard features, habit formation and flow investment adjustment, because they can be added at minimal cost of complexity and they substantially improve the model's quantitative performance.
Finally, we should make clear that we do not attempt to develop a model that can provide a comprehensive description of recent events. We do not include an explicit housing sector nor do we try to model asset bubbles, etc. Rather our goal is to formulate a macroeconomic model to help understand how LSAPs might work in a setting that has some of the key features of the current crisis.
2.1 Households
There is a continuum of identical households of measure unity. Each household consumes, saves and supplies labor. Households save by lending funds to competitive financial intermediaries and possibly also by lending funds to the central bank.
Within each household there are two types of members: workers and bankers. Workers supply labor and return the wages they earn to the household. Each banker manages a financial intermediary and similarly transfers any earnings back to the household. The household thus effectively owns the intermediaries that its bankers manage. It deposits funds, however, in intermediaries that is does not own. Finally, within the family there is perfect consumption insurance. As will become clear, this simple form of heterogeneity within the family allows us to introduce financial intermediation in a way that maintains much of the tractability of a representative agent framework.
At any moment in time the fraction ![]() of the household members are workers and the fraction
of the household members are workers and the fraction ![]() are bankers. Over time an individual can switch between the two occupations. In particular, a banker this period stays a banker next period with probability
are bankers. Over time an individual can switch between the two occupations. In particular, a banker this period stays a banker next period with probability ![]() , which is
independent of history. The average survival time for a banker in any given period is thus
, which is
independent of history. The average survival time for a banker in any given period is thus
![]() We introduce a finite horizon for bankers to insure that over time they do not retain earnings to the point where they can fund all investments from their own capital.
Thus every period
We introduce a finite horizon for bankers to insure that over time they do not retain earnings to the point where they can fund all investments from their own capital.
Thus every period
![]() bankers exit and pay out their retained earnings as dividends to their respective household. The bankers who exit become workers and are replaced by a similar number of workers
randomly becoming bankers, keeping the relative proportion of each type fixed. The household, though, provides its new bankers with a small amount of start up funds equal to
bankers exit and pay out their retained earnings as dividends to their respective household. The bankers who exit become workers and are replaced by a similar number of workers
randomly becoming bankers, keeping the relative proportion of each type fixed. The household, though, provides its new bankers with a small amount of start up funds equal to
![]() per new banker.
per new banker.
Let ![]() be consumption and
be consumption and ![]() family labor supply. Then the households
discounted utility
family labor supply. Then the households
discounted utility ![]() is given by
is given by
![\displaystyle u_{t}=E_{t}\sum\limits_{i=0}^{\infty }\beta ^{i}\left[ \ln (C_{t+i}-hC_{t+i-1})-\frac{\chi }{1+\varphi }L_{t+i}^{1+\varphi }\right]](img10.gif)
with
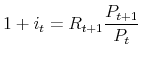
Both intermediary deposits and government debt are one period real bonds that pay the gross real return ![]() from
from ![]() to
to ![]() In the equilibrium we consider, the instruments are both riskless and are thus perfect substitutes. Thus, we impose this condition from the
outset. Thus let
In the equilibrium we consider, the instruments are both riskless and are thus perfect substitutes. Thus, we impose this condition from the
outset. Thus let ![]() be the total quantity of short term debt the household acquires,
be the total quantity of short term debt the household acquires, ![]() , be the real wage,
, be the real wage, ![]() payouts to the household from ownership of both non-financial and financial firms and,
payouts to the household from ownership of both non-financial and financial firms and, ![]() lump sum taxes. Then the household budget constraint is given by
lump sum taxes. Then the household budget constraint is given by
where
The household's objective is to choose
![]() and
and ![]() to maximize (1) subject to (2). Let
to maximize (1) subject to (2). Let
![]() denote the marginal utility of consumption. Then the first order conditions for labor supply and consumption/saving are standard:
denote the marginal utility of consumption. Then the first order conditions for labor supply and consumption/saving are standard:
with
2.2 Banks
Banks lend funds obtained from households to non-financial firms and to the government. In addition to acting as specialists that assist in channeling funds from savers to investors, they engage in maturity transformation. They hold long term assets and fund these assets with short term liabilities (beyond their own equity capital.)6 In addition, financial intermediaries in this model are meant to capture the entire banking sector, i.e. investment banks as well as commercial banks.
Intermediaries fund two type of activities: First, they make loans to non-financial firms to finance capital. Let ![]() be the net period income flow to the bank from a loan that is
financing a unit of capital,
be the net period income flow to the bank from a loan that is
financing a unit of capital, ![]() , the market value of the security,
, the market value of the security, ![]() the
depreciation rate of a unit of capital and
the
depreciation rate of a unit of capital and ![]() a random disturbance. Then the rate of return to the bank on the loan,
a random disturbance. Then the rate of return to the bank on the loan, ![]() , is given by:
, is given by:
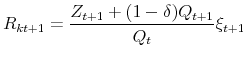
The variables
In addition, banks hold long term government bonds. Here we suppose that it is too costly for households to directly manage long term bonds in their portfolios. As we noted earlier, we relax this assumption by permitting household to directly hold long term securities subject to explicit
transactions costs. For our benchmark model, however, banks intermediate all the funding of long term bonds. We assume each bond is a perpetuity that pays one dollar per period indefinitely. Let ![]() be the price of the bond and
be the price of the bond and ![]() the price level. Then the real rate of return on the bond
the price level. Then the real rate of return on the bond
![]() is given by
is given by
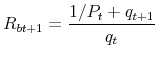
The general equilibrium also determines
2.2.1 The Bank's Maximization Problem
Let ![]() be the amount of equity capital - or net worth - that a banker/intermediary
be the amount of equity capital - or net worth - that a banker/intermediary ![]() has at the end of period
has at the end of period ![]() ;
; ![]() the deposits the intermediary
obtains from households,
the deposits the intermediary
obtains from households, ![]() the quantity of financial claims on non-financial firms that the intermediary holds and
the quantity of financial claims on non-financial firms that the intermediary holds and ![]() the quantity of long term government bonds. The intermediary balance sheet is then given by
the quantity of long term government bonds. The intermediary balance sheet is then given by
Net worth is accumulated through retained earnings. It is thus the difference between the gross return on assets and the cost of liabilities:
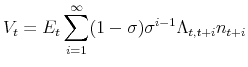
The banker's objective is to maximize the discounted stream of payouts back to the household, where the relevant discount rate is the household's intertemporal marginal rate of substitution,
![]() Under frictionless capital markets the timing of the payouts is irrelevant. To the extent the intermediary faces financial market frictions, it is optimal for the banker to
retain earnings until exiting the industry. Accordingly, the banker's objective is to maximize expected terminal wealth, given by
Under frictionless capital markets the timing of the payouts is irrelevant. To the extent the intermediary faces financial market frictions, it is optimal for the banker to
retain earnings until exiting the industry. Accordingly, the banker's objective is to maximize expected terminal wealth, given by
To motivate a limit on the bank's ability to obtain deposits, we introduce the following moral hazard/costly enforcement problem: At the beginning of the period the banker can choose to divert funds from the assets it holds and transfer the proceeds to the household of which he or she is a member.7 The cost to the banker is that the depositors can force the intermediary into bankruptcy and recover the remaining fraction of assets. However, it is too costly for the depositors recover the funds that the banker diverted.
We assume that it is easier for the bank to divert funds from its holdings of private loans than from its holding of government bonds: In particular, it can divert the fraction ![]() of
its private loan portfolio and the fraction
of
its private loan portfolio and the fraction
![]() with
with
![]() from it government bond portfolio. Here we are attempting to capture in a simple way that the bank's private loan portfolio is likely an easier target for bank malfeasance
than its government bond portfolio given that it is more difficult for depositors to monitor the performance of latter than the former.8
from it government bond portfolio. Here we are attempting to capture in a simple way that the bank's private loan portfolio is likely an easier target for bank malfeasance
than its government bond portfolio given that it is more difficult for depositors to monitor the performance of latter than the former.8
Accordingly for depositors to be willing to supply funds to the banker, the following incentive constraint must be satisfied
The left side is what the banker would lose by diverting a fraction of assets. The right side is the gain from doing so.
The bankers maximization problem is to choose
![]() and
and ![]() to maximize (9 ) subject to (7), (8) (10).
to maximize (9 ) subject to (7), (8) (10).
2.2.2 Solution
Let
![]() be the Lagrange multiplier associated with the incentive constraint (10) and let
be the Lagrange multiplier associated with the incentive constraint (10) and let
![]() be the bank's "augmented" stochastic discount factor, equal to the product
be the bank's "augmented" stochastic discount factor, equal to the product
![]() and the multiplier
and the multiplier
![]() :
:
where the
The expected excess returns on bank assets satisfy9
When the incentive constraint is not binding the discounted excess returns are zero. With
![]() ,
, ![]()
![]() ,financial markets are frictionless: Banks acquire assets to the point where the discounted return on each asset, equals the discounted cost of deposits. Further, in this case
,financial markets are frictionless: Banks acquire assets to the point where the discounted return on each asset, equals the discounted cost of deposits. Further, in this case
![]() equals unity, so that for each asset the standard arbitrage condition under perfect markets arises: The expected product of the households' intertemporal marginal rate of
substitution and the excess return equals zero.
equals unity, so that for each asset the standard arbitrage condition under perfect markets arises: The expected product of the households' intertemporal marginal rate of
substitution and the excess return equals zero.
When the incentive constraint is binding, however, limits to arbitrage emerge that lead to positive excess returns in equilibrium. The excess returns increase with how tightly the incentive constraint binds, as measured by the multiplier
![]() . Note that the excess return to capital implies that for a given riskless interest rate, the cost of capital is higher than would otherwise be. As consequence, investment and
real activity will be lower than would be otherwise in general equilibrium. Indeed, a financial crisis in the model will involve a sharp increase in the excess return to capital.
. Note that the excess return to capital implies that for a given riskless interest rate, the cost of capital is higher than would otherwise be. As consequence, investment and
real activity will be lower than would be otherwise in general equilibrium. Indeed, a financial crisis in the model will involve a sharp increase in the excess return to capital.
Notice also that the excess return on government bonds is smaller than the excess return on loans by the multiple
![]() This occurs because the proportion of funds a bank can divert from its bond portfolio is only the fraction
This occurs because the proportion of funds a bank can divert from its bond portfolio is only the fraction ![]() of the proportion it can divert from its loan portfolio. As a result the incentive friction that limits arbitrage is weaker for government bonds than for loans by the factor
of the proportion it can divert from its loan portfolio. As a result the incentive friction that limits arbitrage is weaker for government bonds than for loans by the factor ![]()
The limits to arbitrage stem from the following restriction that the incentive constraint places on the size of a bank's portfolio relative to its net worth:
| (14) | ||
with
The measure of assets that enters the bank's balance sheet constraint applies a weight of
Observe that ![]() is the maximum ratio of the adjusted measure of assets to net worth that the bank may hold without violating the incentive constraint. It depends inversely on
is the maximum ratio of the adjusted measure of assets to net worth that the bank may hold without violating the incentive constraint. It depends inversely on
![]() ; An increase in the bank's incentive to divert funds reduces the amount depositors are willing to lend. Conversely, an increase in the discounted excess return on assets,
; An increase in the bank's incentive to divert funds reduces the amount depositors are willing to lend. Conversely, an increase in the discounted excess return on assets,
![]() or the discounted safe rate,
or the discounted safe rate,
![]() increases the franchise value of the bank,
increases the franchise value of the bank, ![]() reducing the bank's incentive to divert funds. Depositors thus become willing to lend more, raising
reducing the bank's incentive to divert funds. Depositors thus become willing to lend more, raising
![]()
Finally, the weight
![]() that augments the bank's discount factor is the marginal value of net worth averaged across exiting and continuing states:
that augments the bank's discount factor is the marginal value of net worth averaged across exiting and continuing states:
with
![\displaystyle \frac{\partial V_{t}}{\partial n_{t}}=E_{t}\widetilde{\Lambda }% _{t,t+1}[(R_{kt+1}-R_{t+1})\phi _{t}+R_{t+1}]](img80.gif) |
With probability
2.2.3 Aggregation
Let ![]() be the total quantity of loans that banks intermediate,
be the total quantity of loans that banks intermediate, ![]() the
total number of government bonds they hold. and
the
total number of government bonds they hold. and ![]() their total net worth. Since neither component of the maximum adjusted leverage ratio
their total net worth. Since neither component of the maximum adjusted leverage ratio
![]() depends on bank specific factors, we can simply sum across the portfolio restriction on each individual bank (14) to obtain
depends on bank specific factors, we can simply sum across the portfolio restriction on each individual bank (14) to obtain
Equation (17) restricts the aggregate value of (adjusted) assets that the banking system can hold to be less than or equal to the multiple
Total net worth evolves as the sum of the retained earnings by the fraction ![]() of surviving bankers and the transfers that new bankers receive,
of surviving bankers and the transfers that new bankers receive, ![]() , as follows.
, as follows.
![\displaystyle N_{t}=\sigma \lbrack (R_{kt}-R_{t})\frac{Q_{t-1}S_{pt-1}}{N_{t-1}}% +(R_{bt}-R_{t})\frac{q_{t-1}B_{pt-1}}{N_{t-1}}+R_{t}]N_{t-1}+X](img91.gif)
The main sources of variation in
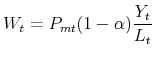
2.3 Central Bank Asset Purchases
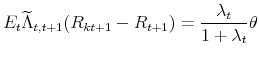
As equations (12) and (13) suggest, if private intermediation is balance sheet constrained, excess returns on assets arise. If these constraints are particularly tight, as would be the case in a financial crisis, then excess returns will be unusually high, with negative consequences for the cost of capital and real activity. Within our model, large scale asset purchases provide a way for the central bank to reduce excess returns and thus mitigate the consequences of a disruption of private intermediation.10
In particular, we now allow the central bank to purchase quantities private loans
![]() and long term government bonds
and long term government bonds
![]() For each each type of security it pays the respective market prices
For each each type of security it pays the respective market prices ![]() and
and ![]() Though when limits to arbitrage in the private market are operative, the central bank's acquisition of securities will have the effect of bidding up the
prices on each of these instruments and down the excess returns. To finance these purchases, it issues riskless short term debt
Though when limits to arbitrage in the private market are operative, the central bank's acquisition of securities will have the effect of bidding up the
prices on each of these instruments and down the excess returns. To finance these purchases, it issues riskless short term debt ![]() that pays the safe market interest rate
that pays the safe market interest rate ![]() In particular, the central bank's balance sheet is given by
In particular, the central bank's balance sheet is given by
where we assume that the central bank turns over any profits to the Treasury and receives transfers to cover any losses. For the time being we suppose that the central bank issues the short term debt to households. Later we discuss an equivalent scenario where
As we discussed earlier, these kinds of asset purchases essentially involve substituting central bank intermediation for private intermediation. What gives the central bank an advantage in this situation is that, unlike private intermediaries it is able to obtain funds elastically by issuing short term liabilities. It is able to do so because within our framework the government can always commit credibly to honoring its debt. Accordingly, there is no agency conflict than inhibits the central bank from obtaining funds from the private sector. Put differently, in contrast to private financial intermediation, central bank intermediation is not balance sheet constrained.11
At the same time, we allow for the central bank being less efficient than the private sector at making loans. In particular, we assume the central bank pays an efficiency cost of ![]() per unit of private loans intermediated and
per unit of private loans intermediated and ![]() per unit of government bonds. Accordingly, for asset purchases to produce welfare gains, the central bank's
advantage in obtaining funds cannot be offset by its disadvantage in making loans. Its advantage in obtaining funds is greatest when excess returns are large (i.e when limits to private arbitrage are tight), as will be the case in a financial crises. As for its disadvantage in making loans: It is
reasonable to suppose the relative efficiency cost of intermediating government bonds,
per unit of government bonds. Accordingly, for asset purchases to produce welfare gains, the central bank's
advantage in obtaining funds cannot be offset by its disadvantage in making loans. Its advantage in obtaining funds is greatest when excess returns are large (i.e when limits to private arbitrage are tight), as will be the case in a financial crises. As for its disadvantage in making loans: It is
reasonable to suppose the relative efficiency cost of intermediating government bonds,
![]() is small. For
is small. For ![]() , it depends on the type of credit
instrument. The types of "private loans" for which one might expect
, it depends on the type of credit
instrument. The types of "private loans" for which one might expect ![]() to be small include highly rated securitized assets such as agency mortgage backed securities as opposed to
commercial and industrial loans that involve extensive monitoring. Accordingly, it is the former type of instrument we have in mind in characterizing central bank purchases of private securities as opposed to the latter.
to be small include highly rated securitized assets such as agency mortgage backed securities as opposed to
commercial and industrial loans that involve extensive monitoring. Accordingly, it is the former type of instrument we have in mind in characterizing central bank purchases of private securities as opposed to the latter.
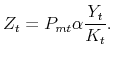
The way asset purchases affect the real economy is ultimately by affecting the price ![]() and (hence the) excess return on capital
and (hence the) excess return on capital
![]() Accordingly, let
Accordingly, let ![]() and
and ![]() be the total supplies of private loans and long term government bonds, respectively. Then by definition:
be the total supplies of private loans and long term government bonds, respectively. Then by definition:
where as before
When the aggregate balance sheet constraint is not binding, asset prices and returns are determined by frictionless arbitrage. Asset purchases by the central bank of either private loans or long term bonds are neutral. They simply lead to central bank intermediation displacing some private intermediation, without any effect on asset prices. To the extent central bank intermediation involves efficiency costs, further, asset purchases are clearly welfare reducing in this kind of environment.
This neutrality result disappears, however, if the constraint is binding. Given the total quantity of bank equity, an increase in the central bank's holding of either private securities or long term governments raises the total demand for private securities. Intuitively, with limits to arbitrage
present on private credit flows, central bank intermediation expands overall asset demand and does not simply displace bank intermediation one for one. Further, given that asset supplies are relatively inelastic in the short run, the enhanced asset demand pushes up ![]() and down the excess return on capital.
and down the excess return on capital.
Equation (21) also reveals that it matters which asset the central bank acquires. In particular, purchases of government bonds will have a weaker effect on the demand for private assets than would the the direct purchase of this asset by the factor
![]() Intuitively, the central bank acquiring government bonds frees up less bank capital than does the does the acquisition of a similar amount of private loans. It is effectively by
freeing up intermediary capital that asset purchases are able to expand the overall demand for private assets. In the limiting case of frictionless arbitrage in the government bond market (i.e.,
Intuitively, the central bank acquiring government bonds frees up less bank capital than does the does the acquisition of a similar amount of private loans. It is effectively by
freeing up intermediary capital that asset purchases are able to expand the overall demand for private assets. In the limiting case of frictionless arbitrage in the government bond market (i.e., ![]() ), bond purchases have no effect.
), bond purchases have no effect.
Purchases of either asset affect the excess returns of both due to the arbitrage relation implied by equations (12) and (13):
As we noted earlier, though, because limits to arbitrage are weaker for government bonds than for private securities, the excess return on the former is only the fraction
Finally, up to this point we have assumed that the central bank funds assets purchases by issuing short term debt directly to households. An equivalent formulation has the central bank issue the debt directly banks which in turn fund this activity by issuing deposits to households. The short term government debt that banks absorb, further, can take the form of interest bearing reserves held on account at the central bank, as was the case in practice for the most part. Assuming that the agency friction does not apply to intermediating reserves, the bank will not be constrained in its funding of this asset. Thus, as in the baseline scenario, the central bank is able to elastically issue short term liabilities to fund its asset purchases. It is straightforward to show that the equilibrium conditions in the scenario are identical to those in the baseline case. The identical balance sheet constraint on bank asset holdings applies.
Along these lines, it does not matter whether the central bank finances asset purchases by issuing short term liabilities or by selling some of its holdings of short term government debt, so long as its short term assets and liabilities are in effect perfect substitutes. Thus for example, purchases of long term government bonds financed by interest bearing reserves, as occurred under QE2, are equivalent to purchases financed by selling holdings of short term Treasury Bills, so long the Treasury Bills and interest bearing reserves are close substitutes. In either case, the central bank is expanding the amount of long term government bonds funded by short term debt government debt. Also, how the asset purchase works in either case depends on the same set of considerations: the extent of limits to arbitrage in private markets.
2.4 Allowing for Direct Household Securities Holdings
We now permit households to directly hold private securities and long term government bonds. However, we introduce limits on household participation by assuming transaction costs. Absent these costs, households would engage in frictionless arbitrage of asset returns.
We suppose that for private securities a household faces a holding cost equal to the percentage
![]() of the value of the securities in its respective portfolio for
of the value of the securities in its respective portfolio for
![]() . Similarly, for government bonds there is a holding cost equal to the percentage
. Similarly, for government bonds there is a holding cost equal to the percentage
![]() of the total value of government bonds held for
of the total value of government bonds held for
![]() Accordingly, there is a certain amount of each asset that the household can hold costlessly. Going above these levels involves transactions costs which are
increasing at the margin. We motivate this cost structure as capturing in a simple way limited participation in asset markets by households that leads to incomplete arbitrage.
Accordingly, there is a certain amount of each asset that the household can hold costlessly. Going above these levels involves transactions costs which are
increasing at the margin. We motivate this cost structure as capturing in a simple way limited participation in asset markets by households that leads to incomplete arbitrage.
Accordingly, the household budget constraint becomes
![\displaystyle C_{t}+D_{ht}+Q_{t}[S_{ht}+\frac{1}{2}\kappa (S_{ht}-\overline{S}% _{h})^{2}]+q_{t}[B_{ht}+\frac{1}{2}\kappa (B_{ht}-\overline{B}_{h})^{2}]](img120.gif)
Resolving the household's optimization yields the same first order conditions for labor supply and deposits as before. The choices for private securities and long term government bonds are given by
Demand for each asset above its frictionless capacity level is increasing in the excess return relative to the respective curvature parameter that governs the marginal transaction cost. Note that as marginal transactions cost go to zero, excess returns disappear: Households are able to engage is frictionless arbitrage of security returns. Conversely, as marginal transactions costs go to infinity, households asset demands go to their respective frictionless capacity values,
Overall, one can view the household asset demand structure as a parsimonious way to capture two important forms of heterogeneity that are absent from the model. First, in reality, a sizeable fraction of non-financial firms are able to obtain funds by issuing securities directly to households on the open market and do not have to borrow directly from banks. These firms are typically large well established entities, in contrast to younger and smaller non-financial borrowers that typically require the kind evaluation and monitoring services that banks offer. Second, households differ in their ability to manage a sophisticated portfolio: A limited supply of "sophisticated" households accordingly prevents frictionless arbitrage of security returns by the household sector. In practice both forms of heterogeneity help explain why both private and government securities holdings are divided between households and banks. Our model provides a very simple way to account for this pattern of asset holdings that is meant to be a stand-in for a more explicit treatment.
With households directly participating in securities markets, the equilibrium conditions in the markets for private loans and government bonds now require:
To understand the implications for central bank asset purchases, note that with direct household participation in securities markets we can rewrite the aggregate bank portfolio constraint (21) as
with
In this general case, the effects of asset purchases on prices and excess returns depend on the responsiveness of household as well as bank portfolios to arbitrage opportunities. Consider first the case where the the marginal transaction costs facing the household are infinity (i.e.
![]() ). In this instance, a household holds the respective frictionless capacity value of each asset,
). In this instance, a household holds the respective frictionless capacity value of each asset,
![]() and
and
![]() and is completely unresponsive to arbitrage opportunities. Here the analysis is very similar to the simple case of no direct household participation analyzed in section
2.2. If the portfolio constraint on banks is not binding, then as before banks adjust their asset holding to drive excess returns to zero. Even though households cannot absorb additional securities, they are willing to absorb deposits which do not involve transactions
costs. Given that banks are free to arbitrage returns, central bank asset purchases are neutral. An increase in either
and is completely unresponsive to arbitrage opportunities. Here the analysis is very similar to the simple case of no direct household participation analyzed in section
2.2. If the portfolio constraint on banks is not binding, then as before banks adjust their asset holding to drive excess returns to zero. Even though households cannot absorb additional securities, they are willing to absorb deposits which do not involve transactions
costs. Given that banks are free to arbitrage returns, central bank asset purchases are neutral. An increase in either ![]() or
or ![]() simply leads to a one for one reduction in private bank intermediation of the respective security without any impact on prices or returns.
simply leads to a one for one reduction in private bank intermediation of the respective security without any impact on prices or returns.
If the portfolio constraint binds then, as in the simple case of section 2.2, asset purchases increase the net demand for private securities. The presence of inelastic household security demands, further strengthens the effects of a given size purchase of either security. It does so by reducing the participation of the active traders in the market (in this case the banks). Because everything else equal the purchases are larger relative to bank holdings of the respective asset, they will have a larger impact on prices and returns. These results are consistent with the fact that asset prices depend on asset supplies if household demand is relatively inelastic (e.g for "preferred habitat" reasons.) We stress, however, that it is also key that arbitrage by the active traders in the market is limited. Absent the balance sheet constraint on banks, asset purchases would be neutral despite inelastic asset demands by households.
As household security demands become increasingly elastic (![]() moves toward zero), the effects of central bank asset purchases weaken. As before, assuming total supplies of each asset
are inelastic in the short run, central bank purchases of either security will place downward pressure on excess returns. A decline in excess returns, however, reduces households' security holdings, dampening the overall effect of the purchases on asset demands. Put differently, household asset
demands move in a way that offsets the effect of central bank asset purchases. This offsetting effect becomes stronger as transactions cost become smaller. In the limiting case of zero transactions cost, of course, households are able to perfectly arbitrage and central bank asset purchases are
neutral.
moves toward zero), the effects of central bank asset purchases weaken. As before, assuming total supplies of each asset
are inelastic in the short run, central bank purchases of either security will place downward pressure on excess returns. A decline in excess returns, however, reduces households' security holdings, dampening the overall effect of the purchases on asset demands. Put differently, household asset
demands move in a way that offsets the effect of central bank asset purchases. This offsetting effect becomes stronger as transactions cost become smaller. In the limiting case of zero transactions cost, of course, households are able to perfectly arbitrage and central bank asset purchases are
neutral.
In sum, for central bank asset purchase to affect asset prices and returns, limits to arbitrage must be present for both households and banks.
2.5 Long Term Bond Yields
We have argued that the effects of LSAPs are transmitted to the real economy via their impact on excess returns (relative to a frictionless benchmark.) Popular discussions of LSAPs, however, emphasize the impact on long term bonds rates and various credit spreads. The empirical literature has followed this direction by studying the effects of LSAPs on these variables. Of course another relevant consideration in focusing on the behavior of these yields is that excess returns are not directly observable.
Within our model the government bond is a consol that pays a dollar in perpetuity. Let
![]()
![]() be the ex post gross nominal return on this security from
be the ex post gross nominal return on this security from ![]() ; Then we can express the nominal price
; Then we can express the nominal price
![]() as the following discounted sum:
as the following discounted sum:
To understand the impact of LSAPs on long term bond yields it is useful to define
where discount factors depend on the expected sequence of excess returns measure by
To a first order, we can decompose the movement in
![]() into terms reflecting the expected path the frictionless nominal rate
into terms reflecting the expected path the frictionless nominal rate
![]() and terms reflecting the excess return
and terms reflecting the excess return
![]() As we saw in the previous section, LSAPs work by pushing down the component of
As we saw in the previous section, LSAPs work by pushing down the component of
![]() due to expected excess returns that stem from limits to arbitrage. Absent these excess returns, LSAPs would have no effect on
due to expected excess returns that stem from limits to arbitrage. Absent these excess returns, LSAPs would have no effect on
![]()
On the other hand, to the extent that long term bond purchases are successful in pushing down excess returns the overall impact on
![]() may be muted by an expected increase in the frictionless nominal rate. In particular, by pushing down excess returns the LSAPs stimulate both real activity and inflation, leading
to an expected future increase in short term interest rates. It is the expected response of future short rates than dampens the overall responds of LSAPs on long term yields.
may be muted by an expected increase in the frictionless nominal rate. In particular, by pushing down excess returns the LSAPs stimulate both real activity and inflation, leading
to an expected future increase in short term interest rates. It is the expected response of future short rates than dampens the overall responds of LSAPs on long term yields.
We can similarly construct a yield to maturity for the private security. The main difference is that now the per period payoff is the nominal dividend payment net depreciation,
![]() Finally, much of the evidence of LSAPs on returns is reported for securities of a given finite maturity, as opposed to consols or other kinds of
infinitely-lived assets. In the quantitative section we describe how we approximate the returns on shorter maturity securities.
Finally, much of the evidence of LSAPs on returns is reported for securities of a given finite maturity, as opposed to consols or other kinds of
infinitely-lived assets. In the quantitative section we describe how we approximate the returns on shorter maturity securities.
3 The Production Sector, Government, and Equilibrium
We now close the model by describing the non-financial production sector, government policy, and the general equilibrium.
3.1 Non-financial Firms
There are three types of non-financial firms in the model: intermediate goods producers, capital producers, and monopolistically competitive retailers. The latter are in the model only to introduce nominal price rigidities. We describe each in turn.
3.1.1 Intermediate Goods Producers
Intermediate goods producers make output that they sell to retailers. They are competitive and earn zero profits in equilibrium. Each operates a constant returns to scale technology with capital and labor inputs. Let ![]() be output,
be output, ![]() total factor productivity,
total factor productivity, ![]() labor,
labor, ![]() capital, Then:
capital, Then:
Let
It follows that we may express gross profits per unit of capital
The acquisition of capital works as follows. At the end of any period ![]() , the intermediate goods producer is left with a capital stock of
, the intermediate goods producer is left with a capital stock of
![]() . It then buys
. It then buys ![]() units of new capital from capital producers.
Its capital stock for
units of new capital from capital producers.
Its capital stock for ![]() is then given by
is then given by
where
To finance the new capital, the firm must obtain funding from a bank.14
For each new unit of capital it acquires it issues a state-contingent claim to the future stream of earnings from the unit:
![]() etc. As we discussed earlier, banks are able to perfectly monitor firms and
enforce contracts. As a result, through competition, the security the firm issues is perfectly state-contingent with producers earning zero profits state-by-state. In addition, the value of the security
etc. As we discussed earlier, banks are able to perfectly monitor firms and
enforce contracts. As a result, through competition, the security the firm issues is perfectly state-contingent with producers earning zero profits state-by-state. In addition, the value of the security ![]() is equal to the market price of the capital underlying security. Finally, the period
is equal to the market price of the capital underlying security. Finally, the period ![]() payoff is
payoff is
![]() : the sum of gross profits and the value of the leftover capital multiplied by the capital quality shock, which corresponds to the definition of the
rate of return in equation.(5).
: the sum of gross profits and the value of the leftover capital multiplied by the capital quality shock, which corresponds to the definition of the
rate of return in equation.(5).
Before proceeding, it is worth emphasizing that the financial frictions that banks face in obtaining funds from depositors affect the cost of capital to non-financial firms. As we saw in the section 2.2, the capital constraints on banks limit the supply of funds they can intermediate, which raises loan rates. As we illustrate later, a financial crisis sharply tightens these capital constraints.
3.1.2 Capital Goods Producers
Capital producers make new capital using input of final output and subject to adjustment costs. They sell the new capital to firms at the price ![]() Given that households own capital
producers, the objective of a capital producer is to choose
Given that households own capital
producers, the objective of a capital producer is to choose ![]() to solve:
to solve:
![\displaystyle \max E_{t}\sum_{\tau =t}^{\infty }\Lambda _{t,\tau }\left\{ Q_{\tau }^{i}I_{\tau }-\left[ 1+f\left( \frac{I_{\tau }}{I_{\tau -1}}\right) \right] I_{\tau }\right\}](img166.gif)
From profit maximization, the price of capital goods is equal to the marginal cost of investment goods production as follows,
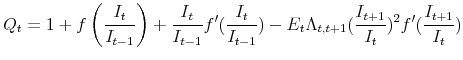
Profits (which arise only outside of steady state), are redistributed lump sum to households.
3.1.3 Retail Firms
Final output ![]() is a CES composite of a continuum of mass unity of differentiated retail firms, that use intermediate output as the sole input. The final output composite is given
by
is a CES composite of a continuum of mass unity of differentiated retail firms, that use intermediate output as the sole input. The final output composite is given
by
![\displaystyle Y_{t}=\left[ \int_{0}^{1}Y_{ft}{}^{\frac{\varepsilon -1}{\varepsilon }}df\right] ^{\frac{\varepsilon }{\varepsilon -1}}](img169.gif)
where
Retailers simply re-package intermediate output. It takes one unit of intermediate output to make a unit of retail output. The marginal cost is thus the relative intermediate output price ![]() We introduce nominal rigidities following Calvo. In particular, each period a firm is able to freely adjust its price with probability
We introduce nominal rigidities following Calvo. In particular, each period a firm is able to freely adjust its price with probability ![]() . Accordingly, each
firms chooses the reset price
. Accordingly, each
firms chooses the reset price
![]() to maximize expected discounted profits subject to the restriction on the adjustment frequency. Following standard arguments, the first order necessary condition for this
problem is given by:
to maximize expected discounted profits subject to the restriction on the adjustment frequency. Following standard arguments, the first order necessary condition for this
problem is given by:
![\displaystyle \sum_{i=0}^{\infty }\gamma ^{i}\Lambda _{t,t+i}\left[ \frac{P_{t}^{\ast }}{% P_{t+i}}-\mu P_{mt+i}\right] Y_{ft+i}=0](img174.gif)
with
![\displaystyle P_{t}=\left[ (1-\gamma )(P_{t}^{\ast })^{1-\varepsilon }+\gamma (P_{t-1})^{1-\varepsilon }\right] ^{\frac{1}{1-\varepsilon }}](img176.gif)
3.2 Government Policy
Government expenditures are composed of: government consumption, which we hold fixed at ![]() and the net interest payments from an exogenously fixed stock of long term government debt,
which we set at
and the net interest payments from an exogenously fixed stock of long term government debt,
which we set at
![]() Revenues consist of of lump sum taxes and the earnings from central bank intermediation net transaction costs. As discussed in section 2.3, central bank asset purchases are
financed by short term government debt. Given the central bank balance sheet (19), we can express the consolidated government budget constraint as:
Revenues consist of of lump sum taxes and the earnings from central bank intermediation net transaction costs. As discussed in section 2.3, central bank asset purchases are
financed by short term government debt. Given the central bank balance sheet (19), we can express the consolidated government budget constraint as:
We suppose monetary policy is characterized by a simple Taylor rule. Let ![]() be the net nominal interest rate,
be the net nominal interest rate, ![]() the steady state nominal rate, and
the steady state nominal rate, and
![]() the natural (flexible price equilibrium) level of output. Then:
the natural (flexible price equilibrium) level of output. Then:
and where
We suppose that the interest rate rule is sufficient to characterize monetary policy in normal times. In a crisis, however, we allow for large scale asset purchases. In particular, we suppose that at the onset of a crisis, which for we define loosely to mean a period where excess returns rise
sharply, the central bank purchases the fraction
![]() of the outstanding stock of private securities and the fraction
of the outstanding stock of private securities and the fraction
![]() of the outstanding stock of long term government bonds:
of the outstanding stock of long term government bonds:
where both
3.3 Resource Constraint and Equilibrium
Output is divided between consumption, investment, government consumption, and expenditures on central bank intermediation ![]() . The economy-wide resource constraint is thus given
by
. The economy-wide resource constraint is thus given
by
![\displaystyle Y_{t}=C_{t}+[1+f\left( \frac{I_{t}}{I_{_{t-1}}}\right) ]I_{t}+G+\Phi _{t}](img193.gif) |
(43) |
with
Finally, to close the model, we require market clearing in markets for private securities, long term government bonds and labor. The supply of private securities at the end of period ![]() is
given by the sum of newly acquired capital
is
given by the sum of newly acquired capital ![]() and leftover capital
and leftover capital
![]()
The supply of long term government bonds is fixed by the government
Finally, the condition that labor demand equals labor supply requires that
where the inverse of the price of intermediate goods
We note that because of Walras' Law, once the market for goods, labor, and long term securities, cleared, the market for riskless short term debt will be cleared automatically. As we discussed, the short term government debt may either be directly held by households or instead by banks who in turn issue deposits to households. In the latter case, one can interpret the debt as interest bearing reserves. This completes the description of the model.
4 Model Analysis
Our goal here is to provide concrete numerical examples to illustrate the qualitative insights about the effects of LSAPs developed in section 2.
4.1 Calibration
Table 1 lists the choice of parameter values for our baseline model. Overall there are twenty parameters. Twelve are conventional. Eight
![]()
![]() ) are specific to our model.15
) are specific to our model.15
We begin with the conventional parameters. For the depreciation rate ![]() the capital share
the capital share ![]() , the elasticity of substitution between goods,
, the elasticity of substitution between goods,
![]() , and the government expenditure share, we choose standard values. For the discount factor
, and the government expenditure share, we choose standard values. For the discount factor ![]() we assign a quarterly value of
we assign a quarterly value of ![]() which implies a steady state short term interest rate of two percent. Following the literature on the zero lower
bound, we choose a low steady state real rate to increase the likelihood that the ZLB is binding in the crisis experiment that we study. For the other conventional parameters we use estimates from Primiceri, Schaumburg and Tambalotti (2006) to obtain values. These parameters include: the habit
parameter
which implies a steady state short term interest rate of two percent. Following the literature on the zero lower
bound, we choose a low steady state real rate to increase the likelihood that the ZLB is binding in the crisis experiment that we study. For the other conventional parameters we use estimates from Primiceri, Schaumburg and Tambalotti (2006) to obtain values. These parameters include: the habit
parameter ![]() ; the inverse elasticity of investment to the price of capital
; the inverse elasticity of investment to the price of capital
![]() the relative utility weight on labor
the relative utility weight on labor ![]() the Frisch elasticity of
labor supply
the Frisch elasticity of
labor supply
![]() ; and the price rigidity parameter,
; and the price rigidity parameter, ![]() Since the policy rule
the authors estimate is somewhat non-standard, we use instead the conventional Taylor rule parameters of 1.5 for the feedback coefficient on inflation,
Since the policy rule
the authors estimate is somewhat non-standard, we use instead the conventional Taylor rule parameters of 1.5 for the feedback coefficient on inflation,
![]() , and 0.5 for the output gap coefficient,
, and 0.5 for the output gap coefficient,
![]() For simplicity, we use minus the price markup as a proxy for the output gap.
For simplicity, we use minus the price markup as a proxy for the output gap.
Our choice of the financial sector parameters is meant to be suggestive. We choose a survival probability
![]() that implies an expected horizon of ten years for bankers. We set
that implies an expected horizon of ten years for bankers. We set
![]() so that in steady state households hold half the quantity of private securities and
so that in steady state households hold half the quantity of private securities and
![]() so that households hold three quarters of the outstanding stock of long term government debt. We choose values for
so that households hold three quarters of the outstanding stock of long term government debt. We choose values for ![]() ,
, ![]() and
and ![]() to hit the following targets; a steady state excess return on government bonds of fifty basis points
to hit the following targets; a steady state excess return on government bonds of fifty basis points![]() a steady state excess return on private securities of one hundred basis points, and a
steady state leverage ratio for banks of six. We base the steady state target for the excess return on bonds on estimates of the term premium by Ludvigson and Ng (2009) using pre-crisis data. For private securities we use information on the pre-2007 spreads between mortgage rates and government
bonds and between BAA corporate vs. government bonds, in conjunction with the evidence on the term premium. The steady state leverage ratio is trickier to calibrate. For investment banks and commercial banks, which were at the center of the crisis, leverage ratios (assets to equity) were
extraordinarily high: typically in the range of fifteen to twenty for the former and eight to ten for the latter. However, everything else equal, our model overstates the risk from asset price fluctuations that banks face since they essentially hold equity claims: In practice creditors share more
of the risk with banks. Accordingly, we compensate by assuming a steady state leverage ratio that is roughly half the average across banking institutions. The reduced leverage ratio dampens the impact of asset price fluctuations on bank net worth. We choose the household portfolio adjustment cost
parameter
a steady state excess return on private securities of one hundred basis points, and a
steady state leverage ratio for banks of six. We base the steady state target for the excess return on bonds on estimates of the term premium by Ludvigson and Ng (2009) using pre-crisis data. For private securities we use information on the pre-2007 spreads between mortgage rates and government
bonds and between BAA corporate vs. government bonds, in conjunction with the evidence on the term premium. The steady state leverage ratio is trickier to calibrate. For investment banks and commercial banks, which were at the center of the crisis, leverage ratios (assets to equity) were
extraordinarily high: typically in the range of fifteen to twenty for the former and eight to ten for the latter. However, everything else equal, our model overstates the risk from asset price fluctuations that banks face since they essentially hold equity claims: In practice creditors share more
of the risk with banks. Accordingly, we compensate by assuming a steady state leverage ratio that is roughly half the average across banking institutions. The reduced leverage ratio dampens the impact of asset price fluctuations on bank net worth. We choose the household portfolio adjustment cost
parameter ![]() so that the model approximates the evidence on the impact of effect of QE2 on both real activity and the ten year bond rate. It will turn out that
so that the model approximates the evidence on the impact of effect of QE2 on both real activity and the ten year bond rate. It will turn out that
![]() reasonably satisfies this requirement. Finally,
reasonably satisfies this requirement. Finally,
![]() is set to have the ratio of the stock of long term government bonds to (steady state) output equal its pre-crisis value of approximately 0.45.
is set to have the ratio of the stock of long term government bonds to (steady state) output equal its pre-crisis value of approximately 0.45.
Finally, to be consistent with the much of the evidence of LSAPs, within our simulations we report the behavior of yields to maturity of ten year bond rates on securities that have equivalent value to the respective infinite horizon claims in the model. In the case of the long term government
bond, we consider a ten year equivalent government debt that has an identical price to the consol in the baseline model, but a slightly different payoff structure: For the first forty quarters it yields a a coupon payment identical to the consol (i.e., unity per period). The quarter after there is
a "principal" payment equal to the nominal steady state price of the consol
![]() where
where ![]() is the steady state nominal interest rate.
The nominal yield to maturity on the ten year government bond
is the steady state nominal interest rate.
The nominal yield to maturity on the ten year government bond
![]() is accordingly
is accordingly
where
4.2 Model Simulations
We begin with several simulations designed to illustrate how LSAPs affect real activity and inflation in our model economy. We start with a basic exercise that compares how similar size purchases of private versus government securities affect the economy. We then compare the government bond purchase program under QE2 to a conventional interest rate policy. That is, we find the interest rate policy that provides roughly equivalent stimulus to the bond purchase program. Next, we analyze how the strength of the impact of LSAPs is affected by whether the zero lower bound is binding. We then explore the implications of household participation in long term securities markets. Finally, we consider a financial crisis within the model that has some of the key features of the one that the global economy had in the late 2008 early 2009. We then explore the effects of asset purchase programs similar in nature to what occurred under QE1.
In Figure 1, the panels report the responses of the model economy to an a LSAP similar in size to QE2. The solid line reports the response to purchases of long term government bonds, as actually occurred under QE2. The dotted lines report the effects of a similar size purchase of private
securities. The purchases were phased in over a roughly six month period and the cumulative total equaled approximately two and a half percent of GDP. By this, we are approximating the size of purchases in terms of '10-year-equivalents' that incorporates their maturity structure.16 Following Chen, Curdia and Ferrero (2011), we suppose that the purchases are kept at the peak for two years and are gradually phased out, though we approximate
this pattern with a second order order autoregressive process. We also follow these authors by appealing to evidence from the Fed Funds futures market which suggested that the Funds rate was likely to remain fixed for a year after the purchases were initiated. Accordingly, in the experiment we keep
the Funds rate fixed for the first four quarters and then let it revert to the Taylor rule described earlier. Finally, we fixed the portfolio adjustment cost parameter ![]() to ensure that
the QE2 experiment produce a reduction in the ten year government bond rate
to ensure that
the QE2 experiment produce a reduction in the ten year government bond rate ![]() of twelve basis points, which is within the range of estimates in Williams (2011) and elsewhere. We then
explore how the rest of the model economy responds to our QE2 simulation before going on to consider a variety of other experiments.
of twelve basis points, which is within the range of estimates in Williams (2011) and elsewhere. We then
explore how the rest of the model economy responds to our QE2 simulation before going on to consider a variety of other experiments.
As the figure shows, the decline in long term rates produces a peak increase in output of one percent, which is closely in line with the time series estimates of Gambacorta, Hoffman, and Peersman (2011). There is also an increase in inflation and asset prices, which is consistent with the event
study evidence for QE2.17 Overall, the response of the standard macroeconomic variable mirrors the response to a conventional monetary policy easing. We
stress, though, that LSAPs work ultimately by reducing excess returns. Underlying the drop in the long term bond rate is a decline in the current and expected sequence of one period excess returns
![]() , as panel 9. in Figure 1. shows. We can isolate the component of the drop in the ten year government bond rate that is due to a decline in excess returns by examining the
spread between
, as panel 9. in Figure 1. shows. We can isolate the component of the drop in the ten year government bond rate that is due to a decline in excess returns by examining the
spread between ![]() and the yield to maturity on the ten year 'risk-free' swap rate
and the yield to maturity on the ten year 'risk-free' swap rate ![]() (i.e. the rate on a security that pays the short rate each quarter for ten years that would be priced by the household if it were allowed to hold it). As the figure indicates, the lion's share of the drop in the ten year government bond rate - roughly ten of the overall
twelve basis point drop - is due to a decline in excess returns.
(i.e. the rate on a security that pays the short rate each quarter for ten years that would be priced by the household if it were allowed to hold it). As the figure indicates, the lion's share of the drop in the ten year government bond rate - roughly ten of the overall
twelve basis point drop - is due to a decline in excess returns.
The LSAP also reduces the yield to maturity on the private security
![]() by nearly double the drop in the rate on government bonds (which can be seen by noting that the spread
by nearly double the drop in the rate on government bonds (which can be seen by noting that the spread
![]() declines ten basis points on impact.)18 The decline in
declines ten basis points on impact.)18 The decline in
![]() is key for the transmission of the LSAP to the real economy. It causes the asset price
is key for the transmission of the LSAP to the real economy. It causes the asset price ![]() to increase, which in turns stimulates investment spending. As discussed in section 2.3,
to increase, which in turns stimulates investment spending. As discussed in section 2.3, ![]() moves proportionately more than
moves proportionately more than
![]() in response to the LSAP because for banks - the marginal traders in the securities markets - agency costs of financing privates securities are proportionately greater than for
government bonds (see equation (22)).
in response to the LSAP because for banks - the marginal traders in the securities markets - agency costs of financing privates securities are proportionately greater than for
government bonds (see equation (22)).
Finally, Figure 1 shows that an equivalent size purchase of the private security has roughly double the effect on long term bond yields and the rest of the economy. This kind of differential effect is consistent with the rough evidence19. As we emphasized in section 2.3, a central bank purchase of the private security relaxes banks' balance sheet constraint proportionately more than a similar size purchase of government bonds, which enhances the market demand for securities. The exact difference depends on the assumption about the strength of the agency friction that inhibits arbitrage in each case. But so long as the friction is greater for private securities than for government bonds, purchases of the former will have stronger effects than of the latter.
Figure 2 identifies the conventional interest policy that provides stimulus equivalent to the government bond LSAP portrayed in Figure 1. In particular we suppose that the central bank reduces the short term interest rate in the first period and then keeps it fixed at this level for a total of four quarters, the length of time it was fixed in the QE2 experiment. Then as in the latter case, we allow the interest rate to revert to the Taylor rule. As the figure shows, the conventional monetary policy that corresponds to our approximation of QE2 is a forty basis point reduction in the short rate for a period of a year.20 Interestingly, this result comes close to the rule of thumb many in the Fed use that a reduction in long rates from monetary stimulus corresponds to a threefold reduction in short rates. It is also interesting to observe from comparing the inflation responses that the inflation generated by the LSAP is nearly identical to that created by the "equivalent" monetary policy. This occurs of course because inflation under the LSAP is ultimately the product of the stimulus provided from interest rate reduction, as is the case with interest rate policy. There is no independent effect of the size of the balance sheet on inflation. Of course, were the central bank to take significant losses on its balance sheet that could only be financed by exorbitant money creation, matters would change. But at least currently, this does not appear to be a danger facing the Fed's balance sheet.
Figure 3 addresses the issue of how the zero lower bound affects the impact of the LSAP. We compare our baseline scenario where short rates are expected to be fixed for a year to one where they adjust immediately. As the figure shows, the immediate adjustment of short rates offsets more than eighty percent of the effect of the LSAP on output. The rise in short rates generated by the Taylor rule is rough thirty basis point for the first year, which as implied by Figure 2 mostly offsets the stimulus from the LSAP. Thus it makes sense to use LSAPs only in situations where short rates are expected to remain fixed for a considerable period of time.
In Figure 4 we illustrate the implications of imperfectly elastic household demands for long term securities. We consider an alternative to our baseline where households only hold short term securities and banks hold the entire stock of long term private securities and government bonds. The impact of LSAPs is clearly weaker in this alternative scenario: The long term bond rate drops only about five basis points as opposed to twelve in the baseline and the increase in output is only about half the baseline case. Intuitively, in the baseline, imperfectly elastic household demands works to "segment" asset markets. In effect, the pool of actively traded securities is reduced: A given change in central purchases then has a greater proportionate effect in the market for actively traded securities, causing asset prices and returns to respond accordingly. This impact of friction in household asset demands on the strength of LSAPs accords well with conventional wisdom. We stress, however, that it is also critical, that the marginal traders, i.e., the banks, also face limits to arbitrage. As we showed in section 2, absent these limits, LSAPs are neutral even with imperfectly elastic household demand.
We now explore how LSAPs work in the context of a financial crisis that has some key features of the one that recently occurred in the wake of the Lehman Brothers collapse. In particular, we use the model to illustrate how an LSAP program with features similar to QE1 may have worked to moderate the downturn. One distinguishing feature of the policy experiments we perform is that the number of periods the zero lower bound binds is endogenous, in contrast to the earlier experiments where the short was held fixed for a given number of periods.
We stress that we are not attempting a complete description of the crisis: The model is too simple for this. We are however able to create a recession where financial intermediation is disrupted in a way that raises the cost of credit, which in turn amplifies the downturn. Further, the downturn is sufficiently sharp to push the economy to the point where the zero lower bound on the nominal interest rate is binding. In this way we capture the two features of the crisis that are most relevant in are view for the role of LSAPs.
The initiating shock for the crisis is a decline in capital quality.21The reduction in the value of bank assets forces a fire sale of bank assets to satisfy the balance sheet constraint. Asset prices decline and excess returns rise, which depresses real activity. The process is amplified as the asset fire sale and decline in real activity further weaken bank balance sheets. We suppose the the shock obeys a first order autoregressive process with coefficient 0.7 (so that it mostly dies out after a year and half). Then to produce a sharp output contraction in the first two quarters (as occurred after the Lehman collapse), we hit the model economy with two consecutive unanticipated negative capital quality shocks: The first is a 3.3% decline and the second is just large enough to offset the mean reversion in the variable for one period.
We also suppose that an LSAP program involving the purchase of the private security is initiated in the wake of the shock. The sequencing of the purchases as well as the overall size at the peak is meant to be similar to QE1. In December 2008 the initial purchase program was announced that was
equal to roughly half the eventual size. The announcement of the second stage of the program came in March 2009. In the meantime a number of temporary complementary measures, including the commercial paper funding facility were set up in 2008 Q4. Accordingly, we assume that the policy is phased in
as a sequence of three unexpected shocks with the first shock accounting for one quarter of the total cumulative effect and the next two the remaining three quarters, divided evenly among each. To capture the cumulative buildup, the shocks obey second order autoregressive processes the with the
first lag coefficient equal to 1.5 and the second equal to ![]() The peak of
the LSAP is six percent of GDP, consistent with the evidence on ten-year equivalent purchases.
The peak of
the LSAP is six percent of GDP, consistent with the evidence on ten-year equivalent purchases.
Figure 5 illustrates the crisis experiment under three different scenarios: (1) no central bank response; (2) an LSAP similar to QE1; (3) an LSAP similar in timing and magnitude to QE1, except that the central bank purchases government bonds instead of the private security. Figure 6 reports how much difference the LSAPs made to the response of the model economy under both scenarios (2) and (3).
Under each case there is a sharp drop in output and an associated increase in credit spreads. The latter serves to propagate the downturn. The "QE1" LSAP moderates the decline substantially. The output drop is roughly three and a half percent lower relative to the case without central bank intervention. The policy works by reducing both interest rate and interest rate spreads by amounts in accord with the evidence. It reduces the long term bond rate roughly thirty basis points for a period of more than two years and reduces the yield on the long term private security by roughly fifty five basis points, also for a sustained period. Underlying this reduction in rates, is a reduction in one period excess returns on both the private security and government bonds.
Substituting long term government bond purchases for private sector purchases weakens the effect of the LSAP by a factor of roughly one third. This differential is smaller than in the "non-crisis" experiments we did earlier. The reason is that the horizon over which the short term interest rate is constant is endogenous in this case, whereas it was fixed earlier. The purchases of private securities shortens the period of time the economy remains at the zero lower bound by a quarter, weakening the overall impact. The overall effect, however, remains stronger than if government bonds were purchased instead.
We stress that the crisis experiment focuses on the immediate period around the Lehman collapse and the QE1 intervention. The model is not set up to capture the duration of the crisis. Factors such an overhang of the housing stock, household indebtedness, and global spillovers of economic distress that have contributed to delaying the recovery are not considered. Thus, one should interpret these exercises as an attempt to tease out the nature and strength of the transmission mechanisms for LSAPs, and not an attempt to provide a complete historical account of the recession.
Finally, as a check on the model, we note that a recent paper by Adrian, Colla and Shin (2012) documents four facts any macroeconomic model of financial crises should have to explain: (1) a disruption in the flow of bank credit; (2) a sharp increase in credit spreads; (3) a rise in open market credit relative to bank credit (i.e., bond financing relative bank loans; and (4) procyclical bank leverage ratios. The authors then conclude that most macro models of financial crises can capture (1) and (2) but not (3) and (4).
Here we demonstrate that our model can account for all four facts. Figure 7 repeats the same experiment as in figure 6, this time portraying the response of the bank versus open market credit flows and the bank leverage ratio. The decline in asset quality produces a sharp contraction in the net worth of banks (see the second panel in the bottom row). The leads to a contraction in bank loans (see the second panel in the middle row) and a rise in the spread between the loan rate and government bond rate (see the third panel in the top row.) Thus, the model captures facts 1 and 2. It also captures fact 3: New bond issues increase as the tightening of bank lending induces firms to substitute to open market credit (see the first panel in the middle row.)
Finally, the model is able to match the cyclical behavior of bank leverage ratios, assuming the leverage ratios from the model simulations are constructed the same way they are in the data. In particular, in the data, bank equity is computed as the difference between assets and liabilities, where assets are measured using "fair value" accounting which in practice is a mixture of book value and market value accounting. Fair value accounting, further, uses market prices when available, but during a liquidity disruption where trade may be disrupted, instead uses a "normal" value, which is effectively a smoothed value. Thus, bank equity as measured in the data is less procyclical than true market values would suggest22. Since leverage is procyclical and measured equity is relatively acyclical, measured bank leverage ratios are thus procyclical. By contrast, equity in the model is in terms of market value, which is highly procyclical, leading to a countercyclical leverage ratio (see the first panel in the third row). However, when bank equity in the model is measured the same way as it is in the data, then the model leverage ratio becomes procyclical, as the first two panels of the bottom row indicate.
5 Concluding Remarks
A popular view of LSAPs - known more broadly as "quantitative easing" - is that they reflect money creation. We instead argue that LSAPs should be seen as central bank intermediation. Just like private intermediaries the Fed has financed its asset purchases with variable interest bearing liabilities and not money per se. The difference of course is that that Fed's liabilities are effectively government debt. Thus the Fed's is able to obtain funds elastically in a way that private intermediaries facing financial market frictions are not. As we have shown, it is because of these limits to arbitrage in private intermediation that LSAPs can be effective. It is also worth emphasizing that effectiveness of LSAPs within our model is not due to the central bank being more efficient at holding assets than the private sector: In fact, we assume the opposite.
While the details of transmission differ, as with conventional monetary policy, LSAPs stimulate the economy by reducing credit costs. Thus, as we have shown, the transmission to real output and inflation is very similar to that occurring under conventional policy. Unlike conventional policy, however, LSAPs are an option when when the zero lower bound is binding. In addition, as we have shown, LSAPs are actually most effective in this situation: Holding constant the size of the purchase and the type of the security, an LSAP leads to a larger reduction in long rates the longer is the horizon over which short term rates are expected not to rise.
The framework we presented was designed to provide a unified way to think about the various LSAP programs that the Fed has pursued over the course of the recent crisis. We think that it may also be useful for analyzing new programs under consideration, as well as some LSAPs pursued by other central banks.
For example, under consideration at the Fed is "sterilized" QE, which basically involves lengthening the maturity of the liabilities issued to fund asset purchases from overnight to up to six months. In addition, investors other than banks can hold these liabilities. With sterilized QE, our interpretation of LSAPs as central bank intermediation if anything becomes more obvious. Again, key to the effectiveness of these types of LSAPs are limits on private intermediaries' ability to fund the same long term securities by issuing liabilities of same (short term) maturity as the central bank.
Finally, though the details differ, the recent long-term refinancing operations (LTROs) undertaken by the ECB have a similar flavor to the LSAPs we have been analyzing. Under the LTROs, the ECB does not directly purchase assets: But it does so indirectly by accepting the assets as collateral for loans to participating banks. In particular, it provides three year variable rate credit to banks for loans collateralized by assets it deems acceptable, including certain government bonds, certain asset-backed securities and even certain types of bank loans. The haircuts on the collateral vary according to the risk class. As with LSAPs, for LTROs to be effective, private intermediaries must be limited in their ability to perform the same type of arbitrage as the central bank. We leave for future research, however, working out the modifications of the model needed to precisely capture LTROs.
| All Domestic Net Assets (Billions $) | Leveraged Domestic Net Assets (Billions $) | Nonleveraged Domestic Net Assets (Billions $) | % Leveraged | % Nonleveraged | |
| Total Mortgages | 14436 | 6170 | 8166 | 43.0% | 57.0% |
| Agency MBS | 3590 | 1567 | 2023 | 43.6% | 56.4% |
| Treasuries and Agency Debt | 4195 | 1325 | 2870 | 31.6% | 68.4% |
| Treasuries | 1876 | 312 | 1563 | 16.7% | 83.3% |
| Households: |
0.995 | Discount Rate |
| Households: |
0.813 | Habit Parameter |
| Households: |
3.482 | Relative utility weight of labor |
| Households: |
0.450 | Steady state Treasury supply |
| Households:
|
0.500 | Proportion of direct capital hodings of HHs |
| Households:
|
0.750 | Proportion of long term Treasury holdings of the HHs |
| Households: |
1.000 | Portfolio adjustment cost |
| Households: |
0.276 | Inverse Frisch elasticity of labor supply |
| Financial Intermediaries: |
0.345 | Fraction of capital that can be diverted |
| Financial Intermediaries: |
0.500 | Proportional advantage in seizure rate of government debt |
| Financial Intermediaries: |
0.0007 | Porportional transfer to the entering bankers |
| Financial Intermediaries: |
0.972 | Survival rate of the bankers |
| Intermediate good firms: |
0.330 | Capital share |
| Intermediate good firms: |
0.025 | Depreciation rate |
| Capital Producing Firms: |
1.728 | Inverse elasticity of net investment to the price of capital |
| Retail Firms: |
4.167 | Elasticity of substitution |
| Retail Firms: |
0.779 | Probability of keeping the price constant |
| Government: |
0.200 | Steady state proportion of government expenditures |
| Government:
|
1.500 | Inflation coefficient in the Taylor rule |
| Government:
|
-0.125 | Markup coefficient in the Taylor rule |
Figure 1: Private and government asset purchase shocks. Purchases are calibrated to a peak effect of 2.5% of GDP and interest rates are kept unchanged for 4 periods
![Figure 1: Private and government asset purchase shocks. Purchases are calibrated to a peak effect of 2.5% of GDP and interest rates are kept unchanged for 4 periods. This figure has twelve panels. Each panel has the same x-axis, labeled Quarters from 0 to 40. Each figure also has two lines, a solid black line and a red-dashed line. The black line represents government bond purchases, the red line represents private asset purchases. The first panel is titled CB Purchases and has a y-axis labeled % of GDP from 0 to 3. The lines track each other exactly, starting at 1.5 at 0, rising to 2.5 briefly around 5 quarters, then falling to 0 by 40. The rest of the panels have a y-axis labeled %change from ss. The second panel is titled Y and the y-axis is bound -1 to 3. The black line starts at 0.5, rises briefly to 1 around q5 before falling back to stay at 0 around q10. The red line follows this same pattern except it rises to 2 before falling back to 0. The third panel is titled pi and the y-axis is bound -1 to 3. The black line starts at 1.5 at q0 and falls to stay around 0 by q15. The red line follows the same pattern but starts from 3 at q0. The fourth panel is titled i and the y-axis is bound -1 to 2. The black line starts at 0 at q0 and is flat until q3 when it spikes suddenly to almost 1 at q4, then drops to stay at 0 at around q10. The red line follows the same pattern, but spikes to almost 2 and falls slightly below zero before converging to zero around q10. The fifth panel is titled R and y-axis bounded -4 to 2. The black line starts at -1 at q0 and rises slightly above zero at q5 before converging to 0 by q15. The red line starts at -2 at q0 and rises to 1 before converging to 0. The sixth panel is titled Q with y-axis bounded -2 to 6. The black line starts at 2 and drops to stay at 0 around q5. The red line starts at 4 and drops to stay at 0 around q5. The seventh panel is labeled N with y-axis bounded -10 to 30. The black line starts at 10 at q0 before settling at 0 at q10. The red line starts at 23 at q0 before settling at 0 at q10. The eigth panel is titled E[R<sub>k</sub>]-R with y-axis bounded -3 to 1. The black line starts at -0.5 at q0 and dips slightly to -1 before rebounding to 0 at q15. The red line follows that but dips a bit more to -2.5 before rebounding. The ninth panel is titled E[R<sub>b</sub>]-R with y-axis bounded -1.5 to 0.5. The black line starts at -0.25 at q0 before dipping slightly to -0.5 at q3 and then rebounds to 0 by q10. The red line follows, but dips slightly more to -1.25 before rebounding. The tenth panel is labeled i<sub>b10</sub> with y-axis bounded -0.4 to 0. The black line increases gradually from -0.1 to zero by q40, with a slight upward blip at q5. The red line follows but starts at -0.2 at q0. The eleventh panel is labeled i<sub>b10</sub> - i<sub>i10</sub> with y-axis bounded -0.2 to 0.2 The black line starts at -0.1 at q0 and increases to stay at 0 in q10. The red line follows, but starts at -0.2 at q0. The twelfth panel is labeled i<sub>k10</sub> - i<sub>b10</sub> with y-axis bounded by -0.2 to 0.2. The black line starts at -0.1 at q0 and increases to stay at 0 in q10. The red line follows, but starts at -0.2 at q0.](fig1.gif)
Figure 2: Monetary and government bond purchase shocks. The government bond purchase stock is calibrated to a peak effect of 2.5% of GDP with interest rates kapt unchaged for 4 periods. The monetary policy shock reduces the nominal interest rate by 40 basis-points below its steady state for 4 periods
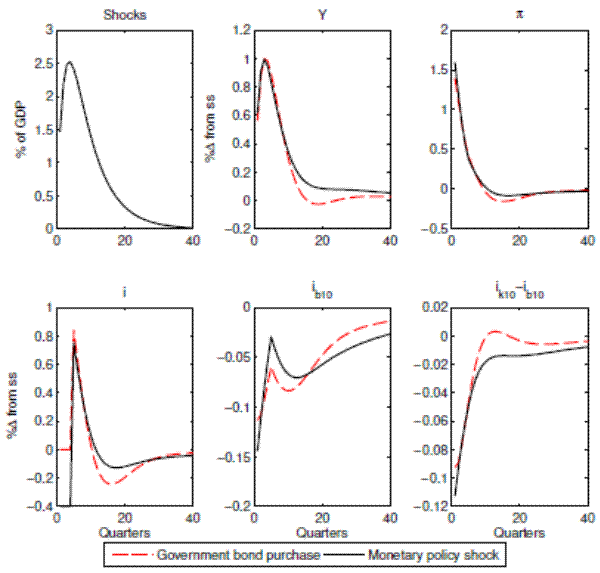
Figure 3: Government bond purchase shocks with and without interest rate responses. The bond policy is calibrated to a peak effect of 2.5% of GDP. The interest rate is kept unchanged for 4 periods
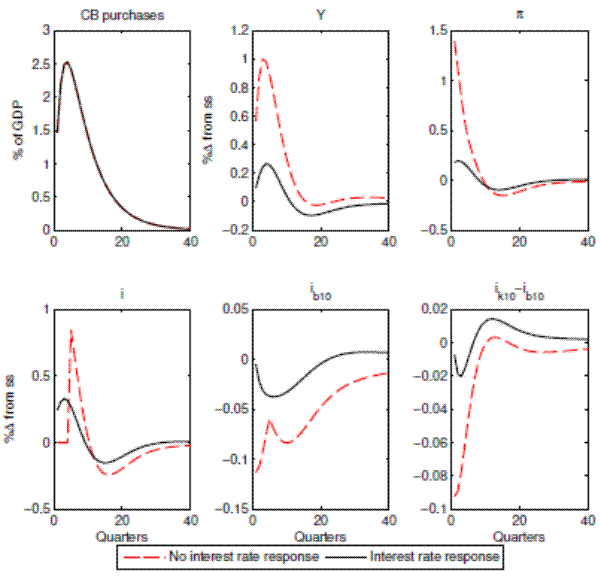
Figure 4: Government bond purchase shocks with and without segmented household asset markets. Purchases are calibrated to a peak effect of 2.5% of GDP. The interest rate is kept unchanged for 4 periods
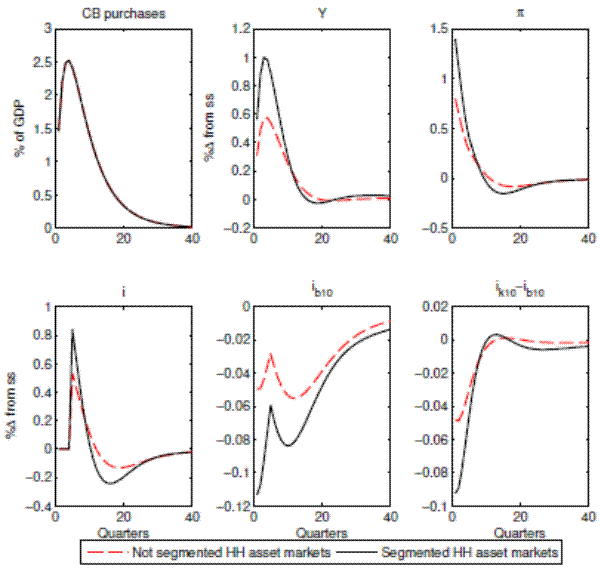
Figure 5: Crisis experiment. Reactions to two consecutive unexpected capital quality shocks with gradual private and government asset purchases with the zero-lower bound
![Figure 5: Crisis experiment. Reactions to two consecutive unexpected capital quality shocks with gradual private and government asset purchases with the zero-lower bound. This figure has 12 panels. Each panel has the same x-axis, labeled Quarters from 0 to 40, and y-axis, labeled %change from ss. Each figure also has three lines, a solid black line, a red dashed line, and a blue dotted line. The black line represents private asset purchases, the red government bond purchases, the blue no policy. All lines track each other unless otherwise noted. The first panel is titled e<sub>Epsilon</sub> with the y-axis bounded -4 to 0. The lines begin at -3.5 in q0, before rising rapidly to 0 by q15. The second panel is titled Y with y-axis bounded -10 to 0. The black line starts at -2.5, dips to -5 by q3, then rises quickly to -2.5 by q10, then slowly converges to -1 by q40. The red line starts at -2.5, dips to -6 by q3, then rises quickly to -2.5 by q10, then slowly converges to -1 by q40. The blue line starts at -5, dips to -8 by q3, then rises quickly to -2.5 by q15, then slowly converges to -1 by q40. The third panel is titled pi with y-axis bounded by -10 to 5. The lines begin around -4, rise to 2 by q10, then decrease to converge to 0 by q40. The fourth panel is titled i with y-axis bounded by -4 to 4. The lines begin at -2 in q0 and rise to 3 by q10, then decrease to converge at 1 by q40. The fifth panel is titled R with y-axis bounded -4 to 4. The red and black lines begin at 0, dip quickly to -2 by q3, then rise to 1 by q10 before decreasing and converging to 0 by q40. The blue line begins at 1 in q0, rises to 3 in q2, dips quickly to -2 by q5, then rises to 1 by 15 before decreasing and converging to 0 by q40. The sixth panel is titled Q with y-axis bounded -20 to 10. The lines begin at -15 and increase to 1 by q5, and then decrease to stay at 0 by q15. The seventh panel is titled N with y-axis bounded by -150 to 0. The lines begin at 100 and dip slightly before rising to -40 by q5. They then dip slightly again before steadily rising to 40 by q40. The eigth panel is titled E[R<sub>k</sub>]-R with y-axis bounded -10 to 20. The lines start at 20 in q0 and decrease to stay at 0 b q10. The ninth panel is titled E[R<sub>b</sub>]-R with y-axis bounded -5 to 10. The lines start at 10 in q0 and decrease to stay at 0 by q10. The tenth panel is titled i<sub>b10</sub> - i<sub>i10</sub> with y-axis bounded 0 to 1. The lines start at .70 in q0, decrease to 0 by q10, bump up to about 0.2 by q15, then decrease slowly to converge to 0.05 by q40. The eleventh panel is titled i<sub>k10</sub> - i<sub>b10</sub> with y-axis bounded 0 to 3. The lines start at 2 in q0 and decrease quickly to 0.5 by q5, then decrease steadily to reach 0 by q40. The twelfth panel is titled Purchases with y-axis bound 0 to 8. The lines start at 1 in q0, increase to 6 by q5, then decrease back to 1 by q20 and converge to 0 by q40.](fig5.gif)
Figure 6: Effects of private and government asset purchases following the crisis experiment. The figures plot the difference from a no-policy-response case
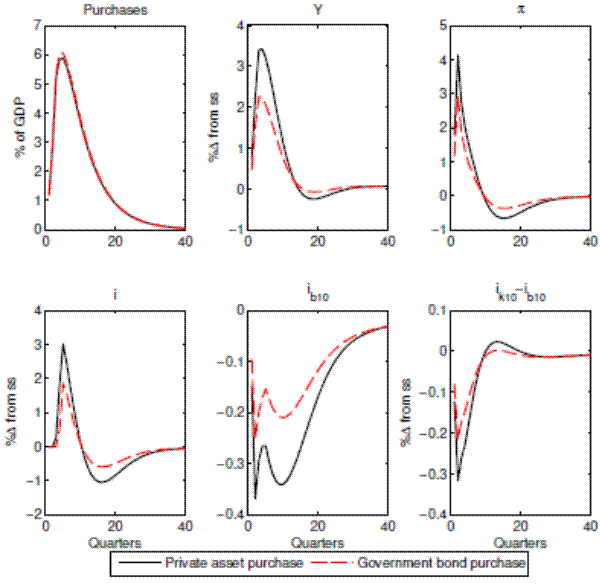
Figure 7: Crisis Experiment with adjusted 'fair' book values and market values
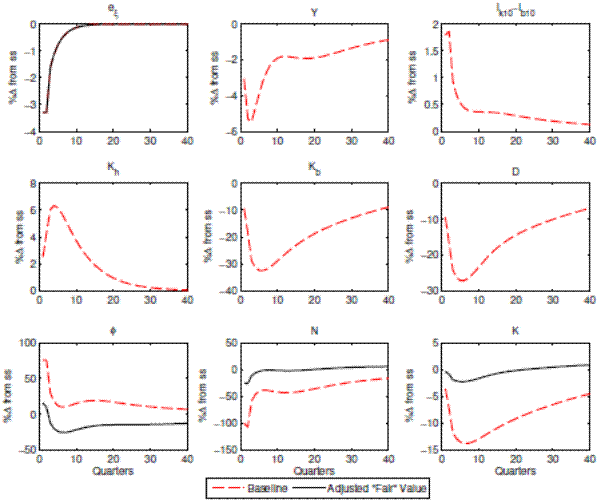 epsilon with y-axis bounded -4 to 0. The lines track each other and start at -3.5 in q0 before rising to 0 by q10. The second panel is titled Y with y-axis bounded -6 to 0. The red line starts at -3 in q0, drops to -5 by q3, rises to -2 by q10, then steadily rises to -1 by q40. The third panel is titled ik10 - ib10 with y-axis bounded 0 to 2. The red line starts at 1.75 before dropping to 0.4 by q5, then steadily decreases to zero by q40. The fourth panel is titled Kh with y-axis bounded 0 to 8. The red line starts at 2 in q0, rises to 6 by q5, then decreases back to 2 by q15 and then converges to 0 by q40. The fifth panel is titled Kb with y-axis bounded -40 to 0. The red line starts at -10 in q0 before dropping to -30 by q5, then steadily rises to -10 by q40. The sixth panel is labeled D, with y-axis bounded -30 to 0. The red line starts at -10 in q0 before dropping to -28 by q5, then steadily increases to -10 by q40. The seventh panel is labeled phi, with y-xis bounded -50 to 100. The black line starts at 10 in q0 before dropping to -25 by q5, then increasing very slowl to -20 by q40. The red line starts at 75 in q0 before dropping to 0 by q5, then blips slightly to 10 by q15 before converging back to 0 by q40. The eigth panel is labeled N, with y-axis bound -150 to 50. The black line starts at -25 and rises to stay at 0 by q5. The red line starts at -100 at q0 and rises to -50 by q5, then steadily rises to -10 by q40. The ninth panel is titled K with y-axis bound -15 to 5. The black line starts at 0 and bows to -2.5 before slowly converging back to 0 by q40. The red line starts at -5 in q0, drops to -15 by q5, then steadily increases to -5 by q40.
" />
epsilon with y-axis bounded -4 to 0. The lines track each other and start at -3.5 in q0 before rising to 0 by q10. The second panel is titled Y with y-axis bounded -6 to 0. The red line starts at -3 in q0, drops to -5 by q3, rises to -2 by q10, then steadily rises to -1 by q40. The third panel is titled ik10 - ib10 with y-axis bounded 0 to 2. The red line starts at 1.75 before dropping to 0.4 by q5, then steadily decreases to zero by q40. The fourth panel is titled Kh with y-axis bounded 0 to 8. The red line starts at 2 in q0, rises to 6 by q5, then decreases back to 2 by q15 and then converges to 0 by q40. The fifth panel is titled Kb with y-axis bounded -40 to 0. The red line starts at -10 in q0 before dropping to -30 by q5, then steadily rises to -10 by q40. The sixth panel is labeled D, with y-axis bounded -30 to 0. The red line starts at -10 in q0 before dropping to -28 by q5, then steadily increases to -10 by q40. The seventh panel is labeled phi, with y-xis bounded -50 to 100. The black line starts at 10 in q0 before dropping to -25 by q5, then increasing very slowl to -20 by q40. The red line starts at 75 in q0 before dropping to 0 by q5, then blips slightly to 10 by q15 before converging back to 0 by q40. The eigth panel is labeled N, with y-axis bound -150 to 50. The black line starts at -25 and rises to stay at 0 by q5. The red line starts at -100 at q0 and rises to -50 by q5, then steadily rises to -10 by q40. The ninth panel is titled K with y-axis bound -15 to 5. The black line starts at 0 and bows to -2.5 before slowly converging back to 0 by q40. The red line starts at -5 in q0, drops to -15 by q5, then steadily increases to -5 by q40.
" />
Footnotes
Last update: February 1, 2013