
Studying Consumption with the Panel Study of Income Dynamics: Comparisons with the Consumer Expenditure Survey and an Application to the Intergenerational Transmission of Well-being
Keywords: Panel Study of Income Dynamics, Consumer Expenditure Survey, Intergenerational Consumption Correlation
Abstract:
Beginning in 1999, the Panel Study of Income Dynamics (PSID) added new questions about several categories of consumption expenditure. The PSID now covers items that constitute more than seventy percent of total expenditure measured in the Consumer Expenditure Survey (CE). We show that expenditure for each of the broad categories in the PSID aligns closely with corresponding measures from the CE. Using the new PSID data, we impute total expenditure in the PSID and show that this is also very close to total measured CE expenditure. For several distinct categories and for total consumption, we show that cross-sectional life cycle estimates of household expenditure activity are very similar across the two surveys. Finally, we illustrate the unique research value of the PSID for studying consumption by exploiting the survey's longitudinal design and genealogical structure to estimate the intergenerational elasticity of consumption expenditure, which is found to be in the range of 0.32-0.34.
I. INTRODUCTION
Consumption is a fundamental concept in economics, figuring prominently in the theoretical literatures of both micro and macroeconomics. Unfortunately, data on consumption have been quite limited. The Consumer Expenditure Survey (CE), which began regular data collection in 1980, is the most widely-used dataset for studying consumption in the U.S. Although many important findings come from analyses of the CE, it was not principally designed for empirical research, but rather as a tool for periodic revision of the Consumer Price Index.
The only other national survey that has consistently collected data on consumption expenditures is the Panel Study of Income Dynamics (PSID).1 Historically, this information was limited to reports about food and housing expenditures. Beginning in 1999, however, the PSID added a series of questions about other expenditures, such as spending on transportation, health care, education, utilities, and child care. Indeed, with the expanded consumption questions, the PSID now covers more than seventy percent of total outlays measured in the CE.
Several PSID design features make it a unique resource for studying particular questions about consumption that cannot be addressed with other surveys. The three most important features are its longitudinal design, the inclusion of parents and siblings of sample respondents, and the extensive array of variables including health, wealth, pensions, income, employment, and family structure.
In this paper, we describe the expanded expenditure data collected in the PSID, outline the questions that have been included in each wave, examine item non-response, and then compare estimates of total expenditures based on the PSID and the CE. We conduct a further assessment of the quality of the PSID expenditure data using the CE as a benchmark. Specifically, we present cross-sectional estimates of life-cycle expenditure patterns - a topic of great interest to economists - from the two surveys. Finally, having demonstrated the quality of the new PSID expenditure data, we illustrate their empirical value by addressing an issue that cannot be addressed with any other U.S. national surveys: the intergenerational transmission of consumption expenditures.
II. THE DATA: PSID AND CE
The Panel Study of Income Dynamics
The PSID began in 1968 with a sample of roughly 5,000 families, including a low-income over-sample. Individuals in these families and their descendants have been followed ever since, with the sample growing to nearly 10,000 by 1997. Then, because of budget constraints, the sample was trimmed to 6,500 families by dropping roughly two-thirds of the low-income over-sample.
The sample has grown since 1997, with 7,822 families completing interviews in the most recent wave, 2003. Because of consistently high response rates of 95-98 percent, and the fact that the sample is replenished through births and marriage, the PSID, when weighted with the family weights, remains representative of the U.S. population (Fitzgerald et al. 1998; Becketti et al. 1988).
Families were interviewed annually from 1968 to 1997, and every other year since 1997. The interview, which averaged 72 minutes in 2003, is completed by telephone for 97 percent of the families and face-to-face for the remaining 3 percent. Expenditures are reported for the family as a whole, where a PSID family is defined as a group of people living together as a family. Family members are generally related by blood, marriage, or adoption, but unrelated persons can be part of the same PSID family unit if they permanently reside together and share both income and expenses.
A unique feature of the PSID is its genealogical design. All family members living in households interviewed in 1968 are followed in future waves. When children left their parents' home or when couples who were married in 1968 separated or divorced, both individuals were followed and continue to be interviewed. In addition, children born to sample members after 1968 inherit the "PSID gene" and are followed as well. As a result, since 1968, interviews have been completed with numerous members of the same extended families, including siblings, parents and adult children, and in some cases grandparents and grandchildren. Therefore, adding questions to even one wave of the PSID allows analyses of the relationship between those variables among various family members.
Table A1 reports the spending questions used in the 2003 wave along with an indication of whether the same or a similar question was asked in earlier waves. As mentioned, the PSID included a few expenditure questions from the start. Most notably, spending on food eaten at home (away from home) has been collected in all but three (four) waves. Housing-related expenditures have been included in many waves, with data on mortgage payments collected in all but six years since 1968. Rental payments for housing and property taxes have been included in most waves as well. Utility payments were collected from 1981 to 1983, dropped for 15 years, and then added back in 1999. Child care spending was asked in each wave since 1988, and in several earlier years.
In 1999, questions on expenditures were expanded. Four questions on out-of-pocket spending for health care were added: hospital and nursing home care, doctor visits, prescription drugs, and insurance premiums.2 Assessments of educational expenses included payments for tuition, books, supplies, and room and board. Transportation-related expenses included vehicle loan and lease payments, vehicle down payments, vehicle insurance payments, gasoline, repairs and maintenance, parking, bus fares, and taxicabs.
The time period over which PSID expenditure data are reported - i.e., weekly, monthly, yearly - varies across spending categories. Table 1 summarizes the item nonresponse rates and time period of reporting in the PSID 2001 wave. Moreover, even when a preferred time period is stated in the question, respondents are usually allowed to report spending over alternative periods if it facilitates recall. For food at home, respondents are asked to report the amount they currently spend in an average week, although they are allowed to report annual or monthly amounts. Because the question stem states "average week," 89 percent of respondents report a weekly amount (Table 1). Spending on food delivered and food away from home are asked right after the question about food at home, but the stem does not suggest that the report be for an average week. As a result, a smaller share of families reports these categories in weekly amounts: 49 and 68 percent, respectively.
Education and child care spending are reported on an annual basis for the previous calendar year (i.e., in the 2003 interview, respondents report spending for calendar year 2002), while health care spending is reported for the previous two calendar years combined. Most housing and transportation expenses refer to current spending, and are typically reported for an average month. Home and vehicle insurance and property taxes are the exception, with respondents asked to report annual spending because these payments are not typically made on a monthly basis.
Item non-response is low in the PSID (Table 1). In most categories, less than 2 percent of families did not report a valid response to a given spending question. Non-response was highest for insurance payments - both housing and health - at 7-8 percent. For food, the most extensively studied expenditure item, 1.8 percent had invalid responses for food at home, while 1.2 percent had invalid responses for food eaten away from home.3
The Consumer Expenditure Survey
The CE consists of two surveys - the quarterly interview survey (IS) and the diary survey (DS) - that provide data on the buying habits of consumers, including expenditures, income, and basic demographic characteristics. (see U.S. Department of Labor, 2003a, for a detailed description.) The DS collects information on all spending in each day for two consecutive one-week periods, focusing on frequently purchased items such as food, tobacco, and personal care products. The IS, conducted in person, consists of five interviews three months apart; the key expenditure data are collected in the last four interviews, covering a 12 month period. In both the DS and IS expenditures are reported for the "consumer unit."4 The sample frame includes the non-institutionalized population, which is comparable to the PSID.
In this paper, we compare the PSID with the IS. Since the first quarter of 1999, the IS has interviewed 7,000 to 8,000 households each quarter, with respondents reporting spending during the previous 3 months. The IS measures 578 separate categories at the Universal Classification Code (UCC) level, covering an estimated 95 percent of total spending, with spending on nonprescription drugs, household supplies, and personal care items excluded (U.S. Department of Labor, 2003b). The response (CU cooperation) rate in the CE was 80 percent in 2000 (U.S. Department of Labor, 2003b, page 247).
The focus of this paper is on comparing expenditures, not consumption. Therefore, expenditures on durables are not converted into flows of services received. Note, however, that the conventional method for imputing consumption is to apply a linear transformation to the stock of durable goods. Although durable good stocks are not the focus of either the PSID or CE, if expenditure outlays on durables are similar across the two surveys, it is likely that the stock of durables and the flows of services would be similar across surveys as well, were those stocks measured.
III. A COMPARISON OF EXPENDITURES IN THE PSID AND CE
To conduct our comparison, we annualized all reported consumption expenditures in both the PSID and the CE. For the PSID, if an amount is reported for a time period of less than one year, we inflate it by the inverse of the fraction of the year for which the report covers. If the report is for more than one year, we deflate the amount assuming that spending was uniform across the period. For the CE, we follow the procedures provided by the BLS to calculate the weighted mean across interviews.5
There are many reasonable alternative approaches for imputing values for families with item non-response. However, given the PSID's low rate of non-response, estimates of spending are relatively insensitive to the imputation strategy. Table 2 reports average PSID spending for each category when the missing data are dropped (implicitly assuming that spending for families with item non-response is equal to the average among families who responded), and when the missing data are imputed using a model that includes a third-order polynomial in age, and an unrestricted spline for family size. The imputation models were fit separately for each expenditure category listed in Table 2 using ordinary least squares.
Because the CE measures far more detailed spending categories than the PSID, the CE categories, i.e., UCC codes, were mapped into the PSID categories. The mapping is provided in Table A2. The cross-walk was determined by having two coders independently map the UCC codes into the PSID categories. Differences were reconciled through close inspection of each UCC.
Average spending for the PSID and the CE in 2001 - for each PSID category - is reported in the first columns of Table 3; subsequent columns report comparisons for 1999 and 2003. Estimates for specific subcategories disagree significantly in some cases, most likely due in part to respondent misallocation of spending into narrowly-defined categories. These discrepancies aside, total spending in each major category aligns fairly closely across the two surveys, especially considering differences in survey design. For example in 2001 (column 5, Table 3) comparing the PSID to the CE, total spending on food is 8 percent higher, total housing aligns exactly, and total transportation spending is 6 percent lower. These three categories account for 86 percent of spending measured in the PSID. The gap is larger for health care spending, education, and child care, with the PSID finding higher amounts in each case. Combining all PSID categories, annual spending totals $25,961, 2 percent greater than CE spending for these categories. Estimates for 1999 and 2003 are fairly similar, with the PSID 4 percent lower in 1999 and 1 percent higher in 2003.
The PSID spending categories total $25,375 as measured by the CE, which accounts for 72 percent of total spending measured across all CE categories, including those not collected in the PSID (not shown in tables). This 28 percent spending gap falls largely into five categories: home repairs and maintenance ($1,200 in the 2001 CE), household furnishing and equipment ($1,400), clothing and apparel ($1,300), trips and vacations ($1,300), and recreation and entertainment ($1,200). To capture spending on these items, questions were added to the 2005 wave of the PSID, with the goal of having the PSID obtain a nearly comprehensive measurement of expenditures from 2005 onwards.
Life-Cycle Expenditure Profiles
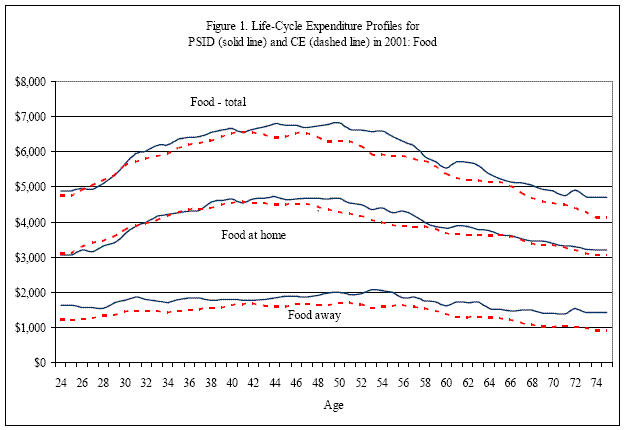
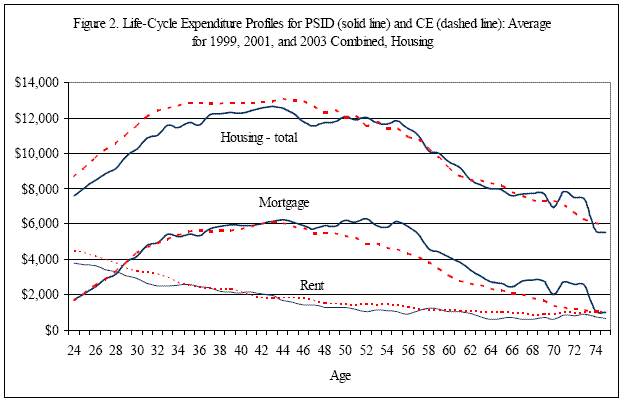
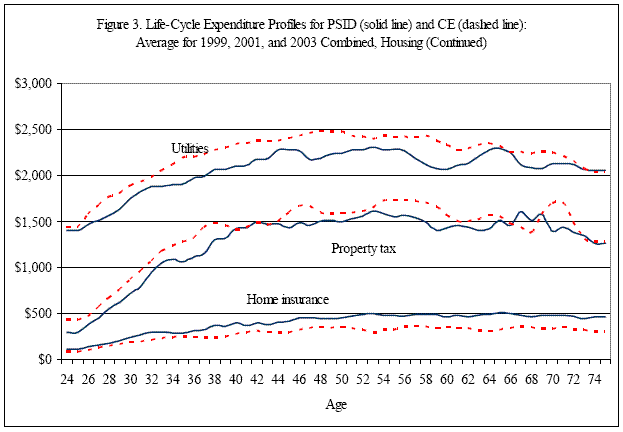
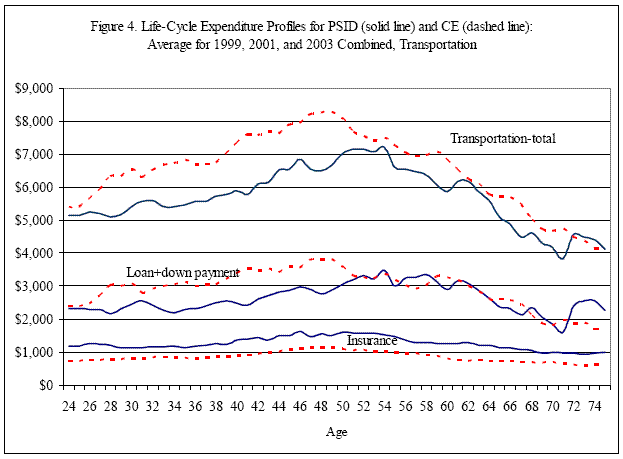
Figures 1 through 8 display the cross sectional life-cycle expenditure profiles from the two surveys. The figures plot, for each data source, expenditures for each major category and for overall total expenditures by the age of the family head. The three-age-group moving average for each single year of age (e.g., 25-27 years old, 26-28 years old, 27-29 years old, etc.) is calculated for each year (1999, 2001, and 2003), and then averaged across the years. We do not control here for any household characteristics (e.g. gender of head, family size, etc.), so the profiles represent how, at a point in time, consumption differs at different points in the life cycle, and thus reflect changes over the lifecycle in household size, composition, and all other factors. Sample weights are used in these figures.
The profiles from the PSID and CE are quite similar across most categories. Food spending is about $5,000 per year in the late twenties, increases through the late 40s, and then falls throughout the rest of the life-course. These cross-sectional patterns for food consumption are comparable to the longitudinal results of Fisher and Johnson (2006), who use the panel design of the PSID to follow the same cohorts over a five-year period.
The life-cycle profiles for rent are nearly identical in the PSID and CE. Mortgage payments and home insurance are higher in the PSID, while utilities and property taxes are somewhat higher in the CE. Altogether, housing expenditures increase through the late thirties or early forties, and then begin a rapid decline after the mid-fifties, with consistent patterns in the two surveys.
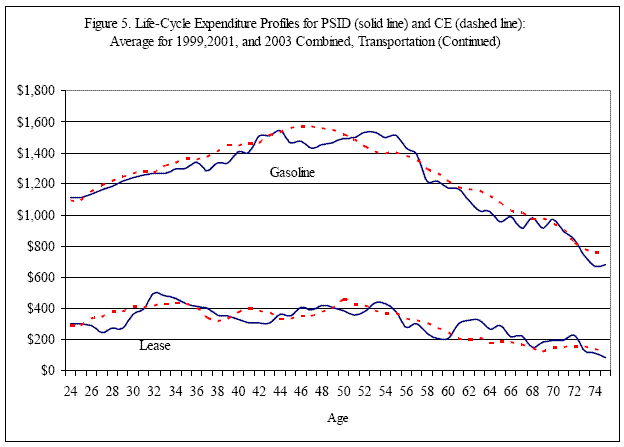
Transportation expenditures are higher in the CE than the PSID for persons in their thirties and forties. However, both data sets show increases through the late forties or early fifties, followed by significant reductions that are likely due to retirement. Gasoline and car lease payments are quite similar in the two surveys; the gap in the younger age range is due to the somewhat higher estimates in the CE of loan and down payments. Despite the differences across surveys in spending levels, the life-cycle paths are similar.
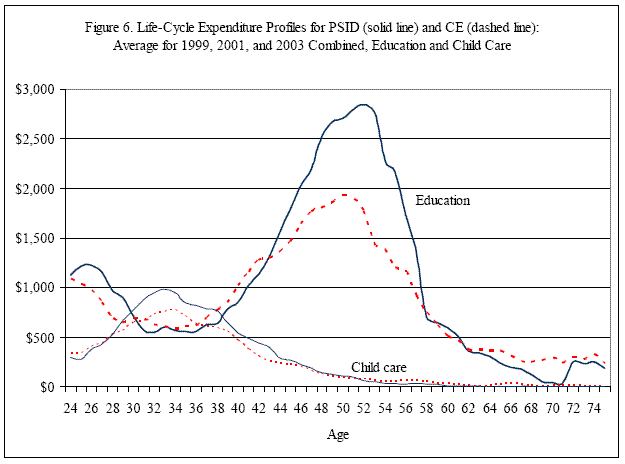
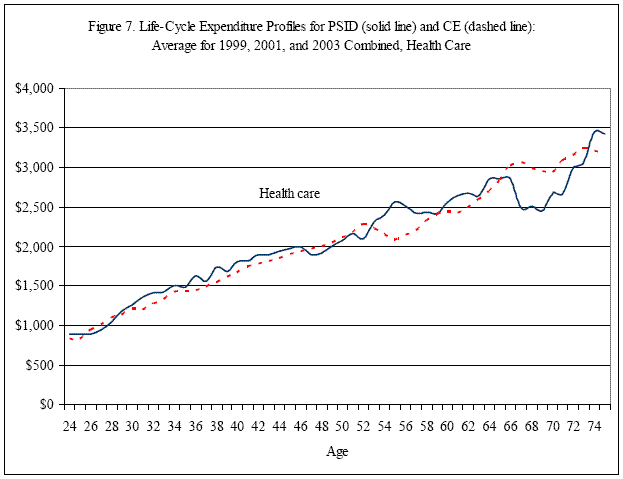
Child care expenditures are the highest in the late twenties and early thirties, the peak childbearing years, and this is reflected in both data sets. Out-of-pocket health care spending follows the expected pattern of ever-increasing outlays, with very similar levels and profiles in the two surveys. Families headed by people in their seventies have roughly three times the amount of out of-pocket medical spending as families headed by people in their twenties.
Both surveys display a bi-modal pattern of educational expenditures, peaking in the mid-twenties - presumably due to spending on one's own education - and again in the late forties and early fifties - presumably due to spending on the higher education of one's children. However, PSID spending at older ages is roughly twice as large as in the CE, representing as much as a $1,000 difference. This divergence is smaller in 1999 and 2003 than 2001 but is still substantial. In the CE, children living away at school are not considered part of the household's consumer unit (CU). We explored how the difference across the surveys is affected by coding reported cash sent to these children as educational expenditure, and find that the gap across the surveys is essentially unaffected. This is not too surprising as payments made directly to educational institutions by parents are included in the CE as educational spending.
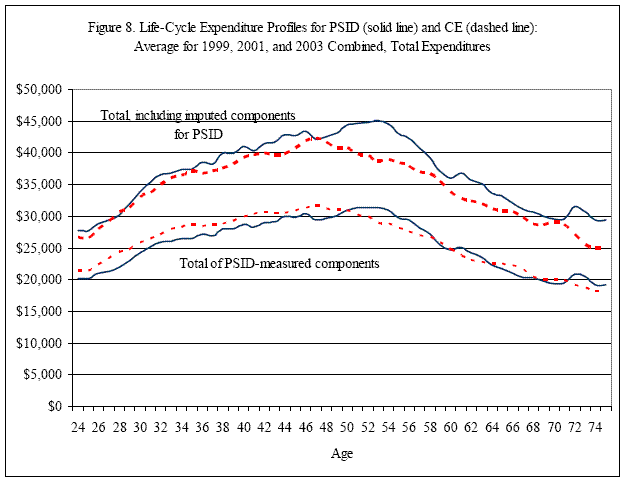
Comparing total spending on all categories measured in the PSID, the life-cycle expenditure profiles in the two data sets are quite similar (Figure 8). The lower profiles show spending in the categories measured in PSID rising through the late forties or early fifties and then falling almost monotonically throughout the rest of the life-cycle. The one period where the patterns for the two data sources diverge somewhat is in the early fifties, and this is almost entirely due to the gap in education expenditures at these ages.
The upper profiles display total spending measured in the CE, including categories not measured in the PSID. Similar to the approach used by Fisher and Johnson (2006) and Skinner (1987) to impute consumption, we impute total PSID expenditure from a regression model estimated with CE data where explanatory variables include expenditures in each category measured in the PSID. The R-squared from the imputation model was 0.88. The estimates from the model are reported in Table A3.
The profiles imply spending of roughly $30,000 per year in the late twenties, increasing to $42,000-45,000 in the mid-forties. Other than the increase in the early fifties in the PSID, spending falls thereafter, so that by the early seventies spending is equal to the level experienced by families headed by people in their late twenties. In general, the profiles are similar in the PSID and CE, with somewhat higher estimates for PSID. This result is consistent with that of Fisher and Johnson (2006) who use a different imputation strategy and examine consumption and not expenditures.
IV. INTERGENERATIONAL TRANSMISSION OF EXPENDITURES
Our results suggest that, with the addition of the new questions in 1999, the PSID does a very reasonable job of measuring household expenditure, when assessed against the standard of the CE. In this section, we illustrate the value of the PSID by providing estimates for a substantive question that cannot be addressed using the CE or any other national survey.
Researchers have used the PSID's genealogical design to examine the intergenerational transmission of economic status. For both income (Solon, 1992; Zimmerman, 1992) and wealth (Charles and Hurst, 2003), intergenerational correlations are roughly 0.35 to 0.40. Here we exploit the design to estimate the intergenerational correlation in expenditure. Expenditures are arguably a better indicator than income of permanent well-being, and therefore, one may expect the correlation to be higher than the income correlation. Spending choices are also useful to examine in their own right, as they are likely to be determined by the transmission of income as well as preferences, from parents to children.
Following the approach used in the literature on income and wealth, we estimate a model with the log of adult children's consumption expenditure (![]() as the dependent variable, and the log
of parental consumption expenditure (
as the dependent variable, and the log
of parental consumption expenditure (![]() as the key covariate. The regression includes controls for the age and marital status of the parent and age and marital status of the child, the
number of co-resident family members for the child's household and for the parent's household (specified as dummy variables for 1, 2, 3, 4, and 5 or more family members, respectively), and the gender of child. For children whose parents are both alive and divorced, we used the father's data, but
controlled for whether the parents are alive and divorced in the model. The estimating regression is thus:
as the key covariate. The regression includes controls for the age and marital status of the parent and age and marital status of the child, the
number of co-resident family members for the child's household and for the parent's household (specified as dummy variables for 1, 2, 3, 4, and 5 or more family members, respectively), and the gender of child. For children whose parents are both alive and divorced, we used the father's data, but
controlled for whether the parents are alive and divorced in the model. The estimating regression is thus:
where
Estimates are calculated for two measures: total spending measured in the 1999, 2001, and 2003 PSID (![]() , and total spending that includes the amount imputed because it is not
assessed in the PSID (
, and total spending that includes the amount imputed because it is not
assessed in the PSID (![]() . Table 4 reports estimates for the former, but estimates of the latter are very similar (available on request).
. Table 4 reports estimates for the former, but estimates of the latter are very similar (available on request).
The literature on the estimation of intergenerational correlations suggests that estimates of the relevant parameter,![]() , might be biased downwards because of measurement error and
transitory factors (Solon, 1992). To address that concern, we also estimate regressions in which parental expenditure,
, might be biased downwards because of measurement error and
transitory factors (Solon, 1992). To address that concern, we also estimate regressions in which parental expenditure, ![]() , is measured as the average over three waves (1999, 2001, and
2003).
, is measured as the average over three waves (1999, 2001, and
2003).
The intergenerational elasticity in ![]() for a single year ranges from 0.25 to 0.27, which is similar to the single-year elasticity in earnings (Solon, 1992). Averaging over multiple
years increases the correlation to 0.32 to 0.34, or as much as nine percentage points, which is similar in magnitude to the increase in intergenerational correlation in earnings when averaging is used (Solon, 1992).6
for a single year ranges from 0.25 to 0.27, which is similar to the single-year elasticity in earnings (Solon, 1992). Averaging over multiple
years increases the correlation to 0.32 to 0.34, or as much as nine percentage points, which is similar in magnitude to the increase in intergenerational correlation in earnings when averaging is used (Solon, 1992).6![]() 7
7
An alternative approach is to estimate the probability that adult children fall into various percentiles in the expenditure distribution among adult children given one's parent's place in the parental consumption distribution. For the sample of children and parents in each year, spending is regressed on age (specified as a cubic) and family size (specified as dummy variables as in equation 1). The residuals from this regression are ranked and children are identified as falling into one of the age- and family-size adjusted spending quartiles among adult children. The same procedure is conducted to find the parent's place within the parental spending distribution. A cross-tabulation of the quartiles in which children belong and the quartile in which the parent belongs provides estimates of quartile-specific mobility.
Results are presented in Table 5, where the residuals for the three years are first averaged for each family and then ranked. Among children whose parents are in the top quartile, 42.6 percent are themselves in the top quartile. At the other end of the distribution, among children whose parents are in the lowest quartile, 36.3 percent are themselves in the lowest quartile. Furthermore, the degree of upward and downward mobility is similar; while 15.4 percent of children with the lowest-spending parents are in the highest quartile, 10.7 percent of the children with the highest-spending parents are in the lowest quartile. In sum, it is unlikely that the position in the consumption distribution of a family in one generation will depart dramatically from what prevailed for that family in the preceding generation. The likelihood that families move across generations from the highest to the lowest levels of consumption is especially low.
V. SUMMARY AND DISCUSSION
We have demonstrated that estimates of expenditures in most broad categories align closely in the PSID and CE despite substantial differences in their instruments and design features. We also found that cross-sectional life-cycle consumption profiles are similar in the two surveys, both for total consumption and most of its major components. Because the PSID expanded the set of consumption expenditure questions in 1999, it now provides a fairly accurate picture of most household consumption expenditure and is thus an even more useful resource for studying consumption. For example, combined with the PSID's detailed income data, estimates of the effect of income on expenditures can now be derived for a variety of expenditure categories. If the additional questions introduced in the 2005 wave are as successful, future waves will contain a nearly complete assessment of total expenditures. Given the PSID's unique design features, several new areas of scientific exploration can be addressed using these data.
Although the PSID can be used to study questions that cannot be addressed with other data sources, such as intergenerational consumption patterns, the PSID cannot replace the CE, which has far greater detail on expenditures. Moreover, the CE collects data on a continuous quarterly basis, allowing more accurate assessment of year-to-year changes in expenditures. Finally, because the CE has collected comprehensive expenditure data for over two decades, long-term trends can only be analyzed with the CE.
To illustrate the unique promise of the new PSID expenditure data, we estimate the magnitude of the intergenerational elasticity in consumption expenditure and find it to be 0.32-0.34. This estimate is of comparable magnitude to estimates for intergenerational elasticities in wealth of 0.37 (Charles and Hurst, 2003) and income of 0.40 (Solon, 1992). With the richer set of expenditure data, analyses such as Mulligan (1997), which attempt to understand the relationship between the intergenerational transmission in earnings, income, wealth, consumption, and even health can be more fully explored.
REFERENCES
| Expenditure category | Percent of families with valid response | Are unfolding brackets used? | Time period of reported spending: Weekly | Time period of reported spending: Biweekly | Time period of reported spending: Monthly | Time period of reported spending: Annually | Time period of reported spending: Other |
|---|---|---|---|---|---|---|---|
| Food: At home | 98.24 | No | 88.55 | 2.55 | 8.69 | 0.21 | 0.00 |
| Food: Away from home | 98.81 | No | 68.09 | 2.51 | 27.85 | 1.55 | 0.00 |
| Food: Delivered | 99.88 | No | 49.38 | 6.69 | 40.43 | 3.50 | 0.00 |
| Housing: Mortgage | 99.27 | No | Monthly payment | Monthly payment | Monthly payment | Monthly payment | Monthly payment |
| Housing: Rent | 99.07 | No | 0.28 | 0.12 | 99.47 | 0.12 | 0.00 |
| Housing: Insurance | 92.11 | No | Total yearly payment | Total yearly payment | Total yearly payment | Total yearly payment | Total yearly payment |
| Housing: Property tax | 94.22 | No | Total yearly payment | Total yearly payment | Total yearly payment | Total yearly payment | Total yearly payment |
| Housing: Electricity | 96.31 | No | 0.00 | 0.00 | 99.40 | 0.55 | 0.05 |
| Housing: Heat | 95.36 | No | 0.00 | 0.00 | 91.88 | 8.03 | 0.07 |
| Housing: Water | 95.68 | No | 0.00 | 0.00 | 87.42 | 12.36 | 0.21 |
| Housing: Other utility | 99.83 | No | 0.00 | 0.00 | 96.35 | 3.36 | 0.12 |
| Transportation: Loan payment | 97.84 | No | 0.05 | 0.11 | 96.88 | 0.32 | 2.64 |
| Transportation: Down payment | 97.07 | No | Previous calendar year* | Previous calendar year* | Previous calendar year* | Previous calendar year* | Previous calendar year* |
| Transportation: Lease payment | 99.82 | No | 0.00 | 0.00 | 98.75 | 0.00 | 1.25 |
| Transportation: Insurance | 92.78 | No | 0.00 | 0.00 | 22.46 | 73.41 | 4.13 |
| Transportation: Gasoline | 98.08 | No | Last month | Last month | Last month | Last month | Last month |
| Transportation: Repairs | 99.00 | No | Last month | Last month | Last month | Last month | Last month |
| Transportation: Other vehicle expenses | 99.08 | No | Last month | Last month | Last month | Last month | Last month |
| Transportation: Parking | 99.57 | No | Last month | Last month | Last month | Last month | Last month |
| Transportation: Bus & train | 99.69 | No | Last month | Last month | Last month | Last month | Last month |
| Transportation: Taxicab | 99.69 | No | Last month | Last month | Last month | Last month | Last month |
| Transportation: Other transportation | 99.74 | No | Last month | Last month | Last month | Last month | Last month |
| Transportation:Education | 99.41 | No | Previous calendar year | Previous calendar year | Previous calendar year | Previous calendar year | Previous calendar year |
| Transportation:Child care | 99.64 | No | Previous calendar year | Previous calendar year | Previous calendar year | Previous calendar year | Previous calendar year |
| Health Care: Hospital and nursing home | 99.69 | Yes | Previous two calendar years combined | Previous two calendar years combined | Previous two calendar years combined | Previous two calendar years combined | Previous two calendar years combined |
| Health Care: Doctor | 99.46 | Yes | Previous two calendar years combined | Previous two calendar years combined | Previous two calendar years combined | Previous two calendar years combined | Previous two calendar years combined |
| Health Care: Rx, in-home med. care, special facilities | 99.51 | Yes | Previous two calendar years combined | Previous two calendar years combined | Previous two calendar years combined | Previous two calendar years combined | Previous two calendar years combined |
| Health Care: Insurance | 91.41 | Yes | Previous two calendar years combined | Previous two calendar years combined | Previous two calendar years combined | Previous two calendar years combined | Previous two calendar years combined |
Weights are not used to calculate values in this table.
*Survey asks about down payments in the previous two calendar years, but one can identify the date of each down payment to determine the amount in the previous calendar year.
| Category | Before Imputation - Number of families with valid responses | Before Imputation - Percent of families with spending>0 | Before Imputation - Unconditional mean | After Imputation - Number of families | After Imputation - Unconditional mean | After Imputation - Unconditional mean after trimming top 1% |
|---|---|---|---|---|---|---|
| Food - total | 7228 | 98.8 | 5936 | 7406 | 5899 | 5724 |
| Food - At home | 7276 | 97.1 | 3990 | 7406 | 3969 | 3881 |
| Food - Away from home | 7318 | 89.9 | 1829 | 7406 | 1825 | 1770 |
| Food - Delivered | 7397 | 13.1 | 105 | 7406 | 105 | 81 |
| Housing - total | 5841 | 100.0 | 10783 | 7406 | 10471 | 9777 |
| Housing - Mortgage | 6543 | 42.2 | 4493 | 7406 | 4737 | 4153 |
| Housing - Rent | 7337 | 33.9 | 2006 | 7406 | 2014 | 1789 |
| Housing - Insurance | 6822 | 54.5 | 363 | 7406 | 376 | 344 |
| Housing - Property tax | 6977 | 56.1 | 1210 | 7406 | 1224 | 1107 |
| Housing - Utilities* | 6867 | 92.8 | 2128 | 7406 | 2120 | 2048 |
| Transportation - total | 6496 | 84.0 | 5892 | 7406 | 5921 | 5471 |
| Transportation - Loan payment | 7246 | 27.7 | 1188 | 7406 | 1192 | 1072 |
| Transportation - Down payment* | 7219 | 19.8 | 1363 | 7406 | 1367 | 996 |
| Transportation - Lease payment* | 7365 | 5.4 | 393 | 7406 | 392 | 256 |
| Transportation - Insurance | 6871 | 83.5 | 1163 | 7406 | 1158 | 1073 |
| Transportation - Gasoline | 7264 | 84.6 | 1343 | 7406 | 1342 | 1259 |
| Transportation - Repairs | 7332 | 40.5 | 110 | 7406 | 110 | 90 |
| Transportation - Other vehicle expenses | 7338 | 24.1 | 97 | 7406 | 97 | 84 |
| Transportation - Parking | 7374 | 6.2 | 46 | 7406 | 46 | 24 |
| Transportation - Bus & train | 7383 | 4.7 | 42 | 7406 | 42 | 18 |
| Transportation - Taxicab | 7383 | 2.4 | 15 | 7406 | 15 | 4 |
| Transportation - Other transportation | 7387 | 3.1 | 160 | 7406 | 160 | 46 |
| Education | 7362 | 32.9 | 1199 | 7406 | 1199 | 831 |
| Child care | 7379 | 14.9 | 341 | 7406 | 342 | 234 |
| Health care - total | 6746 | 88.4 | 2100 | 7406 | 2129 | 1873 |
| Health care - Hospital and nursing home | 7383 | 27.2 | 310 | 7406 | 311 | 147 |
| Health care - Doctor | 7366 | 68.7 | 427 | 7406 | 426 | 351 |
| Health care - Prescriptions, in-home med. care, special facilities | 7370 | 74.2 | 338 | 7406 | 339 | 272 |
| Health care - Insurance | 6770 | 63.6 | 1056 | 7406 | 1052 | 974 |
PSID family weights are used to calculate means and percents.
*For utilities, vehicle down payments, and lease, the proportion with valid responses reported in Table 1 multipled by the sample size (7406) does not equal the number of families with valid responses reported above. For utilities, if any individual component does not have a valid response, total utilities is counted as not having a valid response. For vehicles, some households can have multiple cars. In Table 1, if the family reports one valid car downpay, it is counted as valid.
In Table 2, the sum of all car downpays is reported, and if any car downpay is invalid, the sum is invalid. The same is true of lease payments.
| Category | 2001 PSID: Unconditional mean | 2001 PSID: Percent of total expenditures | 2001 CE: Unconditional mean | 2001 CE: Percent of total expenditures | Ratio of means: PSID/CE | 1999 Unconditional Mean: PSID | 1999 Ratio of means: PSID/CE | 2003 Unconditional Mean: PSID | 2003 Ratio of means: PSID/CE |
|---|---|---|---|---|---|---|---|---|---|
| Food - At home | 3969 | 15.3% | 3817 | 15.0% | 1.04 | 3735 | 1.04 | 4070 | 1.06 |
| Food - Away from home | 1825 | 7.0% | 1339 | 5.3% | 1.36 | 1575 | 1.16 | 1858 | 1.35 |
| Food - Delivered | 105 | 0.4% | NA | NA | NA | 87 | NA | 130 | NA |
| Food - Alcohol | NA | NA | 326 | 1.3% | NA | NA | NA | NA | NA |
| Food - Total food | 5899 | 22.7% | 5482 | 21.6% | 1.08 | 5397 | 1.03 | 6058 | 1.10 |
| Housing - Mortgage | 4737 | 18.2% | 3737 | 14.7% | 1.27 | 3773 | 1.10 | 4762 | 1.17 |
| Housing - Rent | 2014 | 7.8% | 2096 | 8.3% | 0.96 | 1918 | 0.96 | 2053 | 0.96 |
| Housing - Insurance | 376 | 1.4% | 256 | 1.0% | 1.47 | 334 | 1.40 | 447 | 1.51 |
| Housing - Property tax | 1224 | 4.7% | 1291 | 5.1% | 0.95 | 1046 | 0.87 | 1331 | 0.95 |
| Housing - Utility | 2120 | 8.2% | 2206 | 8.7% | 0.96 | 1860 | 1.02 | 2171 | 0.95 |
| Housing - Telephone | NA | NA | 896 | 3.5% | NA | NA | NA | NA | NA |
| Housing - Total housing | 10471 | 40.3% | 10482 | 41.3% | 1.00 | 8931 | 0.94 | 10764 | 0.97 |
| Transportation - Loan payment | 1192 | 4.6% | 1533 | 6.0% | 0.78 | 1071 | 0.76 | 1403 | 0.79 |
| Transportation - Down payment | 1367 | 5.3% | 1230 | 4.8% | 1.11 | 1186 | 0.98 | 1237 | 0.94 |
| Transportation - Lease payment | 392 | 1.5% | 340 | 1.3% | 1.15 | 291 | 0.96 | 227 | 0.96 |
| Transportation - Insurance | 1158 | 4.5% | 819 | 3.2% | 1.41 | 1085 | 1.13 | 1475 | 1.63 |
| Transportation - Gasoline | 1342 | 5.2% | 1268 | 5.0% | 1.06 | 979 | 0.94 | 1315 | 1.00 |
| Transportation - Repairs | 110 | 0.4% | 631 | 2.5% | 0.17 | 89 | 0.14 | 100 | 0.17 |
| Transportation - Other vehicle expenses | 97 | 0.4% | NA | NA | NA | 95 | NA | 103 | NA |
| Transportation - Parking | 46 | 0.2% | 28 | 0.1% | 1.64 | 34 | 1.36 | 43 | 1.54 |
| Transportation - Bus & train | 42 | 0.2% | 98 | 0.4% | 0.43 | 35 | 0.38 | 58 | 0.70 |
| Transportation - Taxicab | 15 | 0.1% | 17 | 0.1% | 0.88 | 11 | 0.65 | 24 | 1.50 |
| Transportation - Other transportation | 160 | 0.6% | NA | NA | NA | 118 | NA | 163 | NA |
| Transportation - Public transportation | NA | NA | 322 | 1.3% | NA | NA | NA | NA | |
| Transportation - Total transportation | 5921 | 22.8% | 6286 | 24.8% | 0.94 | 4994 | 0.86 | 6148 | 0.93 |
| Education | 1199 | 4.6% | 914 | 3.6% | 1.31 | 1030 | 1.16 | 1217 | 1.13 |
| Child Care | 342 | 1.3% | 273 | 1.1% | 1.25 | 274 | 1.21 | 346 | 1.26 |
| Health - Care Hospital and nursing home | 311 | 1.2% | 109 | 0.4% | 2.85 | 315 | 3.08 | 354 | 3.03 |
| Health - Care Doctor | 426 | 1.6% | 455 | 1.8% | 0.94 | 368 | 0.85 | 480 | 1.04 |
| Health - Care Prescriptions, in-home medical care, special facilities | 339 | 1.3% | 364 | 1.4% | 0.93 | 272 | 0.83 | 412 | 0.87 |
| Health - Care Insurance | 1052 | 4.1% | 952 | 3.8% | 1.11 | 868 | 0.97 | 1215 | 1.09 |
| Health - Care Total health care | 2129 | 8.2% | 1938 | 7.6% | 1.10 | 1823 | 1.04 | 2461 | 1.14 |
| Total | 25961 | 100.0% | 25375 | 100.0% | 1.02 | 22449 | 0.96 | 26994 | 1.01 |
NA=Not applicable. Weights are used to calculate all estimates.
| Category | Single-year measure of parental expenditures - 1999 (N=3295) - Ceoff. | Single-year measure of parental expenditures - 1999 (N=3295) - Std Err | Single-year measure of parental expenditures - 2001 (N=3569) - Ceoff. | Single-year measure of parental expenditures - 2001 (N=3569) - Std Err | Single-year measure of parental expenditures - 2003 (N=3813) - Ceoff. | Single-year measure of parental expenditures - 2003 (N=3813) - Std Err | Three-year average of parental expenditures - 1999 (N=2735) - Ceoff. | Three-year average of parental expenditures - 1999 (N=2735) - Std Err | Three-year average of parental expenditures - 2001 (N=2741) - Coeff. | Three-year average of parental expenditures - 2001 (N=2741) - Std Err | Three-year average of parental expenditures - 2003 (N = 2740) - Coeff. | Three-year average of parental expenditures - 2003 (N = 2740) - Std Err | Average, 1999-2003 - Ceoff. | Average, 1999-2003 - Std Err" |
|---|---|---|---|---|---|---|---|---|---|---|---|---|---|---|
| Log parental expenditures | 0.249 | 0.017 | 0.252 | 0.015 | 0.274 | 0.017 | 0.318 | 0.021 | 0.320 | 0.020 | 0.335 | 0.022 | 0.318 | 0.017 |
| Adult child's charcateristics: Age* | 3.899 | 0.787 | 3.543 | 0.733 | 3.662 | 0.762 | 5.906 | 1.012 | 4.745 | 1.000 | 2.369 | 1.108 | 3.928 | 0.820 |
| Adult child's charcateristics: Age squared* | 0.038 | 0.010 | -0.350 | 0.009 | -0.037 | 0.009 | -0.057 | 0.012 | -0.050 | 0.012 | -0.025 | 0.014 | -0.040 | 0.010 |
| Adult child's charcateristics: Male | 0.064 | 0.021 | 0.049 | 0.020 | 0.065 | 0.021 | 0.075 | 0.022 | 0.041 | 0.022 | 0.048 | 0.025 | 0.058 | 0.018 |
| Adult child's charcateristics: Married | 0.381 | 0.029 | 0.414 | 0.027 | 0.433 | 0.027 | 0.367 | 0.030 | 0.421 | 0.029 | 0.419 | 0.032 | 0.375 | 0.024 |
| Family size One (reference) | ||||||||||||||
| Family size Two | 0.287 | 0.036 | 0.296 | 0.033 | 0.318 | 0.034 | 0.227 | 0.039 | 0.338 | 0.039 | 0.190 | 0.043 | 0.243 | 0.032 |
| Family size Three | 0.380 | 0.038 | 0.349 | 0.036 | 0.391 | 0.037 | 0.375 | 0.042 | 0.439 | 0.042 | 0.361 | 0.046 | 0.374 | 0.034 |
| Family size Four | 0.460 | 0.040 | 0.466 | 0.037 | 0.481 | 0.039 | 0.426 | 0.044 | 0.507 | 0.044 | 0.390 | 0.048 | 0.423 | 0.036 |
| Family size Five or more | 0.470 | 0.044 | 0.446 | 0.041 | 0.499 | 0.043 | 0.421 | 0.049 | 0.511 | 0.047 | 0.433 | 0.053 | 0.432 | 0.039 |
| OTHER COVARIATES Intercept | 6.689 | 0.255 | 6.638 | 0.245 | 6.116 | 0.263 | 6.087 | 0.275 | ||||||
| OTHER COVARIATES parent age | -1.620 | 0.652 | -0.979 | 0.629 | -0.115 | 0.665 | -1.612 | 0.724 | ||||||
| OTHER COVARIATES parent age sq | 0.016 | 0.006 | 0.011 | 0.005 | 0.005 | 0.006 | 0.017 | 0.006 | ||||||
| OTHER COVARIATES parent marital status | 0.099 | 0.029 | 0.084 | 0.027 | 0.045 | 0.030 | 0.058 | 0.026 | ||||||
| OTHER COVARIATES divorce dummy (=1 if divorced) | -0.010 | 0.035 | -0.045 | 0.033 | 0.013 | 0.035 | -0.015 | 0.030 | ||||||
| OTHER COVARIATES parent family size 2 | -0.110 | 0.032 | -0.107 | 0.030 | -0.119 | 0.033 | -0.113 | 0.028 | ||||||
| OTHER COVARIATES parent family size 3 | -0.253 | 0.042 | -0.202 | 0.038 | -0.232 | 0.041 | -0.278 | 0.036 | ||||||
| OTHER COVARIATES parent family size 4 | -0.283 | 0.051 | -0.279 | 0.049 | -0.293 | 0.050 | -0.293 | 0.049 | ||||||
| OTHER COVARIATES parent family size 5 and more | -0.419 | 0.057 | -0.378 | 0.053 | -0.267 | 0.056 | -0.344 | 0.054 |
All models also control for parent's age, parent's age squared, parent household head gender, parent marital status and parents' family size dummies
For models 1999-2003, family size dummies refer to families with average size 1999 to 2003 of +/- 0.5 the given value, e.g., 1.5 to 2.5 for size 2.
*Parameter estimates on age and age squared are multiplied by 100.
For the three-year averages, all dollars are expressed in 2003 dollars using the CPI-U.
| Child Age- and Family Size-Adjusted Consumption Quartile (1999-2003) | Parental Age- and Family Size-Adjusted Consumption Quartile (1999-2003) - 1 (lowest) | Parental Age- and Family Size-Adjusted Consumption Quartile (1999-2003) - 2 | Parental Age- and Family Size-Adjusted Consumption Quartile (1999-2003) - 3 | Parental Age- and Family Size-Adjusted Consumption Quartile (1999-2003) - 4 (highest) |
|---|---|---|---|---|
| 1 (lowest) | 36.3 | 29.7 | 21.6 | 10.7 |
| 2 | 27.2 | 24.3 | 26.8 | 20.7 |
| 3 | 21.1 | 26.2 | 27.0 | 26.0 |
| 4(highest) | 15.4 | 19.8 | 24.7 | 42.6 |
Estimate indicates the probability of belonging to a given expenditure quintile among children given one's parent's position in the parental expenditure distribution.
| Domain | Question in 2003 | Waves Available |
|---|---|---|
| Food - At home | F17 & F18: In addition to what you buy with food stamps, do [you and anyone else in your family/you] spend any money on food that you use at home? How much do you spend on that food in an average week? | 1968-2003, except '73, '88, '89 |
| Food - Delivered | F19 & F20: Do you have any food delivered to the door which isn't included in that? How much do you spend on that food? | 1968, 1994 - 2003 |
| Food - Away from home | F21: About how much do [you and everyone else in your family/you] spend eating out? | 1969 - 2003, except '73, '88, '89 |
| Health care Hospital & nursing home | H64: About how much did you pay out-of-pocket for nursing home and hospital bills in 2001 and 2002 combined? | 1999-2003 |
| Health care Doctor | H70: About how much did you pay out-of-pocket for doctor, outpatient surgery, dental bills in 2001 and 2002 combined? | 1999-2003 |
| Health care Prescription drugs | H76: About how much did you pay out-of-pocket for prescriptions, in-home medical care, special facilities, and other services in 2001 and 2002 combined? | 1999-2003 |
| Health care Insurance | H63: Altogether, how much did [you/your family] pay for health insurance premiums, in 2001 and 2002 combined, for (all of) the health insurance or health care coverage(s) you just mentioned? Please include amounts that you had automatically deducted from your pay, as well as amounts you paid directly. | 1999-2003 |
| Housing Mortgage | A25: How much are your monthly mortgage payments? A30: Do your payments include insurance premiums? A29: Do your payments include property tax? |
1968 - 2003, except '73, '74, '75, '82, '88, '89 |
| Housing Rent | A31: About how much rent do you pay a month? | 1968 - 2003, except '88, '89 |
| Housing Insurance | A22: How much is your total yearly homeowner's insurance premium? | 1991 - 2003 |
| Housing Property tax | A21: About how much are your total yearly property taxes, including city, county, and school taxes? | 1968-2003, except '78, '88, '89 |
| Housing Electricity | A48: The next few questions are about amounts paid for utilities, such as electricity and water. How much [do you/does your family] usually pay for electricity per month on average? | 1981 - 1983, 1999-2003 |
| Housing Heat | A49: How much for gas or other types of heating fuel per month | 1981 - 1983, 1999-2003 |
| Housing Water and sewer | A50: How much [do you/does your family] usually pay) for water and sewer per month | 1981 - 1983, 1999-2003 |
| Housing Other utilities | A51, A52, & A53: And do you have any other utility expenses? What were those other utilities expenses? On average, how much are these other utility expenses per month? Cable, garbage, phone, sewer | 1981 - 1983, 1999-2003 |
| Transportation Vehicle loan payment | V20: How much are your payments and how often are they made? | 1968, 1999-2003 |
| Transportation Down payment | V17: How much did you put down in cash? | 1999-2003 |
| Transportation Vehicle lease payment | V24: How much was your initial outlay for that lease -- including your down payment and any fees? V25: How much are your payments and how often are they made? |
1999-2003 |
| Transportation Insurance | X1: How much do [you/you and your family living there] pay for car insurance [per year/for all your vehicles per year]? | 1968, 1999-2003 |
| Transportation Gasoline | X4: In 2002 how much did [you/you and your family living there] pay for each of these transportation related expenses... | 1999-2003 |
| Transportation Repairs and maintenance | X4: | 1999-2003 |
| Transportation Parking and carpool | X4: | 1999-2003 |
| Transportation Bus fares and train fares | X4: | 1999-2003 |
| Transportation Taxicabs | X4: | 1999-2003 |
| Transportation Other transportation | X4: | 1999-2003 |
| Transportation Other vehicle expenditures | X3(Other than the car payments you already told me about,) how much did you pay in car payments? | 1999-2003 |
| Education (1) | X6 & X7: In 2002, did [you/you and your family living there] have any school-related expenses such as: - Purchase or rental of books, supplies, uniforms, or equipment including computers and software; - Tuition or tutoring not including any amounts for day care or nursery school. I will ask you about those later; - Room and board for a family member who is away at school? How much in total were these expenses? |
1999-2003 |
| Education (2) | X8, X9, & X10: In 2002, were there any other school-related expenses not already covered in the previous question? What other types of school-related expenses did you have? Altogether, how much were these other expenses? | |
| Child Care | F7: How much did [you and your family living there/you] pay for child care in 2002? | 1970, '71, '72, '76, '77, '79, '85, 1988-2003 |
| PSID Consumption Category | CE UCC Code | Notes |
|---|---|---|
| Food | 200900, 790310, | |
| Food: At home | 190904, 790220, 790230 | 790320, and 790410 (alcohol) |
| Food: Delivered | are included for the total | |
| Food: Away from home | 190902, 190903, 790410, 790420, 800700 | of all food expenditures. |
| Health care: Hospital & nursing home | 570110, 570210, 570220, 570230 | |
| Health care: Doctor | 560110, 560210, 560310, 560330, 560400 | |
| Health care: Prescription drugs | 340906, 540000, 550110, 550320, 550330, 550340, 570901, 570903, 570240 | |
| Health care: Insurance | 580111, 580112, 580113, 580114, 580311, 580312, 580901, 580903, 580904, 580905, 580906 | |
| Housing: Mortgage | 220311, 220312, 220321, 220322, 830201, 830202 | |
| Housing: Rent | 210110, 800710 | |
| Housing: Insurance | 220121, 220122 | |
| Housing: Property tax | 220211, 220212 | |
| Housing: Utility | 250111, 250112, 250113, 250114, 250211, 250212, 250213, 250214, 250221, 250222, 250223,250224, 250901, 250902, 250903, 250904, 260111, 260112, 260113, 260114, 260211, 260212,260213, 260214, 270211, 270212, 270213, 270214, 270310, 270411, 270412, 270413, 270414,270901, 270902, 270903, 270904 | 270101, 270102 (telephone) are included for total housing expenses. |
| Transportation: Vehicle loan payment | 870103, 870104, 870203, 870204, 850300 | |
| Transportation: Down payment | 870101, 870102, 870201, 870202, 870801 | |
| Transportation: Vehicle lease payment | 450310, 450313, 450314, 450410, 450413, 450414 | |
| Transportation: Insurance | 450311, 450411, 500110 | |
| Transportation: Gasoline | 470111, 470112, 470113 | |
| Transportation: Repairs | 470220, 470211, 470212, 480110, 480213, 480214, 490110, 490211, 490212, 490221, 490231,490232, 490311, 490312, 490313, 490314, 490318, 490319, 490411, 490412, 490413, 490501,490502, 490900, 520410 | |
| Transportation: Other vehicle payments | ||
| Transportation: Parking | 520531, 520532 | |
| Transportation: Bus | 530311, 530312, 530501, 530902, 530210 | |
| Transportation: Taxicab | 530411, 530412 | |
| Transportation: Other transportation | 520511, 520512, 520521, 520522, 520542, 520902, 520903, 520904, 520905, 520906, 520907,530110, 530901 | |
| Education: Schooling | 190901, 210310, 370903, 390901, 660110, 660210, 660310, 660900, 670110, 670210, 670901, 670902, 800802, 800804 | |
| Education: Other school-related | 690111, 690112 | |
| Child care | 340211, 340212, 670310 |
UCC code in CEX not in PSID
| Spending on: | Coefficient | p-value |
|---|---|---|
| Constant | -2286 | 0.00 |
| Food at home | 1.32 | 0.00 |
| Food away | 2.50 | 0.00 |
| Mortgage | 1.03 | 0.00 |
| Rent | 1.29 | 0.00 |
| Home insurance | 2.27 | 0.00 |
| Property Tax | 2.67 | 0.00 |
| Utilities | 2.70 | 0.00 |
| Transportation | 1.28 | 0.00 |
| Education | 1.20 | 0.00 |
| Child care | 1.58 | 0.00 |
| Health care | 1.33 | 0.00 |