
INDUSTRIAL PRODUCTION AND CAPACITY UTILIZATION
INDUSTRIAL PRODUCTION AND CAPACITY UTILIZATION
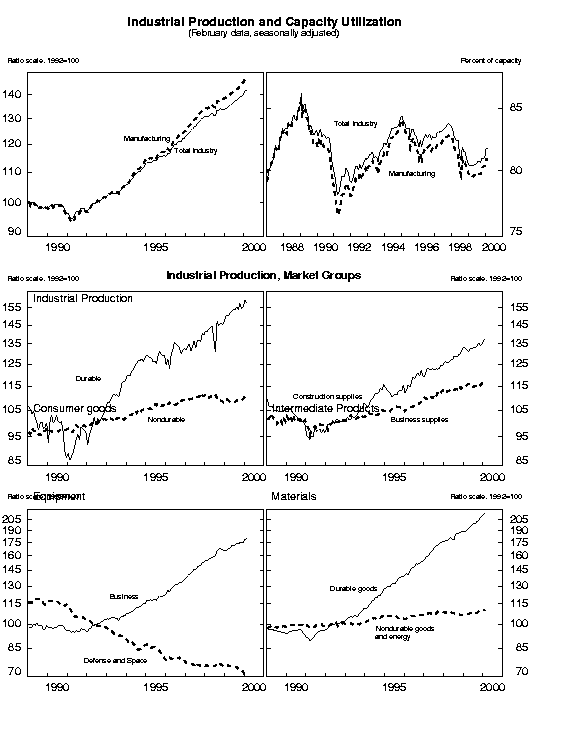
Industrial production increased 0.3 percent in February after having posted advances of 1.1 percent in January and 0.5 percent in December. The output of utilities increased 0.7 percent, manufacturing increased 0.3 percent, and mining output fell 0.7 percent. At 142.1 percent of its 1992 average, industrial production in February was 5.6 percent higher than in February 1999. The rate of capacity utilization for total industry held steady at 81.7 percent, about 1/4 percentage point below its long-term average.
 INDUSTRIAL PRODUCTION AND CAPACITY UTILIZATION:  SUMMARY
 Seasonally adjusted
                               |             Index, 1992=100             |                 Percent change
                               |     1999                2000            |   1999            2000          |  Feb. 99 to
 Industrial Production         |     Nov.      Dec.      Jan.      Feb.  |   Nov.    Dec.    Jan.    Feb.  |   Feb. 00
 ------------------------------------------------------------------------------------------------------------------------
                               |                                         |                                 |
  Total index                  |    139.4     140.2     141.7     142.1  |     .3      .5     1.1      .3  |         5.6
     Previous estimates        |    139.5     140.1     141.5            |     .3      .4     1.0          |
                               |                                         |                                 |
 Major market groups:          |                                         |                                 |
     Products, total           |    128.0     128.5     130.1     130.2  |    -.4      .4     1.3      .1  |         3.5
        Consumer goods         |    117.6     118.2     119.6     119.5  |    -.5      .5     1.2      .0  |         2.0
        Business equipment     |    175.0     174.9     179.4     179.6  |     .1     -.1     2.6      .1  |         8.0
        Construction supplies  |    134.3     135.0     136.6     137.4  |    -.8      .5     1.1      .6  |         3.7
     Materials                 |    158.8     160.1     161.3     162.3  |    1.3      .8      .7      .6  |         9.2
                               |                                         |                                 |
 Major industry groups:        |                                         |                                 |
     Manufacturing             |    145.0     145.6     147.0     147.5  |     .5      .4     1.0      .3  |         5.9
        Durable                |    177.4     178.5     181.3     181.9  |     .5      .6     1.6      .4  |         9.1
        Nondurable             |    113.6     113.7     113.9     114.2  |     .6      .1      .2      .2  |         1.7
     Mining                    |     99.7      99.8     100.5      99.8  |     .5      .2      .6     -.7  |         2.4
     Utilities                 |    110.9     114.3     117.3     118.1  |   -3.7     3.1     2.7      .7  |         4.9
 ------------------------------------------------------------------------------------------------------------------------
                               |                                                                           |   Capacity
                               |                            Percent of Capacity                            |    Growth
                               |   Average      1982   1988-89     1999  |   1999            2000          |  Feb. 99 to
 Capacity Utilization          |  1967-99        Low      High     Feb.  |   Nov.    Dec.    Jan.    Feb.  |   Feb. 00
 ------------------------------------------------------------------------------------------------------------------------
                               |                                         |                                 |
  Total industry               |     82.0      71.1      85.4      80.4  |   80.9    81.1    81.7    81.7  |         3.9
     Previous estimates        |                                         |   81.0    81.1    81.6          |
                               |                                         |                                 |
     Manufacturing             |     81.1      69.0      85.7      79.7  |   80.3    80.4    80.9    80.9  |         4.3
        Advanced processing    |     80.5      70.4      84.2      78.7  |   79.2    79.2    79.9    79.7  |         5.3
        Primary processing     |     82.4      66.2      88.9      82.8  |   83.8    83.8    84.0    84.2  |         2.1
     Mining                    |     87.3      80.3      88.0      80.9  |   83.0    83.1    83.7    83.3  |         -.5
     Utilities                 |     87.5      75.9      92.6      88.7  |   86.5    89.1    91.3    91.9  |         1.3
 ------------------------------------------------------------------------------------------------------------------------
 Note:  Estimates for February are preliminary.  Estimates from November to January are revised.
Market Groups
The output of consumer goods was flat in February; a 0.2 percent increase in the production of nondurable goods was offset by a 1.0 percent decrease in durable goods. The output of durable consumer goods was pulled down by a 1.7 percent decline in the production of automotive products. After a rebound in January, motor vehicle assemblies fell back to a still-high level of 12.9 million units (annual rate). After strong increases in the previous two months, the production of other durable consumer goods slipped 0.3 percent, with cutbacks in the output of carpeting and appliances accounting for most of the decrease. The production of nondurable consumer goods excluding energy inched up 0.1 percent. The output of consumer energy products, which posted a 1.3 percent gain, was pushed up by increases in the production of consumer fuels and in utilities' sales to residences.
The production of business equipment edged up 0.1 percent after a strong gain in January. The production of information processing and related equipment, which was led by gains in the output of computers, rose 1.2 percent after having increased about 4.5 percent over the previous two months. The output of transit equipment dropped back 2.2 percent because of a slowing in the assembly of motor vehicles and aircraft. The output of industrial equipment, which had risen a brisk 2.7 percent in January, decreased only a bit.
The production index for construction supplies increased 0.6 percent, its third consecutive monthly gain. The output of materials was up 0.6 percent, slightly less than the average gain in the preceding three months. The output of durable goods materials rose 0.8 percent, with another strong increase in equipment parts, particularly semiconductors. The output of nondurable goods materials jumped 1.2 percent, and the output of energy materials, which had increased 1.1 percent in January, fell 0.7 percent.
Industry Groups
Manufacturing output rose 0.3 percent in February; most major durable goods industries posted gains, while the changes in nondurable goods industries were more mixed. Production in durable manufacturing strengthened 0.4 percent after a 1.6 percent increase in January. The robust growth in the production of electrical machinery eased to 1.7 percent, about half the pace set in the previous two months; although semiconductor production remained strong, the production of communications equipment was little changed after having risen sharply in January. The production of industrial machinery and equipment (which includes computers) increased 0.6 percent after a 2.5 percent pickup in January; the deceleration was widespread across categories of industrial machinery. After small gains in the previous two months, production in nondurable manufacturing increased another 0.2 percent, to a level 1.7 percent higher than in February 1999.
The factory operating rate, at 80.9 percent, was unchanged. The utilization rate for primary-processing industries increased slightly, to 84.2 percent, while that for advanced-processing industries dipped 0.2 percentage point, to 79.7 percent.
The output of utilities, which had rebounded 3.1 percent in December and had increased a further 2.7 percent in January, rose another 0.7 percent; the operating rate at utilities rose to 91.9 percent. Mine production fell 0.7 percent, more than reversing the gain in January.
G.17 Release Tables: