
Release Date: April 15, 2005
Release dates | Historical data | Documentation
Current Monthly Release Other formats: ASCII | PDF (144 KB)
Supplemental Monthly Release Other formats: ASCII | PDF (144 KB)
Annual Revision Release Other formats: ASCII | PDF (150 KB)
| Industrial production |
1997=100 | Percent change | |||||||
|---|---|---|---|---|---|---|---|---|---|
| 2004 Dec. |
2005 | 2004 Dec. |
2005 | Mar. '04 to Mar. '05 |
|||||
| Jan. | Feb. | Mar. | Jan. | Feb. | Mar. | ||||
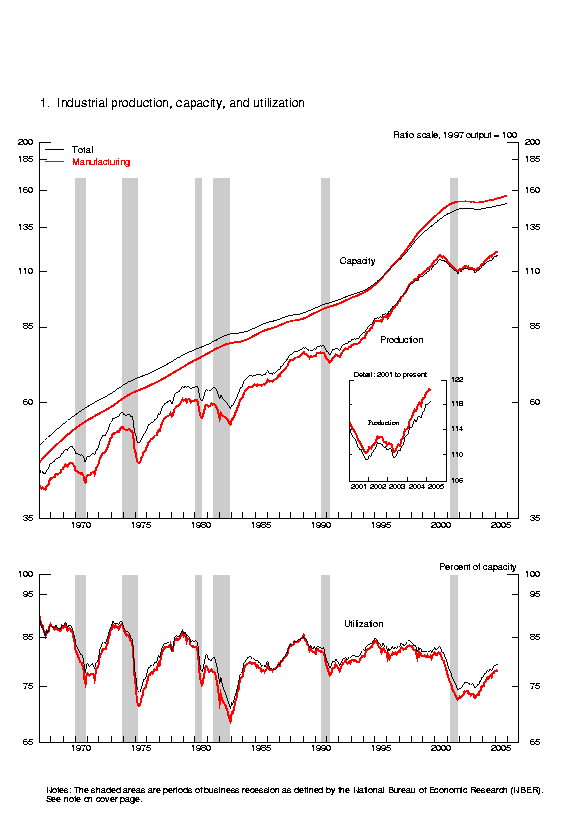
| Total index | 117.9 | 117.9 | 118.2 | 118.5 | .8 | .0 | .2 | .3 | 3.9 |
| Previous estimates | 117.9 | 118.0 | 118.4 | .8 | .1 | .3 | |||
| Major market groups | |||||||||
| Final Products | 116.0 | 115.9 | 116.4 | 116.5 | .9 | -.1 | .4 | .1 | 4.3 |
| Consumer goods | 113.1 | 112.6 | 113.2 | 113.0 | .8 | -.5 | .5 | -.1 | 2.4 |
| Business equipment | 123.7 | 124.9 | 125.1 | 125.3 | 1.3 | 1.0 | .1 | .2 | 8.7 |
| Nonindustrial supplies | 114.6 | 114.8 | 114.7 | 115.3 | .8 | .2 | -.1 | .6 | 3.6 |
| Construction | 107.8 | 108.0 | 108.7 | 108.6 | .0 | .1 | .7 | -.1 | 2.7 |
| Materials | 121.0 | 121.1 | 121.1 | 121.7 | .8 | .1 | .0 | .4 | 3.5 |
| Major industry groups | |||||||||
| Manufacturing (see note below) | 119.7 | 120.1 | 120.5 | 120.4 | .5 | .3 | .3 | -.1 | 4.1 |
| Previous estimates | 119.7 | 120.3 | 120.9 | .5 | .5 | .5 | |||
| Mining | 91.4 | 91.4 | 91.8 | 92.4 | .9 | -.1 | .4 | .7 | .3 |
| Utilities | 118.5 | 115.8 | 114.5 | 118.7 | 3.1 | -2.3 | -1.1 | 3.6 | 4.9 |
| Capacity utilization |
Percent of capacity |
Capacity growth Mar. '04 to Mar. '05 |
|||||||
|---|---|---|---|---|---|---|---|---|---|
| Average 1972-2004 |
1982 Low |
1988-89 High |
2004 Mar. |
2004 Dec. |
2005 | ||||
| Jan. | Feb. | Mar. | |||||||
| Total industry | 81.0 | 70.8 | 85.1 | 77.4 | 79.2 | 79.2 | 79.3 | 79.4 | 1.2 |
| Previous estimates | 79.2 | 79.2 | 79.4 | ||||||
| Manufacturing (see note below) | 79.8 | 68.5 | 85.6 | 75.9 | 77.9 | 78.0 | 78.2 | 78.0 | 1.3 |
| Previous estimates | 77.9 | 78.2 | 78.5 | ||||||
| Mining | 87.1 | 78.6 | 85.8 | 87.1 | 86.7 | 86.6 | 87.1 | 87.8 | -.5 |
| Utilities | 86.8 | 77.7 | 92.8 | 84.4 | 87.2 | 85.1 | 84.1 | 87.1 | 1.7 |
| Stage-of-process groups | |||||||||
| Crude | 86.4 | 77.3 | 88.9 | 85.3 | 86.4 | 86.2 | 86.3 | 86.7 | -.3 |
| Primary and semifinished | 82.1 | 68.0 | 86.5 | 79.3 | 80.7 | 80.5 | 80.1 | 80.6 | 2.3 |
| Finished | 77.9 | 71.1 | 83.1 | 73.5 | 76.2 | 76.3 | 76.9 | 76.6 | .3 |
r  Revised.  p  Preliminary.

       The statistics in this release cover output, capacity, and capacity utilization in the

industrial sector, which the Federal Reserve defines as manufacturing, mining, and electric and

gas utilities.  Manufacturing comprises those industries included in the North American Industry

Classification System, or NAICS, manufacturing plus the logging and newspaper, periodical,

book and directory publishing industries that have traditionally been considered manufacturing

and included in the industrial sector.
Market Groups
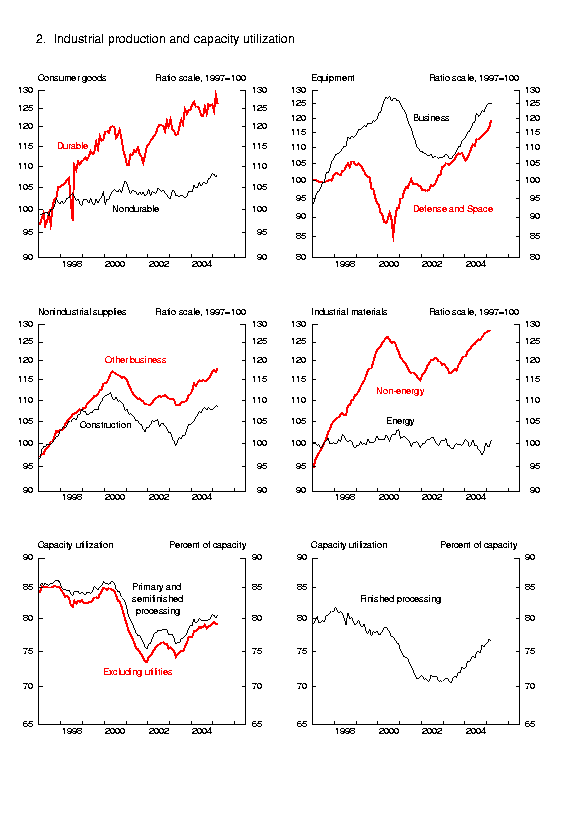
The output of consumer goods declined 0.1 percent in March but, nevertheless, posted a modest gain in the first quarter. Consumer goods output is now shown to have increased 0.5 percent in February, a rate 0.6 percentage point lower than originally reported; in large part, the revision reflected widespread downward revisions in nondurables. In March, the index of consumer durable goods fell 1.9 percent. Of the major categories, only the index for appliances, furniture, and carpeting reported a gain. The output of automotive products tumbled 3.6 percent after a surge of 6.3 percent in February. The index of consumer nondurable goods advanced 0.5 percent in March. Increases in consumer energy products and in the production of paper products were only partly offset by declines elsewhere. Among non-energy nondurables, the index for clothing fell for the fourth straight month, and the indexes for foods and tobacco and for chemical products both declined 0.3 percent.
The production of business equipment edged up 0.2 percent; in the first quarter, this index increased at an annual rate of 7.5 percent. In March, a drop in transit equipment was more than offset by advances in information processing and in industrial and other equipment. The output of defense and space equipment posted another strong gain and was up at an annual rate of 10 percent in the first quarter.
Nonindustrial supplies rose 0.6 percent in March. Business supplies jumped 0.9 percent and increased at an annual rate of 4.7 percent in the first quarter--a rate similar to the fourth-quarter pace. The output of construction supplies edged down in March but still posted a modest first-quarter gain. The index for materials rose 0.4 percent and was boosted by a 1.4 percent surge in the production of energy materials. However, the indexes for both durable and nondurable non-energy materials were little changed.
Industry Groups
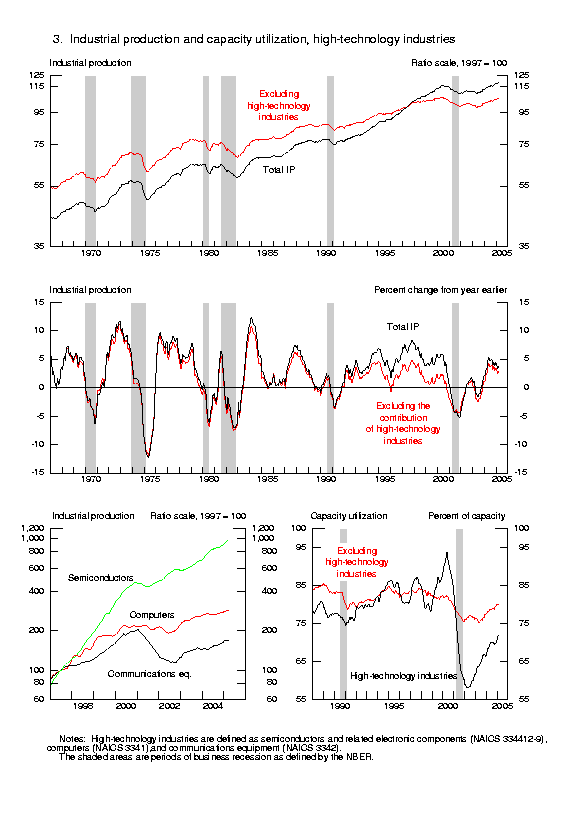
Manufacturing output edged down 0.1 percent in March, and the factory operating rate fell to 78.0 percent. The decline of 0.2 percent in the index for durable goods reflected a drop in the output of motor vehicles and parts and in the production of nonmetallic mineral products. Output in other major durable goods categories rose or was little changed. Computer and electronic products advanced 1.1 percent and rose at an annual rate of 22.6 percent in the first quarter. Among selected high-technology industries, the index for computer and peripheral equipment rose at an annual rate of 12.7 percent in the first quarter, and the output of semiconductors and related electronic components advanced at an annual rate of 39 percent. Although the production of communications equipment fell in March, this index increased at an annual rate of more than 24 percent in the first quarter. In March, the production of nondurable goods slipped 0.2 percent, and declines were widespread. The sole exception among the major subsectors of nondurables was plastics and rubber products, which advanced 0.9 percent. The output of non-NAICS manufacturing industries (logging and publishing) was also up 0.9 percent.
Higher oil and gas extraction and coal production boosted the output of mines 0.7 percent, and both electric and gas utilities contributed to the 3.6 percent advance in utility output. Capacity utilization for industries in the crude state of processing rose to 86.7 percent, a rate that is 0.3 percentage point above its 1972-2004 average. The operating rate for industries in the primary and semifinished stages advanced 0.5 percentage point, to 80.6 percent, but the utilization rate for finished goods producers fell 0.3 percentage point, to 76.6 percent. Capacity utilization in both these industry groups remained below their respective long-run averages.
G.17 Release Tables:
| Ascii | Screen reader | Summary: Industrial Production and Capacity Utilization | Chart | Chart 1: Industrial Production, Capacity, and Capacity Utilization | Chart | Chart 2: Industrial Production and Capacity Utilization | Chart | Chart 3: Industrial Production and Capacity Utilization, High Technology Industries |
| Ascii | Screen reader | Table 1:Industrial Production: Market and Industry Groups (percent change) |
| Ascii | Screen reader | Table 2:Industrial Production: Special Aggregates and Selected Detail (percent change) |
| Ascii | Screen reader | Table 3: Motor Vehicle Assemblies |
| Ascii | Screen reader | Table 4: Industrial Production Indexes: Market and Industry Group Summary |
| Ascii | Screen reader | Table 5: Industrial Production Indexes: Special Aggregates |
| Ascii | Screen reader | Table 6: Diffusion Indexes of Industrial Production |
| Ascii | Screen reader | Table 7: Capacity Utilization: Manufacturing, Mining, and Utilities |
| Ascii | Screen reader | Table 8: Industrial Capacity: Manufacturing, Mining, and Utilities (percent change) |
| Ascii | Screen reader | Table 9: Industrial Production: Gross Value of Products and Nonindustrial Supplies |
| Ascii | Screen reader | Table 10: Gross-Value-Weighted Industrial Production: Stage-of-Process Groups |
| Ascii | Screen reader | Table 11: Electric Power Use: Manufacturing and Mining |
| Ascii | Screen reader | Table 12: Historical Statistics for IP, Capacity, and Utilization: Total Industry |
| Ascii | Screen reader | Table 13: Historical Statistics for IP, Capacity, and Utilization: Manufacturing |
| Ascii | Screen reader | Table 14: Historical Statistics for IP, Capacity, and Utilization: Total Industry excluding Selected High-Technology Industries |
| Ascii | Screen reader | Table 15: Historical Statistics for IP, Capacity, and Utilization: Manufacturing excluding Selected High-Technology Industries |
Release dates | Historical data | Documentation
Current Monthly Release Other formats: ASCII | PDF (144 KB)
Supplemental Monthly Release Other formats: ASCII | PDF (144 KB)
Annual Revision Release Other formats: ASCII | PDF (150 KB)