
INDUSTRIAL PRODUCTION AND CAPACITY UTILIZATION
[2005 Revision Notice Below]
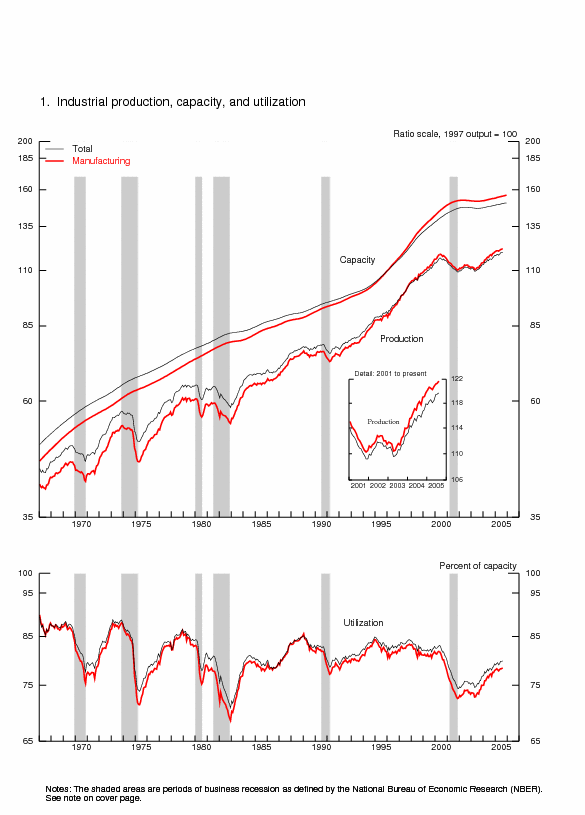
Industrial production rose 0.1 percent in August, and at 119.7 percent of its 1997 average, was 3.1
percent above its year-earlier level. Manufacturing output increased 0.3 percent; excluding motor vehicles
and parts, manufacturing production was unchanged from July. The output at mines declined 0.6 percent, and
the output at utilities decreased 0.5 percent. Hurricane Katrina severely curtailed output in the Gulf
Coast region at the end of August; hurricane-related production declines were most evident in oil and gas
extraction, industrial chemicals manufacturing, and petroleum refining. Overall, the rate of change in
total industrial production in August was reduced by an estimated 0.3 percentage point because of
disruptions related to the hurricane. Capacity utilization for total industry was 79.8 percent, a rate
that is 1.5 percentage points above its year-earlier level but 1.2 percentage points below its 1972-2004
average.
| Industrial production |
1997=100 | Percent change | |||||||
|---|---|---|---|---|---|---|---|---|---|
| 2005 | 2005 | Aug. '04 to Aug. '05 |
|||||||
| May | June | July | Aug. | May | June | July | Aug. | ||
| Total index | 118.5 | 119.4 | 119.5 | 119.7 | .3 | .8 | .1 | .1 | 3.1 |
| Previous estimates | 118.4 | 119.4 | 119.4 | .3 | .8 | .1 | |||
| Major market groups | |||||||||
| Final Products | 117.3 | 118.3 | 118.4 | 118.7 | .7 | .8 | .1 | .2 | 4.3 |
| Consumer goods | 113.2 | 114.3 | 113.7 | 114.1 | .7 | 1.0 | -.5 | .3 | 2.4 |
| Business equipment | 128.2 | 128.6 | 130.6 | 130.3 | 1.0 | .3 | 1.6 | -.2 | 8.0 |
| Nonindustrial supplies | 115.5 | 116.3 | 116.4 | 116.5 | -.1 | .6 | .1 | .1 | 3.2 |
| Construction | 110.0 | 109.1 | 109.8 | 110.6 | .0 | -.8 | .6 | .7 | 2.2 |
| Materials | 120.6 | 121.6 | 121.6 | 121.7 | .1 | .8 | .0 | .1 | 2.0 |
| Major industry groups | |||||||||
| Manufacturing (see note below) | 120.8 | 121.2 | 121.3 | 121.7 | .4 | .3 | .1 | .3 | 2.9 |
| Previous estimates | 120.7 | 121.2 | 121.4 | .4 | .4 | .1 | |||
| Mining | 92.7 | 93.2 | 92.3 | 91.7 | -.4 | .5 | -1.0 | -.6 | -.2 |
| Utilities | 114.4 | 120.0 | 120.8 | 120.2 | .2 | 4.9 | .7 | -.5 | 8.2 |
| Capacity utilization |
Percent of capacity |
Capacity growth Aug. '04 to Aug. '05 |
|||||||
|---|---|---|---|---|---|---|---|---|---|
| Average 1972-2004 |
1982 Low |
1988-89 High |
2004 Aug. |
2005 | |||||
| May | June | July | Aug. | ||||||
| Total industry | 81.0 | 70.8 | 85.1 | 78.3 | 79.2 | 79.8 | 79.8 | 79.8 | 1.1 |
| Previous estimates | 79.2 | 79.8 | 79.7 | ||||||
| Manufacturing (see note below) | 79.8 | 68.5 | 85.6 | 77.2 | 78.1 | 78.3 | 78.3 | 78.4 | 1.4 |
| Previous estimates | 78.1 | 78.3 | 78.3 | ||||||
| Mining | 87.1 | 78.6 | 85.8 | 86.9 | 88.2 | 88.6 | 87.8 | 87.4 | -.7 |
| Utilities | 86.8 | 77.7 | 92.8 | 82.3 | 83.8 | 87.8 | 88.4 | 87.8 | 1.3 |
| Stage-of-process groups | |||||||||
| Crude | 86.4 | 77.3 | 88.9 | 86.2 | 86.1 | 86.6 | 86.0 | 85.2 | -.6 |
| Primary and semifinished | 82.1 | 68.0 | 86.5 | 79.7 | 79.7 | 80.5 | 80.5 | 80.6 | 1.9 |
| Finished | 77.9 | 71.1 | 83.1 | 75.1 | 77.4 | 77.7 | 77.8 | 78.0 | .7 |
Market Groups
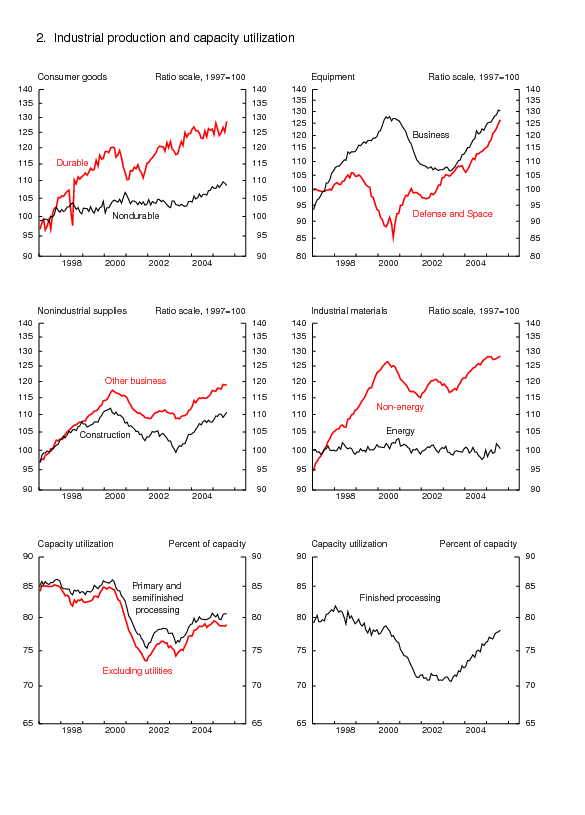
The output of consumer goods rose 0.3 percent in August. The production of durable goods increased 2.8 percent, and all major categories posted gains. After falling 1.8 percent in July, the output of automotive products jumped 4.7 percent in August. The indexes for home electronics; appliances, furniture, and carpeting; and miscellaneous goods also rose in August. The production of nondurable consumer goods fell 0.6 percent; all major categories--foods and tobacco, clothing, chemical products, and paper products--registered declines. The index for non-energy nondurables decreased 0.6 percent. Hurricane-related shutdowns contributed to a drop of 0.7 percent in the output of consumer energy products.
The index for business equipment slipped 0.2 percent, its first decline after eight consecutive months of increases. Still, the index remained 8.0 percent above its year-earlier level. The production of transit equipment and information processing equipment rose substantially, but the output of industrial and other equipment dropped back 1.9 percent, reversing much of its surge in July. The production of defense and space equipment increased 1.4 percent and was 12.2 percent higher than its level in August 2004. The index for construction supplies rose 0.7 percent in August, but the output of business supplies slipped 0.1 percent.
The output of materials edged up 0.1 percent; a gain of 0.4 percent in the output of non-energy materials slightly more than offset a decline of 0.7 percent in energy materials. Among non-energy materials, output rose in all major categories of durable goods materials, and output fell in all major categories of nondurable materials. Storm-related disruptions contributed to the declines in the output of energy materials and of chemical materials (a major category within nondurable materials).
Industry Groups
Manufacturing output rose 0.3 percent in August. Gains in the production of durables were widespread. The production of motor vehicles and parts advanced 3.7 percent, and the following industries also registered gains of more than 1 percent: primary metals, computer and electronic products, aerospace and miscellaneous transportation equipment, and miscellaneous manufacturing. These gains were only slightly offset by decreases in the output of machinery and wood products; the drop of 2.6 percent in machinery production followed a large gain in July. In contrast to durables, most major categories of nondurables declined in August. Hurricane-related shutdowns in the Gulf Coast region contributed to a drop of 1.1 percent in the production of chemicals and a decrease of 0.9 percent in the output of petroleum and coal products. The output of non-NAICS manufacturing industries (publishing and logging) together declined 0.6 percent. Capacity utilization in manufacturing edged up to 78.4 percent, a level 1.2 percentage points above that of August 2004.
The output at mines fell 0.6 percent in August; reductions in the extraction of oil and gas and in coal mining contributed heavily to the decline. Capacity utilization in mining declined to 87.4 percent. The output at utilities declined 0.5 percent, and the industry operating rate fell to 87.8 percent.
For industries by stage of process, capacity utilization for the crude stage decreased 0.8 percentage point, to 85.2 percent; for the primary and semifinished stages, it rose 0.1 percentage point, to 80.6 percent; and for the finished stage, it rose 0.2 percentage point, to 78.0 percent.
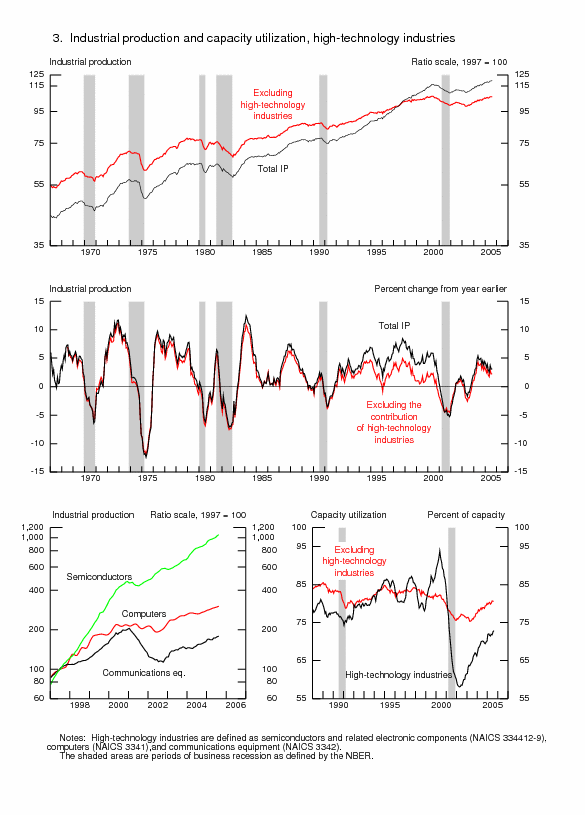
| Ascii | Screen reader | Summary: Industrial Production and Capacity Utilization | Chart | Chart 1: Industrial Production, Capacity, and Capacity Utilization | Chart | Chart 2: Industrial Production and Capacity Utilization | Chart | Chart 3: Industrial Production and Capacity Utilization, High Technology Industries |
| Ascii | Screen reader | Table 1: Industrial Production: Market and Industry Groups (percent change) |
| Ascii | Screen reader | Table 2: Industrial Production: Special Aggregates and Selected Detail (percent change) |
| Ascii | Screen reader | Table 3: Motor Vehicle Assemblies |
| Ascii | Screen reader | Table 4: Industrial Production Indexes: Market and Industry Group Summary |
| Ascii | Screen reader | Table 5: Industrial Production Indexes: Special Aggregates |
| Ascii | Screen reader | Table 6: Diffusion Indexes of Industrial Production |
| Ascii | Screen reader | Table 7: Capacity Utilization: Manufacturing, Mining, and Utilities |
| Ascii | Screen reader | Table 8: Industrial Capacity: Manufacturing, Mining, and Utilities (percent change) |
| Ascii | Screen reader | Table 9: Industrial Production: Gross Value of Products and Nonindustrial Supplies |
| Ascii | Screen reader | Table 10: Gross-Value-Weighted Industrial Production: Stage-of-Process Groups |
| Ascii | Screen reader | Table 11: Electric Power Use: Manufacturing and Mining |
| Ascii | Screen reader | Table 12: Historical Statistics for IP, Capacity, and Utilization: Total Industry |
| Ascii | Screen reader | Table 13: Historical Statistics for IP, Capacity, and Utilization: Manufacturing |
| Ascii | Screen reader | Table 14: Historical Statistics for IP, Capacity, and Utilization: Total Industry excluding Selected High-Technology Industries |
| Ascii | Screen reader | Table 15: Historical Statistics for IP, Capacity, and Utilization: Manufacturing excluding Selected High-Technology Industries |
Release dates | Historical data | Documentation
Current Monthly Release Other formats: ASCII | PDF (144 KB)
Supplemental Monthly Release Other formats: ASCII | PDF (144 KB)
Annual Revision Release Other formats: ASCII | PDF (150 KB)