
INDUSTRIAL PRODUCTION AND CAPACITY UTILIZATION
[2006 Revision Notice Below]
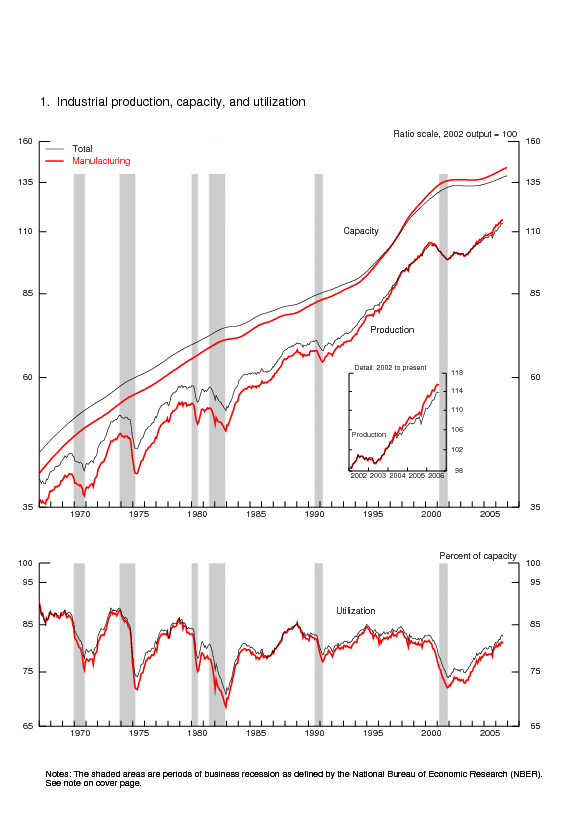
Industrial production declined 0.1 percent in August after an increase of 0.4 percent in July. Manufacturing output was unchanged in August; it advanced an upward-revised 0.4 percent in July. The output at utilities fell in August, as temperatures returned to more-normal levels. Production at mines moved down after increasing in the previous four months.
Capacity utilization for total industry fell to 82.4 percent in August. Even so, the utilization
rate was more than 2 percentage points above its level in August 2005 and 1.4 percentage points above its
1972-2005 average.
| Industrial production |
2002=100 | Percent change | |||||||
|---|---|---|---|---|---|---|---|---|---|
| 2006 | 2006 | Aug. '05 to Aug. '06 |
|||||||
| May | June | July | Aug. | May | June | July | Aug. | ||
| Total index | 112.2 | 113.4 | 113.9 | 113.7 | .1 | 1.1 | .4 | -.1 | 4.7 |
| Previous estimates | 112.2 | 113.1 | 113.5 | .0 | .8 | .4 | |||
| Major market groups | |||||||||
| Final Products | 113.5 | 115.0 | 115.4 | 115.5 | -.2 | 1.4 | .3 | .1 | 5.0 |
| Consumer goods | 106.3 | 107.9 | 107.5 | 107.6 | -.2 | 1.5 | -.4 | .1 | 1.9 |
| Business equipment | 132.0 | 133.5 | 136.6 | 136.3 | -.4 | 1.2 | 2.3 | -.2 | 13.5 |
| Nonindustrial supplies | 111.6 | 112.3 | 113.0 | 112.4 | .2 | .7 | .6 | -.5 | 4.0 |
| Construction | 113.3 | 113.6 | 114.4 | 114.2 | -.6 | .3 | .7 | -.1 | 5.6 |
| Materials | 111.0 | 112.1 | 112.6 | 112.4 | .3 | .9 | .5 | -.2 | 4.7 |
| Major industry groups | |||||||||
| Manufacturing (see note below) | 114.1 | 115.1 | 115.5 | 115.5 | -.2 | .9 | .4 | .0 | 5.4 |
| Previous estimates | 114.1 | 115.1 | 115.2 | -.1 | .8 | .1 | |||
| Mining | 100.4 | 101.4 | 102.0 | 101.6 | .5 | .9 | .6 | -.3 | 2.5 |
| Utilities | 106.2 | 109.0 | 110.1 | 109.2 | 1.9 | 2.6 | 1.0 | -.8 | .7 |
| Capacity utilization |
Percent of capacity |
Capacity growth Aug. '05 to Aug. '06 |
|||||||
|---|---|---|---|---|---|---|---|---|---|
| Average 1972-2005 |
1994-95 High |
2001-02 Low |
2005 Aug. |
2006 | |||||
| May | June | July | Aug. | ||||||
| Total industry | 81.0 | 85.0 | 73.9 | 80.3 | 81.7 | 82.5 | 82.7 | 82.4 | 1.9 |
| Previous estimates | 81.7 | 82.3 | 82.4 | ||||||
| Manufacturing (see note below) | 79.8 | 84.5 | 72.0 | 78.8 | 80.5 | 81.1 | 81.2 | 81.0 | 2.5 |
| Previous estimates | 80.6 | 81.1 | 81.0 | ||||||
| Mining | 87.3 | 89.0 | 85.6 | 88.6 | 90.3 | 91.3 | 91.9 | 91.7 | -1.1 |
| Utilities | 86.7 | 93.7 | 83.7 | 88.2 | 86.3 | 88.5 | 89.3 | 88.5 | .3 |
| Stage-of-process groups | |||||||||
| Crude | 86.4 | 89.4 | 83.2 | 86.8 | 88.2 | 88.8 | 89.3 | 89.1 | -.9 |
| Primary and semifinished | 82.1 | 88.1 | 74.6 | 81.8 | 82.7 | 83.6 | 84.0 | 83.6 | 2.3 |
| Finished | 77.9 | 80.5 | 70.8 | 77.1 | 79.3 | 79.9 | 79.9 | 79.8 | 2.3 |
Market Groups
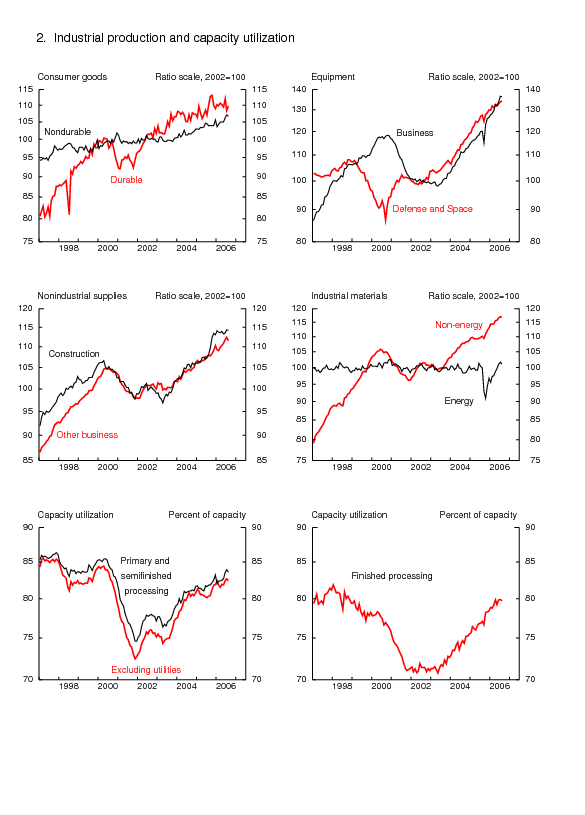
The output of consumer goods edged up 0.1 percent in August. An increase of 1.2�percent in the production of durable consumer goods mainly reflected an increase in the output of automotive products. After falling at an annual rate of 1 million units in July, assemblies of autos and light trucks rose 0.4�million units, to 10.6�million units, in August. The output of appliances, furniture, and carpeting moved up 1.2�percent after having declined for four consecutive months. The index for home electronics moved up, and the index for miscellaneous durable goods decreased. The production of consumer nondurable goods fell 0.3�percent; within this category, all of the major indexes declined, except clothing, which edged up 0.1 percent.
In August, the production of business equipment moved down 0.2�percent but was up 13.5 percent from its year-earlier level. The index for industrial and other equipment edged down 0.2 percent. Led by gains in the output of civilian aircraft and motor vehicles, the production of transit equipment increased 0.3 percent and was up 18.5 percent from its year-earlier level. A decline of 0.4 percent in the production of information processing equipment reflected a decrease in the output of communications equipment that was partly offset by an increase in the production of business computers. A rise of 0.3�percent in the production of defense and space equipment followed appreciable gains in June and July.
The production of construction supplies edged down 0.1 percent in August after a gain of 0.7�percent in July. The index for business supplies fell 0.7 percent in August, its first decline in six months. A decrease of 0.2 percent in the index for materials reflected lower output of both non-energy and energy materials. The indexes for consumer parts and for equipment parts moved up, but the index for other durable materials was flat. Among the major categories of nondurable non-energy materials, the indexes for paper and for chemicals fell, and the output of textiles was unchanged.
Industry Groups
Manufacturing output was flat in August, as a rise in the production of durable goods was offset by a decrease in the output of nondurables. Capacity utilization in manufacturing edged down to 81.0 percent, a level that was still 2.2 percentage points above that of August 2005. Within the durable manufacturing category, the production of motor vehicles and parts increased but was down 2.7 percent from its year-earlier level. An increase in the output of primary metals in August partially reversed a decline in July. The index for fabricated metal products moved up in August for a third consecutive month. The production of machinery retreated 0.5 percent after a jump of 4.5 percent in July. The output of computer and electronic products increased 0.5 percent in August. A decrease in the output of nondurable goods reflected widespread declines among the major categories; the only major category that increased was petroleum and coal products, which rose 0.2 percent. The output of other (non-NAICS) manufacturing industries (publishing and logging) fell 0.6 percent.
In mining, a drop of 0.3 percent in output was due mostly to a decline in oil and gas extraction. Capacity utilization at mines declined to 91.7�percent. The output at utilities dropped 0.8�percent, and capacity utilization for the industry fell to 88.5�percent.
Capacity utilization for industries in the crude stage of processing decreased 0.2 percentage point, to
89.1 percent. The operating rate for industries in the primary and semifinished stages moved down
0.4�percentage point, to 83.6 percent. For industries in the finished goods stage, capacity utilization
edged down 0.1 percentage point, to 79.8�percent.
Notice
| Ascii | Screen reader | Summary: Industrial Production and Capacity Utilization | Chart | Chart 1: Industrial Production, Capacity, and Capacity Utilization | Chart | Chart 2: Industrial Production and Capacity Utilization | Chart | Chart 3: Industrial Production and Capacity Utilization, High Technology Industries |
| Ascii | Screen reader | Table 1: Industrial Production: Market and Industry Groups (percent change) |
| Ascii | Screen reader | Table 2: Industrial Production: Special Aggregates and Selected Detail (percent change) |
| Ascii | Screen reader | Table 3: Motor Vehicle Assemblies |
| Ascii | Screen reader | Table 4: Industrial Production Indexes: Market and Industry Group Summary |
| Ascii | Screen reader | Table 5: Industrial Production Indexes: Special Aggregates |
| Ascii | Screen reader | Table 6: Diffusion Indexes of Industrial Production |
| Ascii | Screen reader | Table 7: Capacity Utilization: Manufacturing, Mining, and Utilities |
| Ascii | Screen reader | Table 8: Industrial Capacity: Manufacturing, Mining, and Utilities (percent change) |
| Ascii | Screen reader | Table 9: Industrial Production: Gross Value of Products and Nonindustrial Supplies |
| Ascii | Screen reader | Table 10: Gross-Value-Weighted Industrial Production: Stage-of-Process Groups |
| Ascii | Screen reader | Table 11: Historical Statistics for IP, Capacity, and Utilization: Total Industry |
| Ascii | Screen reader | Table 12: Historical Statistics for IP, Capacity, and Utilization: Manufacturing |
| Ascii | Screen reader | Table 13: Historical Statistics for IP, Capacity, and Utilization: Total Industry excluding Selected High-Technology Industries |
| Ascii | Screen reader | Table 14: Historical Statistics for IP, Capacity, and Utilization: Manufacturing excluding Selected High-Technology Industries |
Release dates | Historical data | Data Download |Documentation
Current Monthly Release Other formats: ASCII | PDF (144 KB)
Supplemental Monthly Release Other formats: ASCII | PDF (144 KB)
Annual Revision Release Other formats: ASCII | PDF (150 KB)