
INDUSTRIAL PRODUCTION AND CAPACITY UTILIZATION
[Annual Revision Notice Below]
Industrial production increased 1.3 percent in October after a downwardly revised decline of 3.7 percent in September. The revision to September output resulted, in part, from a larger estimate of the impact of Hurricanes Gustav and Ike on the chemical industry. Manufacturing production, which dropped 3.7 percent in September, rose 0.6 percent in October. The output of mines advanced 6.1 percent, as most crude oil and natural gas operations in the Gulf of Mexico were brought back online after the hurricanes. The output of utilities rose 0.4 percent.
Industrial production in September and October was substantially affected by the hurricanes and a strike in the commercial aircraft industry. Excluding these special factors, total industrial production is estimated to have fallen around 2/3 percent in both September and October. The hurricane-related disruptions, which are now estimated to have been larger than previously reported, lowered the change in total industrial production in September about 2-1/2 percentage points, and the return to operation in October of most of the affected facilities boosted the change in output about 2 percentage points. The strike in the commercial aircraft industry reduced industrial production 1/2 percentage point in September and an additional 0.1 percentage point in October.
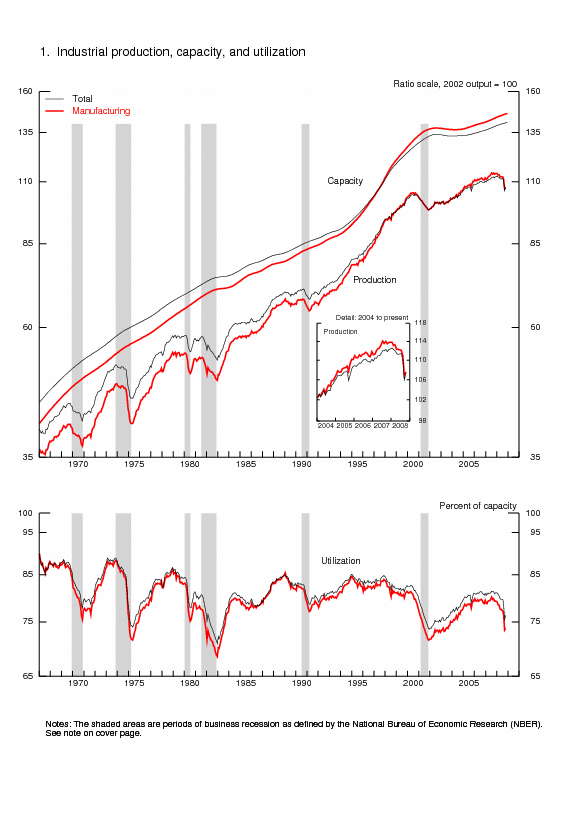
At 107.3 percent of its 2002 average, total industrial production in October was 4.1 percent below its
level of a year earlier. The capacity utilization rate for total industry rose to 76.4 percent in October,
a level 4.6 percentage points below its average level from 1972 to 2007.
| Industrial production |
2002=100 | Percent change | |||||||||||
|---|---|---|---|---|---|---|---|---|---|---|---|---|---|
| 2008 | 2008 | Oct. '07 to Oct. '08 |
|||||||||||
| May[r] | June[r] | July[r] | Aug.[r] | Sept.[r] | Oct.[p] | May[r] | June[r] | July[r] | Aug.[r] | Sept.[r] | Oct.[p] | ||
| Total index | 111.2 | 111.3 | 111.4 | 110.1 | 105.9 | 107.3 | -.2 | .1 | .1 | -1.2 | -3.7 | 1.3 | -4.1 |
| Previous estimates | 111.3 | 111.5 | 111.4 | 110.4 | 107.3 | -.1 | .1 | .0 | -1.0 | -2.8 | |||
| Major market groups | |||||||||||||
| Final Products | 112.1 | 112.6 | 112.6 | 111.0 | 108.2 | 108.8 | -.2 | .4 | .0 | -1.4 | -2.5 | .5 | -3.7 |
| Consumer goods | 105.8 | 106.2 | 106.2 | 104.1 | 102.9 | 104.3 | -.4 | .4 | .0 | -2.0 | -1.1 | 1.3 | -2.8 |
| Business equipment | 130.4 | 130.8 | 130.8 | 130.5 | 121.2 | 118.5 | .3 | .3 | .0 | -.2 | -7.1 | -2.2 | -8.8 |
| Nonindustrial supplies | 106.1 | 105.7 | 105.8 | 104.8 | 102.3 | 102.5 | -.4 | -.4 | .1 | -.9 | -2.4 | .2 | -4.9 |
| Construction | 101.7 | 101.3 | 102.1 | 101.1 | 99.2 | 98.1 | .3 | -.4 | .8 | -.9 | -1.9 | -1.1 | -7.0 |
| Materials | 112.2 | 112.1 | 112.3 | 111.1 | 105.1 | 107.6 | -.1 | .0 | .2 | -1.1 | -5.4 | 2.3 | -4.1 |
| Major industry groups | |||||||||||||
| Manufacturing (see note below) | 112.3 | 112.2 | 112.1 | 111.0 | 106.9 | 107.5 | .0 | -.1 | -.1 | -1.0 | -3.7 | .6 | -5.3 |
| Previous estimates | 112.4 | 112.3 | 112.3 | 111.3 | 108.5 | .1 | -.1 | .0 | -.9 | -2.6 | |||
| Mining | 104.1 | 104.2 | 105.7 | 105.5 | 96.5 | 102.4 | .2 | .1 | 1.4 | -.2 | -8.5 | 6.1 | 1.1 |
| Utilities | 108.0 | 110.0 | 109.2 | 104.7 | 107.3 | 107.7 | -2.2 | 1.9 | -.7 | -4.1 | 2.4 | .4 | -.7 |
| Capacity utilization |
Percent of capacity |
Capacity growth |
|||||||||||
|---|---|---|---|---|---|---|---|---|---|---|---|---|---|
| Average 1972- 2007 |
1988- 89 high |
1990- 91 low |
1994- 95 high |
2001- 02 low |
2007 Oct. |
||||||||
| 2008 | Oct. '07 to Oct. '08 |
||||||||||||
| May[r] | June[r] | July[r] | Aug.[r] | Sept.[r] | Oct.[p] | ||||||||
| Total industry | 81.0 | 85.0 | 78.6 | 85.1 | 73.6 | 80.9 | 79.6 | 79.6 | 79.6 | 78.5 | 75.5 | 76.4 | 1.6 |
| Previous estimates | 79.7 | 79.7 | 79.6 | 78.7 | 76.4 | ||||||||
| Manufacturing (see note below) | 79.7 | 85.4 | 77.1 | 84.6 | 71.5 | 79.3 | 77.6 | 77.4 | 77.2 | 76.4 | 73.5 | 73.8 | 1.8 |
| Previous estimates | 77.6 | 77.5 | 77.3 | 76.6 | 74.5 | ||||||||
| Mining | 87.5 | 86.3 | 83.6 | 88.7 | 84.8 | 88.7 | 90.8 | 90.8 | 92.1 | 91.8 | 84.0 | 89.0 | .7 |
| Utilities | 86.8 | 92.7 | 84.1 | 93.9 | 84.6 | 86.0 | 84.5 | 85.9 | 85.2 | 81.5 | 83.3 | 83.5 | 2.2 |
| Stage-of-process groups | |||||||||||||
| Crude | 86.6 | 88.3 | 84.4 | 89.5 | 81.9 | 87.8 | 89.6 | 88.8 | 89.7 | 89.4 | 80.1 | 85.6 | .6 |
| Primary and semifinished | 82.2 | 86.4 | 77.8 | 88.2 | 74.6 | 81.4 | 79.6 | 79.6 | 79.3 | 77.9 | 75.9 | 76.5 | 1.9 |
| Finished | 77.7 | 82.8 | 77.1 | 80.4 | 69.9 | 77.6 | 75.9 | 76.1 | 76.0 | 75.1 | 73.3 | 72.7 | 1.8 |
Market Groups
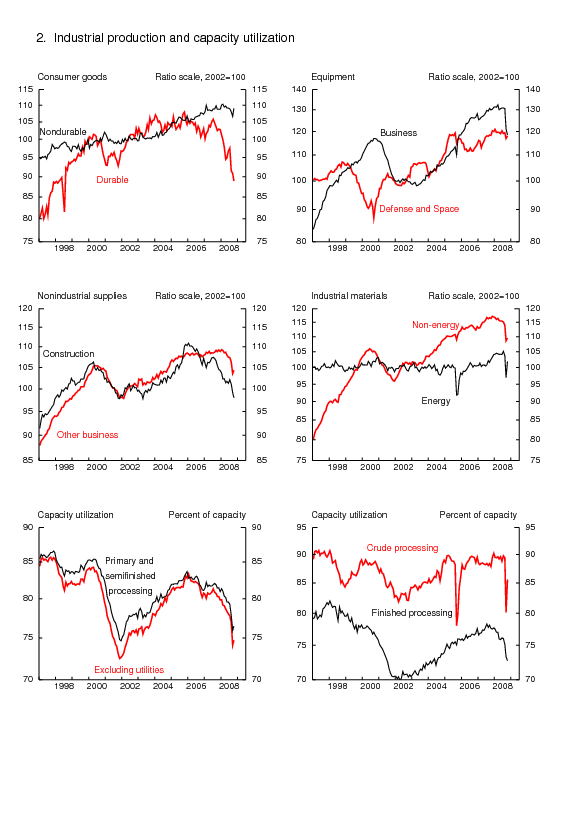
The production of consumer goods increased 1.3 percent in October. The output of durable goods moved down 2.1 percent, while the output of nondurable goods rose 2.2 percent. Among consumer durable goods, the index for automotive products dropped 3.6 percent. The production of appliances, furniture, and carpeting fell 1.1 percent, and the output of home electronics edged down 0.2 percent. The output of miscellaneous goods declined 0.7 percent. Among consumer nondurable goods, the production of consumer energy products jumped 6.9 percent, as the output of gasoline and distillate fuels recovered after the hurricanes. Non-energy consumer nondurable goods increased 0.3 percent. The indexes for foods and tobacco and for paper products moved higher, while the indexes for chemical products and for clothing decreased.
The output of business equipment fell 2.2 percent in October. The production of transit equipment, after plunging more than 30 percent in September, fell an additional 10 percent in October because of the effects of the strike in the commercial aircraft industry, which concluded around the end of the month. The index for industrial and other equipment moved down 1.7 percent, partly because of declines in construction machinery and in office furniture. The index for information processing equipment edged down 0.2 percent after a decline of 0.9 percent in September.
The output of defense and space equipment increased 1.0 percent in October after having fallen 2.0 percent in September; military shipbuilding had been curtailed in September by the hurricanes in the Gulf region. On net, output in October was little changed from its level 12 months earlier.
Among nonindustrial supplies, the production of construction supplies decreased 1.1 percent in October, partly because of drops in construction steel and in architectural and structural metals. The index for business supplies rose 0.7 percent but was more than 4 percent below its year-earlier level.
The output of materials gained 2.3 percent in October. The ongoing recovery after the hurricanes in natural gas and crude oil extraction contributed to an increase of 5.2 percent in the production of energy materials. The production of durable materials dropped 1.7 percent, with declines in all its major components. The production of nondurable materials rose 4.6 percent after a drop of 8.8 percent in September. In October, the index for textile materials fell 1.0 percent, the index for paper materials declined 0.7 percent, and the index for chemical materials increased 10.6 percent. The gain in chemical materials followed a drop of 15.8 percent in September. Large decreases in organic chemicals and plastic resins contributed significantly to the September plunge. Although the drop for organic chemicals was mostly hurricane related, only a portion of the drop for resins was attributable to the storms.
Industry Groups
Manufacturing output rose 0.6 percent in October after a decline of 3.7 percent in September. Excluding the effects of the hurricanes and the aircraft strike, factory production is estimated to have declined about 1 percent in both months. The factory operating rate stood at 73.8 percent in October and was about 6 percentage points below its 1972-2007 average. The production of durable goods industries decreased 1.8 percent in October, with declines widespread among its components. In addition to a particularly large drop in primary metals, which was due to lower production of iron and steel, decreases also occurred in most other durable goods industries. Only the index for electrical equipment, appliances, and components moved up. The production of nondurable goods rose 3.1 percent after a decline of 4.5 percent in September. The results for its major components were mixed in October. The output of petroleum and coal products jumped 9.9 percent, as refinery output recovered from the post-hurricane levels. Gains were also recorded in food, beverage, and tobacco products and in chemicals. However, the indexes for textile and product mills, apparel and leather, paper, printing, and plastics and rubber products all declined.
The index for other manufacturing (that is, industries formerly considered manufacturing but not classified as manufacturing under the North American Industry Classification System, or NAICS), which consists of publishing and logging declined 0.4 percent in October, its tenth consecutive monthly decrease.
Capacity utilization rates at industries grouped by stage of process were as follows: At the crude stage,
utilization recovered 5.5 percentage points in October, to 85.6 percent, a rate 1.0 percentage point below
its 1972-2007 average; for the primary and semifinished stages, utilization moved back up 0.6 percentage
point, to 76.5 percent, a rate 5.7 percentage points below its long-run average; and for the finished
stage, utilization declined 0.6 percentage point, to 72.7 percent, a rate 5.0 percentage points below its
long-run average.
The Federal Reserve Board plans to issue its annual revision to the index of industrial production (IP)
and the related measures of capacity utilization in late March of 2009. The revised IP indexes will
incorporate data from selected editions of the U.S. Census Bureau's 2007 Current Industrial Reports.
Detailed data from the 2007 Economic Census, however, are not expected to be available. Annual data from
the U.S. Geological Survey regarding metallic and nonmetallic minerals (except fuels) for 2007 will also be
incorporated. The updating will include revisions to the monthly indicator (either product data or input
data) and to seasonal factors for each industry as well as changes in the estimation methods for some
series. Any changes to the methods for estimating the output of an industry will affect the index from
1972 to the present.
Capacity and capacity utilization will be revised to incorporate data from the Census Bureau's Quarterly
Survey of Plant Capacity, which covers manufacturing, along with new data on capacity from the U.S.
Geological Survey, the Department of Energy, and other organizations.
Once the revision is published, it will be available on the Board's website at
www.federalreserve.gov/releases/G17. The revised data will also be available through the website of the
Department of Commerce. Further information on the revision can be obtained from the Board's Industrial
Output Section (telephone number 202-452-3197).
Note. The statistics in this release cover output, capacity, and capacity utilization in the
U.S. industrial sector, which is defined by the Federal Reserve to comprise manufacturing,
mining, and electric and gas utilities. Mining is defined as all industries in sector 21 of the
North American Industry Classification System (NAICS); electric and gas utilities are those in
NAICS sectors 2211 and 2212. Manufacturing comprises NAICS manufacturing industries (sector 31-33)
plus the logging industry and the newspaper, periodical, book, and directory publishing industries.
Logging and publishing are classified elsewhere in NAICS (under agriculture and information
respectively), but historically they were considered to be manufacturing and were included in
the industrial sector under the Standard Industrial Classification (SIC) system. In December 2002
the Federal Reserve reclassified all its industrial output data from the SIC system to NAICS.
Revision of Industrial Production and Capacity Utilization
G.17 Release Tables:
| Ascii | Screen reader | Summary: Industrial Production and Capacity Utilization | Chart | Chart 1: Industrial Production, Capacity, and Capacity Utilization | Chart | Chart 2: Industrial Production and Capacity Utilization | Chart | Chart 3: Industrial Production and Capacity Utilization, High Technology Industries |
| Ascii | Screen reader | Table 1: Industrial Production: Market and Industry Groups (percent change) |
| Ascii | Screen reader | Table 2: Industrial Production: Special Aggregates and Selected Detail (percent change) |
| Ascii | Screen reader | Table 3: Motor Vehicle Assemblies |
| Ascii | Screen reader | Table 4: Industrial Production Indexes: Market and Industry Group Summary |
| Ascii | Screen reader | Table 5: Industrial Production Indexes: Special Aggregates |
| Ascii | Screen reader | Table 6: Diffusion Indexes of Industrial Production |
| Ascii | Screen reader | Table 7: Capacity Utilization: Manufacturing, Mining, and Utilities |
| Ascii | Screen reader | Table 8: Industrial Capacity: Manufacturing, Mining, and Utilities (percent change) |
| Ascii | Screen reader | Table 9: Industrial Production: Gross Value of Products and Nonindustrial Supplies |
| Ascii | Screen reader | Table 10: Gross-Value-Weighted Industrial Production: Stage-of-Process Groups |
| Ascii | Screen reader | Table 11: Historical Statistics for IP, Capacity, and Utilization: Total Industry |
| Ascii | Screen reader | Table 12: Historical Statistics for IP, Capacity, and Utilization: Manufacturing |
| Ascii | Screen reader | Table 13: Historical Statistics for IP, Capacity, and Utilization: Total Industry excluding Selected High-Technology Industries |
| Ascii | Screen reader | Table 14: Historical Statistics for IP, Capacity, and Utilization: Manufacturing excluding Selected High-Technology Industries |