
Release Date: November 15, 2002
Release dates | Historical data | Documentation
Current Monthly Release Other formats: ASCII | PDF (144 KB)
Supplemental Monthly Release Other formats: ASCII | PDF (144 KB)
Annual Revision Release Other formats: ASCII | PDF (150 KB)
INDUSTRIAL PRODUCTION AND CAPACITY UTILIZATION
[2002 Revision Notice Below]
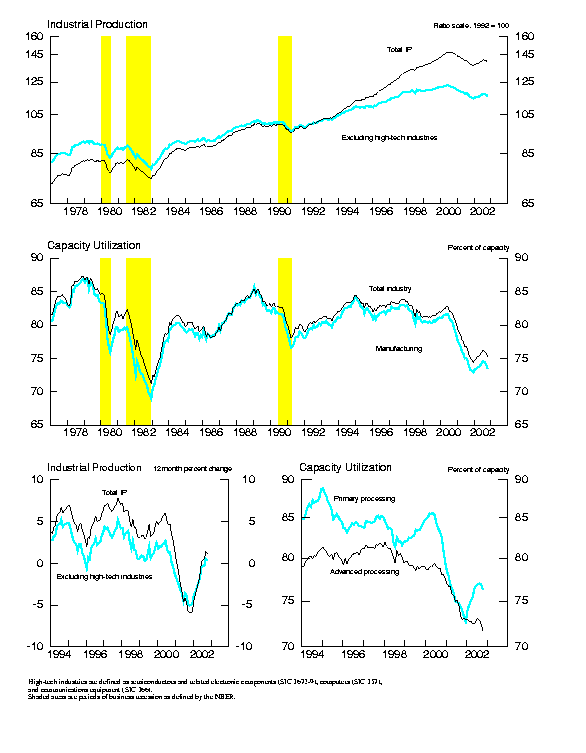
Industrial production fell 0.8 percent in October. At 139.3 percent of its 1992 average, the October index was just 1.2 percent higher than its year-ago level. Manufacturing output decreased 0.7 percent in October. The recent lockout at the West Coast ports apparently accounted for only a small portion of this decline. Mining output fell 1.0 percent, as storm-related disruptions in the Gulf Coast region curtailed the output of crude oil and natural gas. Utilities production declined 1.6 percent. The rate of capacity utilization for total industry fell 0.6 percentage point, to 75.2 percent, a level 6.7 percentage points below its 1967-2001 average.
 INDUSTRIAL PRODUCTION AND CAPACITY UTILIZATION:  SUMMARY
 Seasonally adjusted
 -----------------------------------------------------------------------------------------------------------------------------------
                               |                    1992=100                     |                  Percent change
                               | ----------------------------------------------- | -------------------------------------------------
                               |       2002                                      |   2002                          |    Oct. '01 to
 Industrial production         |       July        Aug.       Sept.        Oct.  |   July    Aug.   Sept.    Oct.  |      Oct. '02
 -----------------------------------------------------------------------------------------------------------------------------------
                               |                                                 |                                 |
  Total index                  |      141.0       140.7       140.4       139.3  |     .5     -.2     -.2     -.8  |            1.2
     Previous estimates        |      141.1       140.6       140.5              |     .5     -.3     -.1          |
                               |                                                 |                                 |
  Major market groups:         |                                                 |                                 |
  Products, total              |      128.5       128.1       127.8       126.7  |     .4     -.3     -.3     -.9  |            -.1
     Consumer goods            |      123.1       121.8       121.6       120.7  |     .7    -1.1     -.1     -.8  |             .9
     Business equipment        |      163.8       164.7       162.3       159.1  |     .0      .5    -1.5    -2.0  |           -4.6
     Construction supplies     |      138.5       140.3       140.6       139.7  |   -1.4     1.3      .2     -.6  |            3.8
  Materials                    |      162.5       162.4       162.2       161.0  |     .7      .0     -.1     -.7  |            3.3
                               |                                                 |                                 |
  Major industry groups:       |                                                 |                                 |
  Manufacturing                |      145.6       145.5       144.9       143.9  |     .4     -.1     -.4     -.7  |            1.3
     Durable                   |      180.3       181.3       180.2       178.1  |     .3      .5     -.6    -1.2  |            2.4
     Nondurable                |      111.9       111.1       110.9       110.7  |     .5     -.7     -.2     -.2  |            -.1
  Mining                       |       95.9        96.3        95.7        94.8  |    -.1      .4     -.6    -1.0  |           -4.7
  Utilities                    |      127.8       124.6       127.6       125.6  |    2.3    -2.5     2.4    -1.6  |            5.2
 -----------------------------------------------------------------------------------------------------------------------------------
                               |                                                                                   |    Capacity
                               |                                Percent of capacity                                |     growth
                               | --------------------------------------------------------------------------------- | ---------------
                               |     Average        1982     1988-89       2001  |   2002                          |    Oct. '01 to
 Capacity utilization          |  1967-2001          Low        High       Oct.  |   July    Aug.   Sept.    Oct.  |      Oct. '02
 -----------------------------------------------------------------------------------------------------------------------------------
                               |                                                 |                                 |
  Total industry               |       81.9        71.1        85.4        75.0  |   76.3    76.1    75.8    75.2  |            1.0
     Previous estimates        |                                                 |   76.3    76.0    75.9          |
                               |                                                 |                                 |
  Manufacturing                |       80.9        69.0        85.7        73.3  |   74.6    74.5    74.1    73.5  |            1.0
     Advanced processing       |       80.3        71.0        84.2        72.9  |   73.1    72.8    72.4    71.7  |             .6
     Primary processing        |       82.0        65.7        88.3        73.9  |   76.9    77.0    76.8    76.3  |            1.6
  Mining                       |       87.6        80.3        88.0        88.4  |   85.0    85.3    84.8    83.9  |             .4
  Utilities                    |       87.6        75.9        92.6        85.7  |   88.8    86.4    88.2    86.6  |            4.1
 -----------------------------------------------------------------------------------------------------------------------------------
 Note:  Estimates for October are preliminary.  Estimates from July to September are revised.
Market Groups
The output of consumer goods decreased 0.8 percent in October, its third consecutive monthly decline. The production of durable consumer goods fell 2.5 percent; a 4.4 percent decline in the output of automotive products accounted for much of the drop. The production of appliances and furniture also decreased, while the output of home electronics products and of miscellaneous goods rose. The production of nondurable consumer goods fell 0.3 percent; the index for non-energy nondurables edged down 0.1 percent, and the index for consumer energy products fell 1.5 percent. Among non-energy nondurables, declines in the output of clothing, paper products, and chemical products slightly more than offset a rise in the production of foods and tobacco.
The production of business equipment dropped 2.0 percent in October after having declined 1.5 percent in September. A 6.5 percent drop in the output of transit equipment was largely responsible for the October decline, and the main contributor was a reduction in the production of motor vehicles. In addition, the production of industrial and other equipment contracted 1.4 percent; most industries within the category posted declines. Continued weakness in the output of information processing equipment largely reflected ongoing declines in the communications industry. The index for defense and space equipment rose 0.9 percent and was 6.6 percent above its level of a year ago. The output of construction supplies decreased 0.6 percent. The output of business supplies dipped 0.3 percent, primarily because of a weakening in the production of commercial energy products.
The output of industrial materials fell 0.7 percent. The drop was the largest since December 2001, and production declined in all of the major categories. Among durable materials, the output of consumer parts dropped 2.0 percent, and equipment parts and other materials fell slightly. Production in the major categories of nondurable materials--textile, paper, and chemical--declined last month.
Industry Groups
Manufacturing output moved down 0.7 percent; the index for durable goods decreased 1.2 percent, and the index for nondurables slipped 0.2 percent. The largest decline among major durable goods industries was in motor vehicles and parts, which dropped 5.2 percent; about one-third of the decline was due to parts shortages resulting from effects of the port shutdowns on the West Coast. The production of furniture and fixtures, industrial machinery and equipment, and lumber and products registered sizable declines. The losses for industrial machinery included reductions in construction equipment and in engines primarily used in medium and heavy trucks and in off-highway equipment. The index for computers, however, posted a gain for a fourth consecutive month. The increases in the computer index in the third quarter were revised upward. A rise in the output of primary metals reversed much of September's loss, and was led by an increase in steel production. The decline in nondurable goods comprised an increase in the production of food and tobacco products that was more than offset by declines in the production of most other major nondurables industries, especially chemicals and products and paper and products.
The factory operating rate in October was 73.5 percent, 7.4 percentage points below its 1967-2001 average. The utilization rates for advanced processing and primary processing fell in October. The operating rate at mines decreased 0.9 percentage point to 83.9 percent, and the rate at utilities declined 1.6 percentage points, to 86.6 percent.
| Ascii | Screen reader | Summary: Industrial Production and Capacity Utilization | Chart | Chart 1: Industrial Production and Capacity Utilization |
| Ascii | Screen reader | Table 1:Industrial Production: Market and Industry Groups (percent change) |
| Ascii | Screen reader | Table 2:Industrial Production: Special Aggregates and Selected Detail (percent change) |
| Ascii | Screen reader | Table 3: Motor Vehicle Assemblies |
| Ascii | Screen reader | Table 4: Industrial Production Indexes: Market and Industry Group Summary |
| Ascii | Screen reader | Table 5: Industrial Production Indexes: Special Aggregates |
| Ascii | Screen reader | Table 6: Capacity Utilization: Manufacturing, Mining, and Utilities |
| Ascii | Screen reader | Table 7: Industrial Capacity: Manufacturing, Mining, and Utilities (percent change) |
| Ascii | Screen reader | Table 8: Industrial Production: Gross Value of Products |
| Ascii | Screen reader | Table 9: Diffusion Indexes of Industrial Production |
| Ascii | Screen reader | Table 10: Electric Power Use: Manufacturing and Mining |
| Ascii | Screen reader | Table 11: Historical Statistics for IP, Capacity, and Utilization: Total Industry |
| Ascii | Screen reader | Table 12: Historical Statistics for IP, Capacity, and Utilization: Manufacturing |
| Ascii | Screen reader | Table 13: Historical Statistics for IP, Capacity, and Utilization: Total Industry excluding Selected High-Technology Industries |
| Ascii | Screen reader | Table 14: Historical Statistics for IP, Capacity, and Utilization: Manufacturing excluding Selected High-Technology Industries |
Release dates | Historical data | Documentation
Current Monthly Release Other formats: ASCII | PDF (144 KB)
Supplemental Monthly Release Other formats: ASCII | PDF (144 KB)
Annual Revision Release Other formats: ASCII | PDF (150 KB)