
INDUSTRIAL PRODUCTION AND CAPACITY UTILIZATION
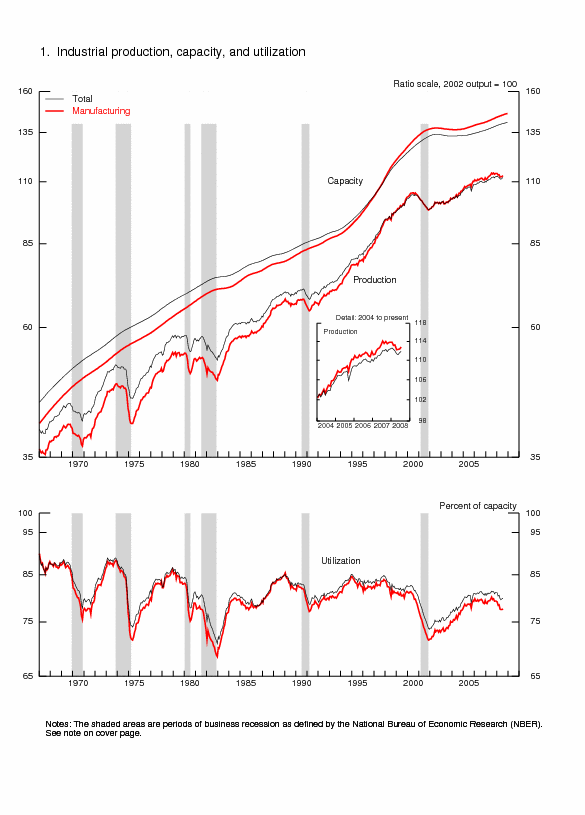
Industrial production increased 0.2 percent in July after having advanced 0.4 percent in June.
Manufacturing output gained 0.4 percent in July and was boosted by a rise of 3.6 percent in the production
of motor vehicles and parts. Excluding motor vehicles and parts, the index for manufacturing increased 0.2
percent. The output of mines moved up 0.9 percent, while the output of utilities contracted 1.9 percent.
At 111.8 percent of its 2002 average, total industrial production was 0.1 percent below its level of a year
earlier. In July, the capacity utilization rate for total industry edged up to 79.9 percent, a level 1.1
percentage points below its average for 1972-2007.
| Industrial production |
2002=100 | Percent change | |||||||||||
|---|---|---|---|---|---|---|---|---|---|---|---|---|---|
| 2008 | 2008 | July '07 to July '08 |
|||||||||||
| Feb.[r] | Mar.[r] | Apr.[r] | May[r] | June[r] | July[p] | Feb.[r] | Mar.[r] | Apr.[r] | May[r] | June[r] | July[p] | ||
| Total index | 112.3 | 112.0 | 111.3 | 111.1 | 111.6 | 111.8 | -.3 | -.2 | -.6 | -.2 | .4 | .2 | -.1 |
| Previous estimates | 112.2 | 112.2 | 111.4 | 111.2 | 111.7 | -.4 | .1 | -.7 | -.2 | .5 | |||
| Major market groups | |||||||||||||
| Final Products | 113.8 | 113.1 | 112.1 | 112.0 | 112.8 | 113.2 | -.2 | -.6 | -.9 | -.1 | .7 | .4 | -.4 |
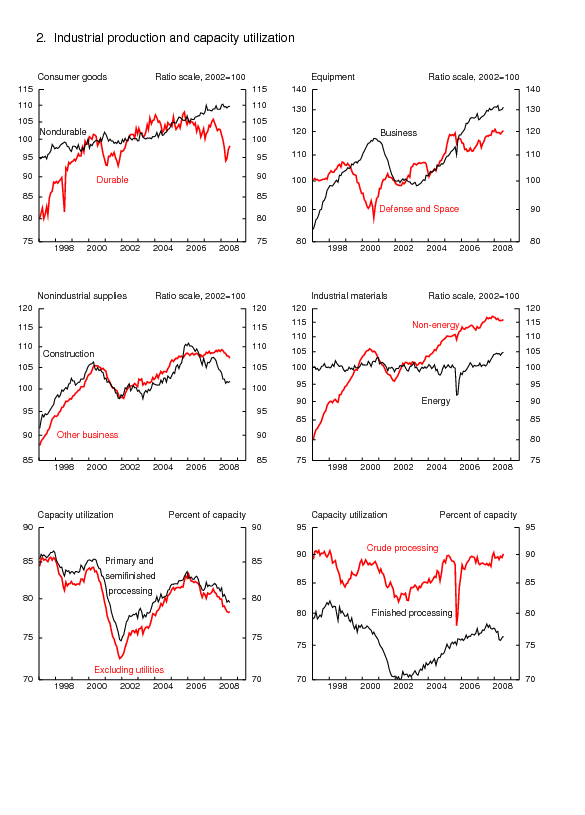
| Consumer goods | 107.9 | 106.7 | 106.0 | 105.8 | 106.7 | 107.0 | -.1 | -1.1 | -.7 | -.2 | .8 | .3 | -1.1 |
| Business equipment | 131.1 | 132.0 | 129.5 | 129.8 | 130.1 | 131.1 | -.2 | .7 | -1.9 | .3 | .2 | .8 | 1.2 |
| Nonindustrial supplies | 107.2 | 106.7 | 106.3 | 106.0 | 106.0 | 105.7 | -.5 | -.4 | -.4 | -.3 | -.1 | -.3 | -2.3 |
| Construction | 102.3 | 102.3 | 101.3 | 101.7 | 101.5 | 101.7 | -1.3 | .0 | -1.0 | .4 | -.2 | .3 | -5.3 |
| Materials | 112.6 | 112.8 | 112.4 | 112.1 | 112.5 | 112.7 | -.3 | .2 | -.3 | -.3 | .3 | .3 | .8 |
| Major industry groups | |||||||||||||
| Manufacturing (see note below) | 113.1 | 113.2 | 112.2 | 112.3 | 112.4 | 112.8 | -.6 | .1 | -.9 | .0 | .1 | .4 | -1.1 |
| Previous estimates | 113.1 | 113.4 | 112.3 | 112.3 | 112.5 | -.7 | .2 | -.9 | -.1 | .2 | |||
| Mining | 103.6 | 103.9 | 103.9 | 103.9 | 104.8 | 105.8 | .4 | .2 | .0 | .1 | .9 | .9 | 4.2 |
| Utilities | 112.6 | 108.7 | 110.4 | 107.9 | 110.3 | 108.3 | 1.6 | -3.5 | 1.6 | -2.2 | 2.3 | -1.9 | 2.5 |
| Capacity utilization |
Percent of capacity |
Capacity growth |
|||||||||||
|---|---|---|---|---|---|---|---|---|---|---|---|---|---|
| Average 1972- 2007 |
1988- 89 high |
1990- 91 low |
1994- 95 high |
2001- 02 low |
2007 July |
||||||||
| 2008 | July '07 to July '08 |
||||||||||||
| Feb.[r] | Mar.[r] | Apr.[r] | May[r] | June[r] | July[p] | ||||||||
| Total industry | 81.0 | 85.0 | 78.6 | 85.1 | 73.6 | 81.4 | 80.3 | 80.5 | 79.8 | 79.6 | 79.8 | 79.9 | 1.7 |
| Previous estimates | 80.3 | 80.5 | 79.9 | 79.6 | 79.9 | ||||||||
| Manufacturing (see note below) | 79.7 | 85.4 | 77.1 | 84.6 | 71.5 | 80.1 | 78.4 | 78.5 | 77.6 | 77.5 | 77.5 | 77.7 | 1.9 |
| Previous estimates | 78.4 | 78.5 | 77.7 | 77.6 | 77.6 | ||||||||
| Mining | 87.5 | 86.3 | 83.6 | 88.7 | 84.8 | 89.2 | 90.5 | 90.5 | 90.6 | 90.6 | 91.4 | 92.1 | .9 |
| Utilities | 86.8 | 92.7 | 84.1 | 93.9 | 84.6 | 84.2 | 85.8 | 86.7 | 86.5 | 84.4 | 86.2 | 84.4 | 2.2 |
| Stage-of-process groups | |||||||||||||
| Crude | 86.6 | 88.3 | 84.4 | 89.5 | 81.9 | 88.4 | 89.4 | 89.6 | 89.1 | 89.7 | 89.4 | 90.1 | .7 |
| Primary and semifinished | 82.2 | 86.4 | 77.8 | 88.2 | 74.6 | 81.9 | 80.3 | 80.6 | 80.2 | 79.6 | 79.8 | 79.5 | 2.2 |
| Finished | 77.7 | 82.8 | 77.1 | 80.4 | 69.9 | 78.3 | 77.0 | 77.1 | 75.9 | 75.7 | 76.1 | 76.4 | 1.9 |
Market Groups
The production of consumer goods increased 0.3 percent in July. The output of durable consumer goods rose 1.0 percent; an increase of 2.5 percent in the index for automotive products was partly offset by drops in the indexes for appliances, furniture, and carpeting and for home electronics. The index for miscellaneous consumer goods was unchanged. The production of nondurable consumer goods edged up 0.1 percent in July; the increase reflected a rise in the output of consumer energy goods, particularly gasoline. Non-energy nondurable consumer goods declined 0.2 percent; lower indexes for foods and tobacco, clothing, and paper products more than offset an increase in the output of chemical products.
The output of business equipment climbed 0.8 percent in July. Production of transit equipment jumped 2.8 percent, and the output of industrial and other equipment rose 0.6 percent, an increase that reversed its June decline. The index for information processing and related equipment slipped 0.2 percent. The output of defense and space equipment gained 0.6 percent.
The production of construction supplies increased 0.3 percent. On net, the output of construction supplies advanced over the past three months; its average monthly decrease over the preceding nine months had been about 0.7 percent. The index for business supplies fell 0.5 percent in July.
Materials output moved up 0.3 percent in July following a similarly sized increase in June. The production of durable materials advanced 0.6 percent, and gains were widespread across its components. Consumer parts showed the largest advance, 2.1 percent, as the output of motor vehicle parts rose markedly. The production of nondurable materials edged down 0.1 percent, with declines in textile materials and paper materials partly offset by an increase in chemical materials. The index for energy materials rose 0.2 percent.
Industry Groups
Production in manufacturing advanced 0.4 percent in July. The factory operating rate increased to 77.7 percent, a level 2.0 percentage points below its 1972-2007 average. The production of durable goods rose 0.6 percent, and gains were widespread. The largest increase in July was for motor vehicles and parts, which advanced for a third consecutive month; nevertheless, this index remained 10.4 percent below its year-earlier level. The only durable goods industries to have registered declines in July were wood products, fabricated metal products, and furniture and related products. The output of nondurable goods rose 0.3 percent. Declines in the indexes for food, beverage, and tobacco products; textile and product mills; apparel and leather products; paper; and printing and support were more than offset by higher output of petroleum and coal products, chemicals, and plastics and rubber products.
The index for non-NAICS manufacturing industries (logging and publishing) fell 1.3 percent. Production in publishing has fallen nearly 7 percent in the past 12 months.
The output of electric and gas utilities dropped 1.9 percent in July, and the operating rate for utilities decreased 1.8 percentage points, to 84.4 percent, a rate 2.4 percentage points below its 1972-2007 average. Mining production increased 0.9 percent. Capacity utilization for mining rose to 92.1 percent, a rate just above the peak attained in 2000-01 and just below the peak in January 1998. Within mining, the rate of capacity utilization in oil and gas extraction was particularly high.
Capacity utilization rates at industries grouped by stage of process were as follows: For the crude stage, utilization rose 0.7 percentage point, to 90.1 percent, a rate 3.5 percentage points above its 1972-2007 average; for the primary and semifinished stages, utilization moved down 0.3 percentage point, to 79.5 percent, a rate 2.7 percentage points below its long-run average; and for the finished stage, utilization increased 0.3 percentage point, to 76.4 percent, a rate 1.3 percentage points below its long-run average.
Note. The statistics in this release cover output, capacity, and capacity utilization in the
U.S. industrial sector, which is defined by the Federal Reserve to comprise manufacturing,
mining, and electric and gas utilities. Mining is defined as all industries in sector 21 of the
North American Industry Classification System (NAICS); electric and gas utilities are those in
NAICS sectors 2211 and 2212. Manufacturing comprises NAICS manufacturing industries (sector 31-33)
plus the logging industry and the newspaper, periodical, book, and directory publishing industries.
Logging and publishing are classified elsewhere in NAICS (under agriculture and information
respectively), but historically they were considered to be manufacturing and were included in
the industrial sector under the Standard Industrial Classification (SIC) system. In December 2002
the Federal Reserve reclassified all its industrial output data from the SIC system to NAICS.
G.17 Release Tables:
| Ascii | Screen reader | Summary: Industrial Production and Capacity Utilization | Chart | Chart 1: Industrial Production, Capacity, and Capacity Utilization | Chart | Chart 2: Industrial Production and Capacity Utilization | Chart | Chart 3: Industrial Production and Capacity Utilization, High Technology Industries |
| Ascii | Screen reader | Table 1: Industrial Production: Market and Industry Groups (percent change) |
| Ascii | Screen reader | Table 2: Industrial Production: Special Aggregates and Selected Detail (percent change) |
| Ascii | Screen reader | Table 3: Motor Vehicle Assemblies |
| Ascii | Screen reader | Table 4: Industrial Production Indexes: Market and Industry Group Summary |
| Ascii | Screen reader | Table 5: Industrial Production Indexes: Special Aggregates |
| Ascii | Screen reader | Table 6: Diffusion Indexes of Industrial Production |
| Ascii | Screen reader | Table 7: Capacity Utilization: Manufacturing, Mining, and Utilities |
| Ascii | Screen reader | Table 8: Industrial Capacity: Manufacturing, Mining, and Utilities (percent change) |
| Ascii | Screen reader | Table 9: Industrial Production: Gross Value of Products and Nonindustrial Supplies |
| Ascii | Screen reader | Table 10: Gross-Value-Weighted Industrial Production: Stage-of-Process Groups |
| Ascii | Screen reader | Table 11: Historical Statistics for IP, Capacity, and Utilization: Total Industry |
| Ascii | Screen reader | Table 12: Historical Statistics for IP, Capacity, and Utilization: Manufacturing |
| Ascii | Screen reader | Table 13: Historical Statistics for IP, Capacity, and Utilization: Total Industry excluding Selected High-Technology Industries |
| Ascii | Screen reader | Table 14: Historical Statistics for IP, Capacity, and Utilization: Manufacturing excluding Selected High-Technology Industries |