
INDUSTRIAL PRODUCTION AND CAPACITY UTILIZATION
INDUSTRIAL PRODUCTION AND CAPACITY UTILIZATION
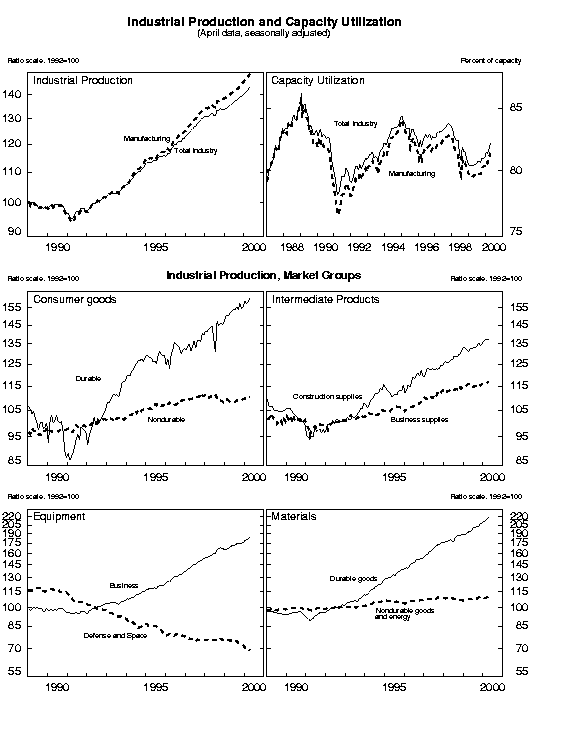
Industrial production increased 0.9 percent in April after an upward-revised increase of 0.7 percent in March. Manufacturing output increased 0.8 percent, with most major industries posting gains. The output of utilities rebounded 2.8 percent, while output for mining rose 0.4 percent. At 143.7 percent of its 1992 average, industrial production in April was 6.1 percent higher than in April 1999. The rate of capacity utilization for total industry rose 0.4 percentage point, to 82.1 percent, a level about even with the average for 1967 to 1999.
 INDUSTRIAL PRODUCTION AND CAPACITY UTILIZATION:  SUMMARY
 Seasonally adjusted
                               |             Index, 1992=100             |                 Percent change
                               |     2000                                |   2000                          |  Apr. 99 to
 Industrial Production         |     Jan.      Feb.      Mar.      Apr.  |   Jan.    Feb.    Mar.    Apr.  |   Apr. 00
 ------------------------------------------------------------------------------------------------------------------------
                               |                                         |                                 |
  Total index                  |    141.1     141.4     142.4     143.7  |     .7      .2      .7      .9  |         6.1
     Previous estimates        |    141.5     141.6     142.0            |    1.0      .1      .3          |
                               |                                         |                                 |
 Major market groups:          |                                         |                                 |
     Products, total           |    129.7     129.9     130.4     131.3  |     .9      .2      .4      .7  |         4.1
        Consumer goods         |    118.8     118.8     118.9     119.6  |     .6      .0      .0      .6  |         2.7
        Business equipment     |    179.4     180.2     182.4     184.9  |    2.2      .5     1.3     1.3  |         9.1
        Construction supplies  |    136.4     137.1     137.6     137.5  |    1.1      .5      .4     -.1  |         4.7
     Materials                 |    160.5     160.7     162.8     164.8  |     .5      .1     1.3     1.2  |         9.3
                               |                                         |                                 |
 Major industry groups:        |                                         |                                 |
     Manufacturing             |    146.7     147.0     148.3     149.5  |     .8      .2      .9      .8  |         6.6
        Durable                |    181.0     181.5     184.0     186.1  |    1.5      .2     1.4     1.2  |         9.9
        Nondurable             |    113.5     113.7     113.9     114.3  |    -.2      .1      .2      .3  |         2.5
     Mining                    |     99.7      99.3     100.3     100.7  |     .2     -.5     1.0      .4  |         4.1
     Utilities                 |    114.6     115.0     112.9     116.0  |     .9      .4    -1.8     2.8  |         -.2
 ------------------------------------------------------------------------------------------------------------------------
                               |                                                                           |   Capacity
                               |                            Percent of Capacity                            |    Growth
                               |   Average      1982   1988-89     1999  |   2000                          |  Apr. 99 to
 Capacity Utilization          |  1967-99        Low      High     Apr.  |   Jan.    Feb.    Mar.    Apr.  |   Apr. 00
 ------------------------------------------------------------------------------------------------------------------------
                               |                                         |                                 |
  Total industry               |     82.0      71.1      85.4      80.4  |   81.4    81.3    81.7    82.1  |         3.8
     Previous estimates        |                                         |   81.6    81.5    81.4          |
                               |                                         |                                 |
     Manufacturing             |     81.1      69.0      85.7      79.5  |   80.7    80.6    81.0    81.4  |         4.2
        Advanced processing    |     80.5      70.4      84.2      78.5  |   79.7    79.6    80.1    80.4  |         5.2
        Primary processing     |     82.4      66.2      88.9      82.6  |   83.9    83.5    84.0    84.3  |         1.9
     Mining                    |     87.3      80.3      88.0      80.4  |   83.1    82.9    83.8    84.2  |         -.7
     Utilities                 |     87.5      75.9      92.6      91.4  |   89.2    89.4    87.7    90.1  |         1.3
 ------------------------------------------------------------------------------------------------------------------------
 Note:  Estimates for April are preliminary.  Estimates from January to March are revised.
Market Groups
The output of consumer goods, which had been flat during February and March, increased 0.6 percent in April. The output of durable consumer goods, which increased 1.4 percent, was boosted by a further rebound in the production of automotive products since the dip in February. The production of other durable consumer goods increased 0.6 percent, a rate about in line with the average for the previous three months; ongoing strength in the production of video and audio equipment and computers more than offset a 3.9 percent fall in the output of appliances. The production of nondurable consumer goods rose 0.4 percent and was led by a sharp rebound in the output of energy products; the output of nondurable non-energy consumer products rose 0.2 percent after having edged down in March.
The production of business equipment rose 1.3 percent in March and again in April, a rate close to the average pace over the January-February period. The production of information processing and related equipment increased 1.6 percent in April, led by continued gains in the output of computers and communication equipment. The output of industrial equipment was up 0.7 percent, with increases widespread among the component series. The production index for the "other equipment" category rose 3.9 percent, after having risen 3.4 percent in March; the recent surge in the output of this industry group reflects the continued recovery in the production of farm machinery and equipment after a significant contraction during the middle of 1999. The output of transit equipment edged up 0.2 percent, as a rebound in assemblies of light vehicles more than offset declines in the production of medium and heavy trucks and of commercial aircraft and equipment.
The production of construction supplies, which increased an average of 0.7 percent per month in the first quarter, edged down 0.1 percent in April but remained more than 4-1/2 percent above its level a year ago. The output of materials gained 1.2 percent in April. The output of durable goods materials rose 1.3 percent, with another strong increase in equipment parts, particularly semiconductors. The output of energy materials rose 1.4 percent, while the production of nondurable goods materials gained 0.7 percent.
Industry Groups
Manufacturing output rose 0.8 percent in April; most major industries posted gains. Production in durable manufacturing industries increased 1.2 percent after a 1.4 percent increase in March. The production of electrical machinery rose 2 percent, led by a 3 percent gain in the output of semiconductors and related equipment; semiconductor output increased about 5-1/2 percent per month during the first quarter. The production of industrial machinery and equipment (which includes computers) increased 1-1/2 percent in April, a rate about equaling the average pace in the preceding two months. In contrast, the output of aircraft and parts continued to decline, in part because of a strike at a producer of military aircraft.
After having changed little in the first quarter, production in nondurable manufacturing increased 0.3 percent in April to a level 2-1/2 percent higher than in April 1999. Among nondurable manufacturing industries, the only substantial output decline occurred in the petroleum products industry.
The factory operating rate rose to 81.4 percent in April, rising above its 1967-99 average for the first time since May 1998. Utilization in primary-processing industries increased to 84.3 percent, while that for advanced-processing industries advanced to 80.4 percent.
Output at utilities, which had fallen back 1.8 percent in March, was up 2.8 percent in April; the operating rate at utilities rose to 90.1 percent. Production at mines increased 0.4 percent after having risen 1 percent in March. The utilization rate at mines increased to 84.2 percent but remained noticeably below its long-term average.
G.17 Release Tables: