
Release Date: November 17, 2004
Release dates | Historical data | Documentation
Current Monthly Release Other formats: ASCII | PDF (144 KB)
Supplemental Monthly Release Other formats: ASCII | PDF (144 KB)
Annual Revision Release Other formats: ASCII | PDF (150 KB)
| Industrial production |
1997=100 | Percent change | |||||||
|---|---|---|---|---|---|---|---|---|---|
| 2004 | 2004 | Oct. '03 to Oct. '04 |
|||||||
| July | Aug. | Sept. | Oct. | July | Aug. | Sept. | Oct. | ||
| Total index | 116.7 | 116.7 | 116.8 | 117.6 | .7 | -.1 | .1 | .7 | 5.2 |
| Previous estimates | 116.7 | 116.5 | 116.7 | .7 | -.1 | .1 | |||
| Major market groups | |||||||||
| Final Products | 112.5 | 112.6 | 112.8 | 113.5 | 1.0 | .1 | .2 | .6 | 5.4 |
| Consumer goods | 108.6 | 109.2 | 109.3 | 109.9 | .3 | .6 | .0 | .6 | 3.7 |
| Business equipment | 123.5 | 122.0 | 122.6 | 123.3 | 3.0 | -1.2 | .5 | .5 | 11.2 |
| Nonindustrial supplies | 115.6 | 115.1 | 115.4 | 116.2 | .5 | -.4 | .3 | .7 | 6.1 |
| Construction | 107.4 | 107.2 | 105.7 | 106.8 | .9 | -.1 | -1.4 | 1.0 | 3.5 |
| Materials | 121.5 | 121.4 | 121.3 | 122.3 | .6 | -.1 | -.2 | .9 | 4.7 |
| Major industry groups | |||||||||
| Manufacturing (see note below) | 118.8 | 119.2 | 118.8 | 119.7 | 1.0 | .3 | -.3 | .7 | 6.0 |
| Previous estimates | 118.8 | 119.0 | 118.7 | .9 | .2 | -.3 | |||
| Mining | 93.4 | 92.1 | 89.9 | 90.5 | 1.4 | -1.3 | -2.4 | .7 | -3.4 |
| Utilities | 112.8 | 110.5 | 116.3 | 117.1 | -1.5 | -2.0 | 5.3 | .7 | 5.5 |
| Capacity utilization |
Percent of capacity |
Capacity growth Oct. '03 to Oct. '04 |
|||||||
|---|---|---|---|---|---|---|---|---|---|
| Average 1972-2003 |
1982 Low |
1988-89 High |
2003 Oct. |
2004 | |||||
| July | Aug. | Sept. | Oct. | ||||||
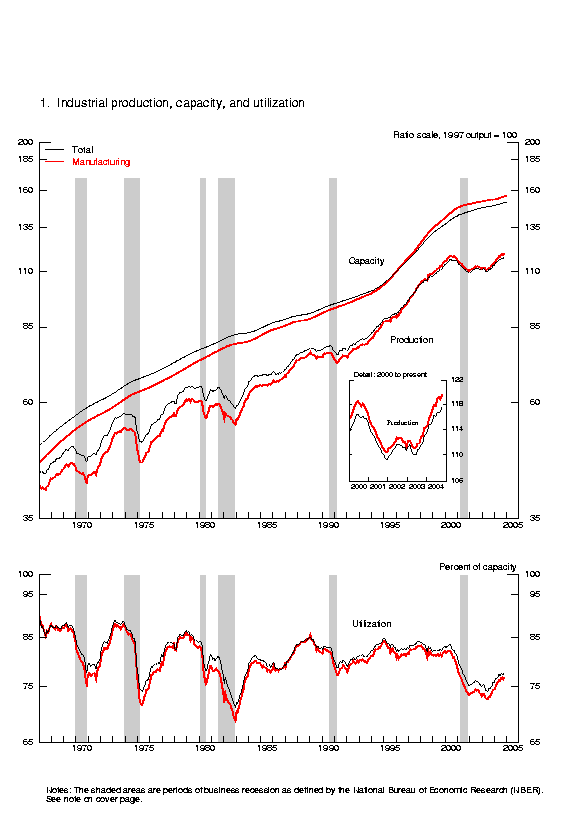
| Total industry | 81.1 | 70.9 | 85.2 | 75.0 | 77.5 | 77.3 | 77.3 | 77.7 | 1.5 |
| Previous estimates | 77.4 | 77.2 | 77.2 | ||||||
| Manufacturing (see note below) | 80.0 | 68.7 | 85.6 | 73.6 | 76.6 | 76.7 | 76.4 | 76.8 | 1.6 |
| Previous estimates | 76.6 | 76.6 | 76.3 | ||||||
| Mining | 86.9 | 78.6 | 85.6 | 85.4 | 85.0 | 83.9 | 81.9 | 82.5 | .0 |
| Utilities | 86.9 | 77.6 | 92.8 | 82.4 | 82.3 | 80.5 | 84.8 | 85.4 | 1.8 |
| Stage-of-process groups | |||||||||
| Crude | 86.3 | 77.2 | 88.5 | 83.8 | 85.7 | 84.5 | 82.8 | 83.5 | -.1 |
| Primary and semifinished | 82.2 | 68.1 | 86.4 | 77.0 | 79.1 | 79.0 | 79.2 | 79.7 | 2.3 |
| Finished | 78.2 | 71.3 | 83.2 | 71.1 | 74.2 | 74.2 | 74.2 | 74.6 | .9 |
r  Revised.  p  Preliminary.

       The statistics in this release cover output, capacity, and capacity utilization in the

industrial sector, which the Federal Reserve defines as manufacturing, mining, and electric and

gas utilities.  Manufacturing comprises those industries included in the North American Industry

Classification System, or NAICS, manufacturing plus the logging and newspaper, periodical,

book and directory publishing industries that have traditionally been considered manufacturing and included

in the industrial sector.
Market Groups
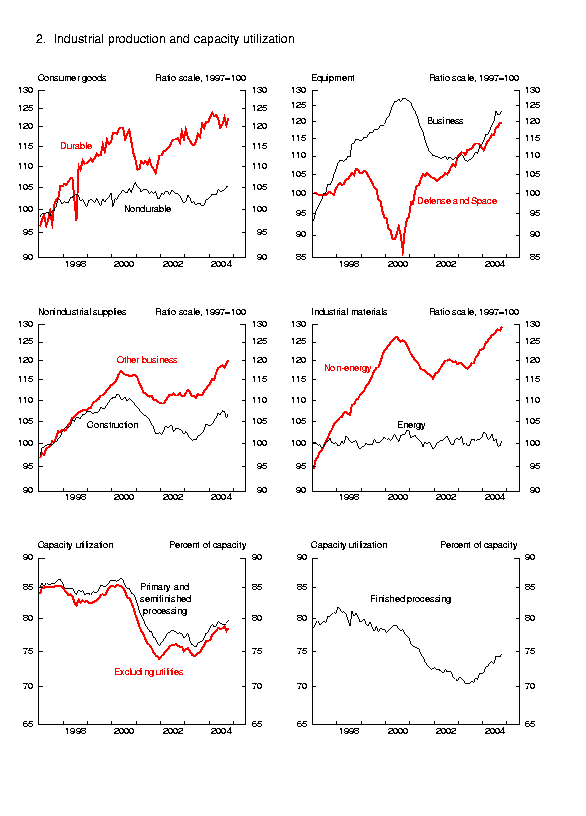
The output of consumer goods increased 0.6 percent in October. The index for durable consumer goods rose 1.6 percent, thereby reversing most of the previous month's decline. Gains were posted in all major categories, most notably home electronics and automotive products. The output of consumer non-energy nondurables edged up for the second consecutive month after more rapid gains in July and August. Increases for paper products and for foods and tobacco more than offset small declines in clothing and in chemical products. The production of consumer energy products rose 1 percent.
The index for business equipment increased 0.5 percent in October. The production indexes for transit equipment, information processing equipment, and industrial and other equipment all moved up for the second consecutive month. The production of defense and space equipment edged down but remained 5.2 percent above its year-ago level. The output of construction supplies moved up 1 percent, and the output of business supplies climbed 0.6 percent. Materials output rose 0.9 percent in October, a move that reflected increases in most major categories.
Industry Groups
The rise of 0.7 percent in manufacturing output in October resulted from a 1.0 percent increase in durables, a 0.4 percent increase in nondurables, and a 0.6 percent increase in non-NAICS manufacturing (logging and publishing). Among durables, the production of motor vehicles and parts gained 2.3 percent, and the output indexes for most other major industries moved up substantially; machinery output increased just slightly, and only the index for electrical equipment, appliances, and components edged down. Among nondurables, the largest gains were in petroleum refining and in plastics and rubber products. Nondurable industries that also registered substantial output gains included textile and product mills and paper. The production of apparel and leather goods was unchanged, and the index for printing and support declined. The overall factory operating rate climbed 0.4 percentage point, to 76.8 percent, a level 3.2 percentage points below its 1972-2003 average.
The increase of 0.7 percent in output at utilities in October was due entirely to higher output at electric utilities; output at natural gas utilities declined for a second consecutive month. Among the mining categories, natural gas extraction reversed about one-half of its September decline, while total crude oil extraction edged down further.
Capacity utilization for industries in the crude stage of processing increased 0.7 percentage point, to 83.5 percent. The utilization rate for industries in the primary and semifinished stages increased 0.5 percentage point, to 79.7 percent, and the utilization rate for finished goods producers increased 0.4 percentage point, to 74.6 percent.
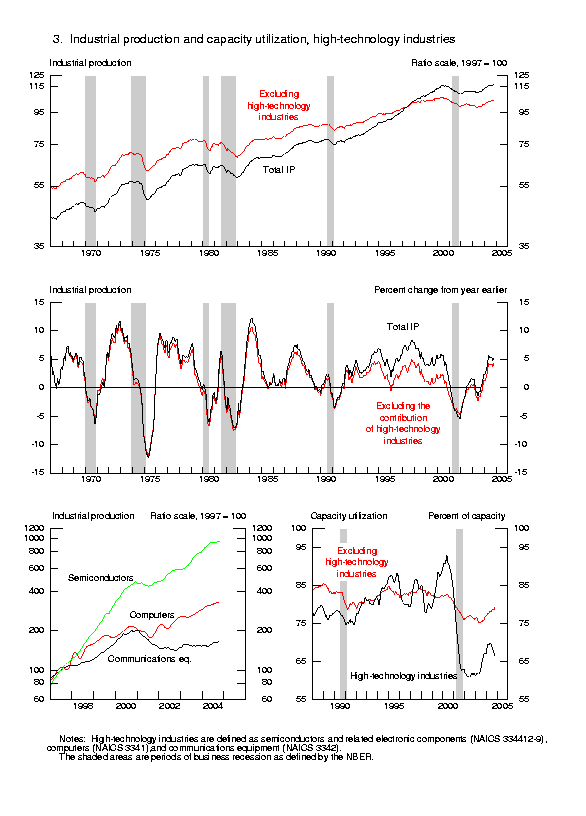
| Ascii | Screen reader | Summary: Industrial Production and Capacity Utilization | Chart | Chart 1: Industrial Production, Capacity, and Capacity Utilization | Chart | Chart 2: Industrial Production and Capacity Utilization | Chart | Chart 3: Industrial Production and Capacity Utilization, High Technology Industries |
| Ascii | Screen reader | Table 1:Industrial Production: Market and Industry Groups (percent change) |
| Ascii | Screen reader | Table 2:Industrial Production: Special Aggregates and Selected Detail (percent change) |
| Ascii | Screen reader | Table 3: Motor Vehicle Assemblies |
| Ascii | Screen reader | Table 4: Industrial Production Indexes: Market and Industry Group Summary |
| Ascii | Screen reader | Table 5: Industrial Production Indexes: Special Aggregates |
| Ascii | Screen reader | Table 6: Diffusion Indexes of Industrial Production |
| Ascii | Screen reader | Table 7: Capacity Utilization: Manufacturing, Mining, and Utilities |
| Ascii | Screen reader | Table 8: Industrial Capacity: Manufacturing, Mining, and Utilities (percent change) |
| Ascii | Screen reader | Table 9: Industrial Production: Gross Value of Products and Nonindustrial Supplies |
| Ascii | Screen reader | Table 10: Gross-Value-Weighted Industrial Production: Stage-of-Process Groups |
| Ascii | Screen reader | Table 11: Electric Power Use: Manufacturing and Mining |
| Ascii | Screen reader | Table 12: Historical Statistics for IP, Capacity, and Utilization: Total Industry |
| Ascii | Screen reader | Table 13: Historical Statistics for IP, Capacity, and Utilization: Manufacturing |
| Ascii | Screen reader | Table 14: Historical Statistics for IP, Capacity, and Utilization: Total Industry excluding Selected High-Technology Industries |
| Ascii | Screen reader | Table 15: Historical Statistics for IP, Capacity, and Utilization: Manufacturing excluding Selected High-Technology Industries |
Release dates | Historical data | Documentation
Current Monthly Release Other formats: ASCII | PDF (144 KB)
Supplemental Monthly Release Other formats: ASCII | PDF (144 KB)
Annual Revision Release Other formats: ASCII | PDF (150 KB)