
INDUSTRIAL PRODUCTION AND CAPACITY UTILIZATION
[2006 Revision Notice Below]
Industrial production rose 0.2 percent in October after having decreased 0.6 percent in September;
production in August was revised up to show a gain of 0.3 percent. At 113.7 percent of its 2002 average,
the index in October was 4.9 percent higher than its year-earlier level. Manufacturing output declined 0.2
percent in October; excluding motor vehicles and parts, manufacturing output rose 0.1 percent. The index
for mining increased 0.6 percent, and the index for utilities bounced up 4.1 percent after having fallen
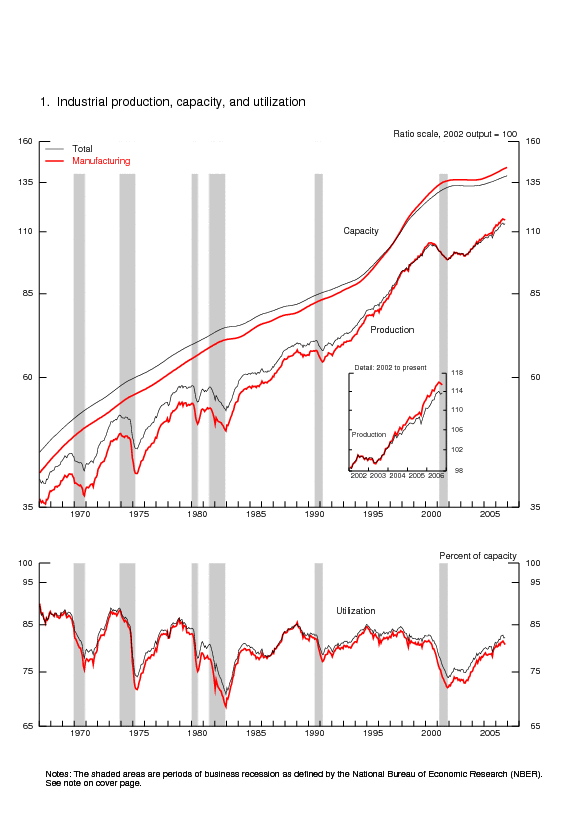
4.6 percent in September. The rate of capacity utilization for total industry rose 0.1 percentage point,
to 82.2 percent, a level 1.2 percentage points above its 1972-2005 average.
| Industrial production |
2002=100 | Percent change | |||||||
|---|---|---|---|---|---|---|---|---|---|
| 2006 | 2006 | Oct. '05 to Oct. '06 |
|||||||
| July | Aug. | Sept. | Oct. | July | Aug. | Sept. | Oct. | ||
| Total index | 113.7 | 114.0 | 113.4 | 113.7 | .3 | .3 | -.6 | .2 | 4.9 |
| Previous estimates | 113.8 | 113.8 | 113.1 | .3 | .0 | -.6 | |||
| Major market groups | |||||||||
| Final Products | 115.3 | 115.8 | 115.0 | 114.9 | .2 | .4 | -.7 | -.1 | 3.0 |
| Consumer goods | 107.4 | 107.9 | 106.9 | 106.4 | -.5 | .4 | -.9 | -.5 | -.1 |
| Business equipment | 136.3 | 136.8 | 136.6 | 137.5 | 1.9 | .4 | -.2 | .7 | 11.8 |
| Nonindustrial supplies | 112.5 | 112.7 | 111.5 | 112.4 | .2 | .2 | -1.1 | .8 | 2.6 |
| Construction | 113.8 | 113.5 | 112.4 | 112.7 | .4 | -.3 | -.9 | .2 | .3 |
| Materials | 112.6 | 112.7 | 112.4 | 112.9 | .4 | .1 | -.3 | .4 | 7.6 |
| Major industry groups | |||||||||
| Manufacturing (see note below) | 115.5 | 116.0 | 115.7 | 115.5 | .4 | .4 | -.2 | -.2 | 4.1 |
| Previous estimates | 115.5 | 115.8 | 115.4 | .4 | .2 | -.3 | |||
| Mining | 101.2 | 100.4 | 100.8 | 101.4 | -.1 | -.8 | .4 | .6 | 13.8 |
| Utilities | 109.5 | 109.7 | 104.6 | 108.9 | .2 | .1 | -4.6 | 4.1 | 2.8 |
| Capacity utilization |
Percent of capacity |
Capacity growth Oct. '05 to Oct. '06 |
|||||||
|---|---|---|---|---|---|---|---|---|---|
| Average 1972-2005 |
1994-95 High |
2001-02 Low |
2005 Oct. |
2006 | |||||
| July | Aug. | Sept. | Oct. | ||||||
| Total industry | 81.0 | 85.0 | 73.9 | 79.9 | 82.6 | 82.7 | 82.1 | 82.2 | 2.0 |
| Previous estimates | 82.6 | 82.5 | 81.9 | ||||||
| Manufacturing (see note below) | 79.8 | 84.5 | 72.0 | 79.4 | 81.2 | 81.4 | 81.0 | 80.7 | 2.5 |
| Previous estimates | 81.2 | 81.2 | 80.8 | ||||||
| Mining | 87.3 | 89.0 | 85.6 | 79.6 | 91.2 | 90.6 | 91.1 | 91.8 | -1.3 |
| Utilities | 86.7 | 93.7 | 83.7 | 86.2 | 88.9 | 88.9 | 84.8 | 88.2 | .6 |
| Stage-of-process groups | |||||||||
| Crude | 86.4 | 89.4 | 83.2 | 78.2 | 89.2 | 89.0 | 89.3 | 89.6 | -1.1 |
| Primary and semifinished | 82.1 | 88.1 | 74.6 | 82.2 | 83.8 | 83.9 | 82.9 | 83.2 | 2.1 |
| Finished | 77.9 | 80.5 | 70.8 | 78.2 | 79.9 | 80.0 | 79.7 | 79.3 | 2.6 |
Market Groups
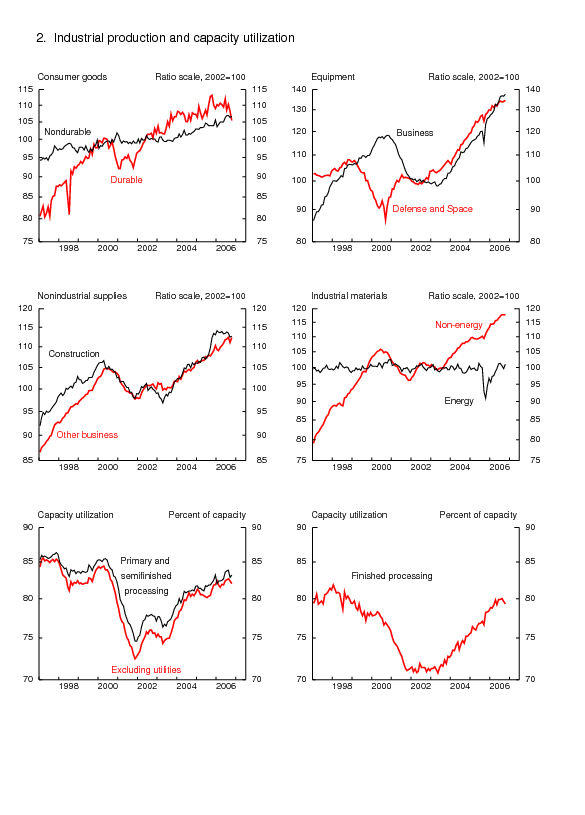
The output of consumer goods declined 0.5 percent in October. The index for durable consumer goods fell 2.6 percent; a drop of 4.6 percent in the production of automotive products accounted for most of the decrease. The index for automotive products stood 11.5 percent below its year-earlier level. The decrease in automotive products in October resulted from another decrease in light truck assemblies and a strike at a major producer of tires. Light truck assemblies stood at an annual rate of 5.6 million units in October, compared with a rate of 7.0 million units in the fourth quarter of 2005. The output of home electronics increased 1.0 percent in October, while the production indexes for miscellaneous goods and for appliances, furniture, and carpeting declined modestly. The output of consumer non energy nondurables edged up, as increases in the indexes for clothing and for paper products slightly more than offset a small decline in the index for foods and tobacco; the output of chemical products was unchanged. The index for consumer energy products rose 0.8 percent after having fallen sharply in September.
The output of business equipment increased 0.7 percent in October; all major categories registered gains and remained well above their year-earlier levels. The production of defense and space equipment moved up 0.4 percent to a level 5-1/4 percent higher than its level of a year earlier. The index for construction supplies increased 0.2 percent and was only slightly above its year-earlier level; the index for business supplies posted a gain of 1.1 percent. Materials output increased 0.4 percent in October; the output of non-energy materials was unchanged, but the production of energy materials rose 1.3 percent.
Industry Groups
Manufacturing output decreased 0.2 percent in October. The production of both durable and nondurable goods decreased, but the output of non-NAICS manufacturing (logging and publishing) rose. Capacity utilization in manufacturing declined 0.3 percentage point, to 80.7 percent, a level that was 0.9 percentage point above its 1972-2005 average. Among durable goods categories, the changes in output were mixed. The production of motor vehicles and parts, primary metals, and wood products recorded large drops, while substantial gains were reported in the output of computer and electronic products and of aerospace and miscellaneous transportation equipment. Among nondurables, which declined 0.4 percent in October, the largest drops were in the indexes for petroleum and coal products, plastics and rubber products, and textile and product mills. Elsewhere in nondurables, the indexes for apparel and leather and for printing and support registered substantial output gains.
The increase of 4.1 percent in output at utilities in October largely reflected colder-than-normal conditions following mild temperatures in September. The output at mines moved up 0.6 percent in October and was 13.8 percent above its hurricane-related trough in October 2005.
Capacity utilization for industries at the crude stage of processing increased 0.3 percentage
point, to 89.6 percent. The utilization rate for industries at the primary and semifinished stages
increased 0.3 percentage point, to 83.2 percent, and the utilization rate for finished goods producers
declined 0.4 percentage point, to 79.3 percent.
| Ascii | Screen reader | Summary: Industrial Production and Capacity Utilization | Chart | Chart 1: Industrial Production, Capacity, and Capacity Utilization | Chart | Chart 2: Industrial Production and Capacity Utilization | Chart | Chart 3: Industrial Production and Capacity Utilization, High Technology Industries |
| Ascii | Screen reader | Table 1: Industrial Production: Market and Industry Groups (percent change) |
| Ascii | Screen reader | Table 2: Industrial Production: Special Aggregates and Selected Detail (percent change) |
| Ascii | Screen reader | Table 3: Motor Vehicle Assemblies |
| Ascii | Screen reader | Table 4: Industrial Production Indexes: Market and Industry Group Summary |
| Ascii | Screen reader | Table 5: Industrial Production Indexes: Special Aggregates |
| Ascii | Screen reader | Table 6: Diffusion Indexes of Industrial Production |
| Ascii | Screen reader | Table 7: Capacity Utilization: Manufacturing, Mining, and Utilities |
| Ascii | Screen reader | Table 8: Industrial Capacity: Manufacturing, Mining, and Utilities (percent change) |
| Ascii | Screen reader | Table 9: Industrial Production: Gross Value of Products and Nonindustrial Supplies |
| Ascii | Screen reader | Table 10: Gross-Value-Weighted Industrial Production: Stage-of-Process Groups |
| Ascii | Screen reader | Table 11: Historical Statistics for IP, Capacity, and Utilization: Total Industry |
| Ascii | Screen reader | Table 12: Historical Statistics for IP, Capacity, and Utilization: Manufacturing |
| Ascii | Screen reader | Table 13: Historical Statistics for IP, Capacity, and Utilization: Total Industry excluding Selected High-Technology Industries |
| Ascii | Screen reader | Table 14: Historical Statistics for IP, Capacity, and Utilization: Manufacturing excluding Selected High-Technology Industries |
Release dates | Historical data | Data Download |Documentation
Current Monthly Release Other formats: ASCII | PDF (144 KB)
Supplemental Monthly Release Other formats: ASCII | PDF (144 KB)
Annual Revision Release Other formats: ASCII | PDF (150 KB)