
INDUSTRIAL PRODUCTION AND CAPACITY UTILIZATION
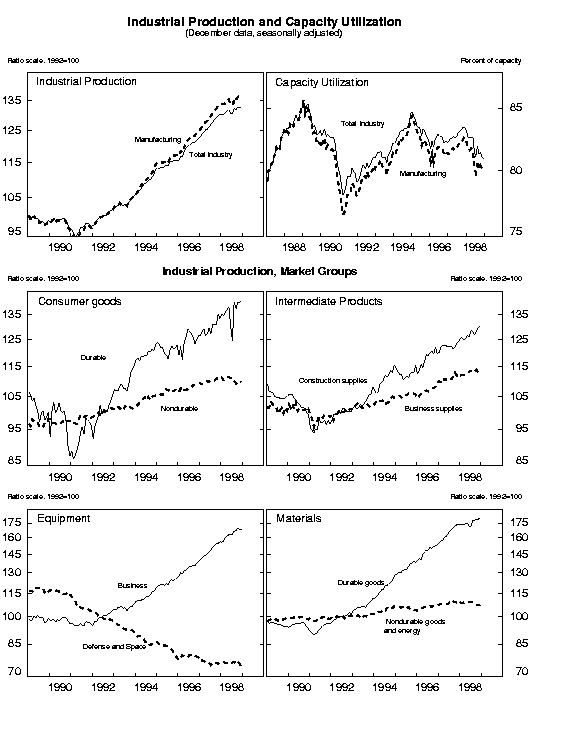
Industrial production increased 0.2 percent in December. Based on more complete information for a number of manufacturing industries and utilities, industrial production is now shown to have posted a larger gain in October than previously estimated and to have declined less in November. Production in December was boosted by a 1.6 percent increase in utilities. Manufacturing output increased 0.2 percent, the third month of consecutive gains. At 132.8 percent of its 1992 average, industrial production in December was 1.9 percent higher than it was in December 1997. Capacity utilization stood at 80.9 percent in December. The industry operating rate declined 2-1/2 percentage points during 1998 to a level more than 1 percentage point below its 1967-97 average.
Industrial production rose at an annual rate of 3.2 percent in the fourth quarter after having increased at a 0.9 percent rate in the third quarter. The gain was notable in manufacturing where the pace picked up from a 0.4 percent annual rate in the third quarter to 5.1 percent in the fourth quarter. Part of the acceleration reflected a rebound in motor vehicle assemblies after strikes had limited output in both the second and third quarters; nonetheless, the output of other manufacturing industries increased at an annual rate of 3.3 percent in the fourth quarter after having been little changed in the third quarter. Utility output fell 12.5 percent at an annual rate in the fourth quarter as a result of the unusually mild temperatures.
 INDUSTRIAL PRODUCTION AND CAPACITY UTILIZATION:  SUMMARY
 Seasonally adjusted
                               |             Index, 1992=100             |                 Percent change
                               |     1998                                |   1998                          |  Dec. 97 to
 Industrial Production         |    Sept.      Oct.      Nov.      Dec.  |  Sept.    Oct.    Nov.    Dec.  |   Dec. 98
 ------------------------------------------------------------------------------------------------------------------------
                               |                                         |                                 |
  Total index                  |    131.9     132.6     132.5     132.8  |    -.4      .5     -.1      .2  |         1.9
     Previous estimates        |    131.9     132.2     131.8            |    -.4      .2     -.3          |
                               |                                         |                                 |
 Major market groups:          |                                         |                                 |
     Products, total           |    124.1     125.2     124.9     125.0  |    -.6      .8     -.2      .1  |         2.2
        Consumer goods         |    114.8     115.6     115.8     115.8  |   -1.2      .8      .2      .0  |          .4
        Business equipment     |    167.4     169.5     168.2     168.1  |     .5     1.3     -.8      .0  |         7.4
        Construction supplies  |    126.9     128.2     129.6     130.4  |    -.9     1.0     1.1      .6  |         5.0
     Materials                 |    144.4     144.5     144.6     145.3  |     .0      .0      .1      .5  |         1.4
                               |                                         |                                 |
 Major industry groups:        |                                         |                                 |
     Manufacturing             |    135.2     136.3     136.5     136.7  |    -.4      .8      .1      .2  |         2.3
        Durable                |    159.6     161.1     160.9     161.5  |    -.1     1.0     -.1      .3  |         4.8
        Nondurable             |    110.6     111.2     111.8     111.8  |    -.7      .6      .5      .0  |         -.8
     Mining                    |    102.4     101.8     101.4     100.8  |   -1.3     -.6     -.4     -.6  |        -5.3
     Utilities                 |    120.3     117.4     113.9     115.7  |     .0    -2.4    -2.9     1.6  |         2.4
 ------------------------------------------------------------------------------------------------------------------------
                               |                                                                           |   Capacity
                               |                            Percent of Capacity                            |    Growth
                               |   Average      1982   1988-89     1997  |   1998                          |  Dec. 97 to
 Capacity Utilization          |  1967-98        Low      High     Dec.  |  Sept.    Oct.    Nov.    Dec.  |   Dec. 98
 ------------------------------------------------------------------------------------------------------------------------
                               |                                         |                                 |
  Total industry               |     82.1      71.1      85.4      83.4  |   81.3    81.4    81.0    80.9  |         5.0
     Previous estimates        |                                         |   81.3    81.2    80.6          |
                               |                                         |                                 |
     Manufacturing             |     81.1      69.0      85.7      82.5  |   80.1    80.4    80.1    79.9  |         5.6
        Advanced processing    |     80.5      70.4      84.2      81.4  |   79.5    79.8    79.5    79.2  |         6.6
        Primary processing     |     82.4      66.2      88.9      85.4  |   82.1    82.4    82.3    82.4  |         2.9
     Mining                    |     87.5      80.3      88.0      89.0  |   85.2    84.6    84.2    83.6  |          .9
     Utilities                 |     87.5      75.9      92.6      89.9  |   95.0    92.7    89.9    91.3  |          .8
 ------------------------------------------------------------------------------------------------------------------------
 Note:  Estimates for December are preliminary.  Estimates from September to November are revised.
Market Groups
The output of consumer goods was unchanged in December. The production of automotive products was also unchanged, but the output of other durable consumer goods rose 0.8 percent. The production of nondurable consumer goods slipped down 0.1 percent, pulled down by decreases in clothing and paper products. Residential sales of both electricity and gas increased.
The production of business equipment was unchanged after an 0.8 percent drop in November. December declines in the output of industrial equipment (notably mining and oil and gas field equipment), transit equipment, and farm machinery (a component of the other equipment group) were offset by a gain in information processing equipment.
The output of construction supplies rose 0.6 percent after gains of about 1 percent in both October and November. The production of business supplies increased 1.0 percent in December, more than reversing its loss in November.
The production of materials grew 0.5 percent after having been nearly flat in the preceding three months. The production of durable goods materials increased 0.6 percent as continued strength in the production of semiconductors and computer parts offset weakness in other categories. The output of basic metals slipped 0.1 percent and is now 5 percent below the level of a year ago. The production of nondurable materials also edged down 0.1 percent because of weakness in the production of paper and textiles.
Industry Groups
Manufacturing output increased 0.2 percent in December with gains in the production of durable goods and with no change in the production of nondurable goods. The output for most major durable goods industries increased; the biggest advances came in electrical machinery, miscellaneous manufactures, and furniture. The production of computers increased 2.2 percent while the output of other industrial machinery fell, leaving the combined industrial machinery and computer industry up only 0.4 percent. In the past twelve months, computer output has expanded more than 50 percent. The production of nondurable goods was flat in December after having posted gains of about 1/2 percent in the preceding two months. Gains in petroleum and chemical products in December were offset by losses in printing, textiles, apparel, and food; the decline in food production follows two consecutive monthly gains of about 1-1/2 percent. Mining production continued to fall, being pulled down by the continued contraction in oil and gas extraction.
The factory operating rate dropped 0.2 percentage point to 79.9 percent--more than 2-1/2 percentage points below the level in December 1997. The average rate in the fourth quarter, 80.2 percent, was unchanged from the third quarter. The utilization rate for advanced-processing industries remains below its 1967-97 average, while the utilization rate for primary-processing industries is at its long-term average. The utilization rate for mines fell 0.6 percentage point in December and has fallen more than 5 percentage points during the past twelve months.
G.17 Release Tables: