
INDUSTRIAL PRODUCTION AND CAPACITY UTILIZATION
INDUSTRIAL PRODUCTION AND CAPACITY UTILIZATION
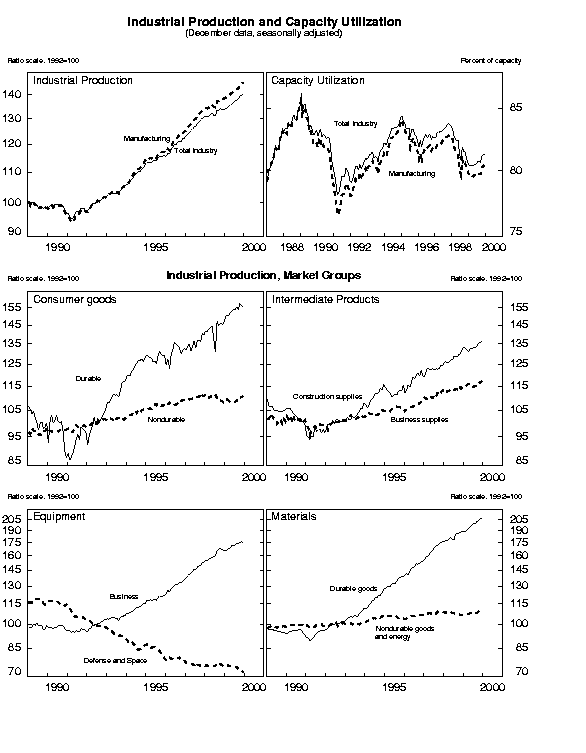
Industrial production increased 0.4 percent in December, the same rate as in November. At 140.5 percent of its 1992 average, industrial production in December was 5.0 percent higher than in December 1998. For the fourth quarter as a whole, the total index increased at an annual rate of 6.6 percent, up from 4.8 percent in the third quarter. The rate of capacity utilization for total industry edged up in December, to 81.3 percent, a level 0.8 percentage point below its 1967-98 average.
 INDUSTRIAL PRODUCTION AND CAPACITY UTILIZATION:  SUMMARY
 Seasonally adjusted
                               |             Index, 1992=100             |                 Percent change
                               |     1999                                |   1999                          |  Dec. 98 to
 Industrial Production         |    Sept.      Oct.      Nov.      Dec.  |  Sept.    Oct.    Nov.    Dec.  |   Dec. 99
 ------------------------------------------------------------------------------------------------------------------------
                               |                                         |                                 |
  Total index                  |    138.1     139.4     139.9     140.5  |     .2     1.0      .4      .4  |         5.0
     Previous estimates        |    138.0     139.1     139.5            |     .2      .8      .3          |
                               |                                         |                                 |
 Major market groups:          |                                         |                                 |
     Products, total           |    127.6     129.0     129.2     129.4  |    -.1     1.1      .2      .2  |         3.6
        Consumer goods         |    117.1     118.9     118.9     119.1  |    -.4     1.5      .0      .2  |         3.5
        Business equipment     |    173.7     175.1     176.1     175.6  |    -.1      .8      .6     -.3  |         5.6
        Construction supplies  |    134.1     135.3     135.7     136.2  |     .9      .9      .3      .4  |         3.0
     Materials                 |    155.7     156.8     158.0     159.2  |     .7      .7      .7      .8  |         7.3
                               |                                         |                                 |
 Major industry groups:        |                                         |                                 |
     Manufacturing             |    142.9     144.3     145.2     145.5  |     .3     1.0      .6      .2  |         5.1
        Durable                |    175.0     176.4     177.7     177.9  |     .3      .8      .7      .1  |         7.0
        Nondurable             |    111.8     113.1     113.6     114.0  |     .3     1.2      .5      .3  |         2.6
     Mining                    |     98.3      99.3      99.8     100.2  |    -.2     1.0      .5      .4  |         2.2
     Utilities                 |    117.7     118.6     115.5     119.5  |    -.1      .7    -2.6     3.5  |         6.2
 ------------------------------------------------------------------------------------------------------------------------
                               |                                                                           |   Capacity
                               |                            Percent of Capacity                            |    Growth
                               |   Average      1982   1988-89     1998  |   1999                          |  Dec. 98 to
 Capacity Utilization          |  1967-98        Low      High     Dec.  |  Sept.    Oct.    Nov.    Dec.  |   Dec. 99
 ------------------------------------------------------------------------------------------------------------------------
                               |                                         |                                 |
  Total industry               |     82.1      71.1      85.4      80.6  |   80.6    81.2    81.2    81.3  |         4.1
     Previous estimates        |                                         |   80.6    81.0    81.0          |
                               |                                         |                                 |
     Manufacturing             |     81.1      69.0      85.7      79.9  |   79.7    80.2    80.4    80.3  |         4.6
        Advanced processing    |     80.5      70.4      84.2      78.8  |   78.7    79.2    79.4    79.1  |         5.5
        Primary processing     |     82.4      66.2      88.9      83.1  |   82.8    83.3    83.7    83.7  |         2.3
     Mining                    |     87.5      80.3      88.0      81.4  |   81.8    82.6    83.1    83.4  |         -.3
     Utilities                 |     87.4      75.9      92.6      88.9  |   92.0    92.6    90.1    93.1  |         1.4
 ------------------------------------------------------------------------------------------------------------------------
 Note:  Estimates for December are preliminary.  Estimates from September to November are revised.
Market Groups
The output of consumer goods, which had been flat in November, increased 0.2 percent in December. The output of durable consumer goods declined for a second month as the production of automotive products fell a cumulative total of 2-1/4 percent over the last two months of the year. The production of other durable consumer goods advanced, with increases in the indexes for home electronics and miscellaneous consumer durable goods more than offsetting a sharp decline in appliances. Although the monthly fluctuations in appliance output have been volatile, production for the year as a whole was up quite sharply. The production of nondurable consumer goods advanced 0.4 percent. Most of the gain came from a rebound in the output of energy products after unusually mild weather in November had cut sales of residential gas and electricity nearly 4 percent. The output of non-energy consumer products edged up after a rise of about 2 percent over the two preceding months; in December, the production indexes for foods and tobacco and for chemical products rose further but were mostly offset by declines in the output of clothing and paper products.
The production of business equipment, which had increased about 1-1/2 percent over the preceding two months, eased a bit in December. The uptrend was interrupted by a drop of 4.4 percent in the output of transit equipment and of 1.1 percent in the production of the "other equipment" group, particularly farm machinery and equipment. The output of industrial equipment remained weak, edging down in both November and December. The production of information processing and related equipment rose more than 1 percent, bringing the gain over the last 12 months to nearly 24 percent. The output of defense and space equipment fell more than 1 percent in December, to a level 4.2 percent below that in December 1998; the cumulative decline in this index over the 1990s was about 40 percent.
The production of construction supplies rose 0.4 percent further in December, to a level 3.0 percent higher than in December 1998; from the third quarter to the fourth quarter, this index increased at an annual rate of about 7 percent. The output of materials increased 0.8 percent after an average monthly gain of 0.7 percent in the preceding three months. The output of durable goods materials increased 0.7 percent, a bit less than the average monthly gain recorded over the past year. Another strong increase in equipment parts, particularly semiconductors, was partly offset by a decline in the index for original equipment parts used to make motor vehicles. The output of nondurable goods materials edged up 0.2 percent. The output of energy materials, which had grown slowly over the year, jumped 1.8 percent in December after a 1 percent decline in November.
Industry Groups
Manufacturing output advanced 0.2 percent in December, one-third as much as in November. The declines in the production of motor vehicles and parts and aircraft and parts reduced growth in manufacturing about 0.3 percentage point in December. For the fourth quarter, the annual rate of factory output accelerated to more than 7 percent, with continued strength in durables and a sharp step-up in the output of nondurables, which had changed little, on balance, between mid-1998 and the third quarter of 1999. In the fourth quarter, the overall factory operating rate increased 0.6 percentage point, to 80.3 percent.
The output of durables, which increased 7 percent over the year, edged up in December as the output of motor vehicles and parts, which dropped 2.8 percent in December, reversed the gains made in the preceding three months. In addition, the production of iron and steel edged down after a strong increase in November, and the output of aerospace and miscellaneous transportation fell another 1.5 percent, bringing the decline in this group to nearly 14 percent over 1999. In December, the computer and office equipment industry again advanced less rapidly than in earlier months, while the output of semiconductors and related electronic components rose 3.2 percent, in line with the rapid growth of the past year. The recent recovery in the output of farm machinery, which had erased only a small part of the earlier severe decline, was interrupted in December. The production in nondurable manufacturing increased 0.3 percent, to a level 2.6 percent higher than in December 1998. Among nondurable manufacturing industries, production gains were widespread; however, the output of leather and products and textile mill products declined for another month. In the fourth quarter, production rose substantially in the foods, tobacco, chemicals, paper, and printing and publishing industries.
The factory operating rate edged down in December, to 80.3 percent. Utilization in primary-processing industries held at 83.7 percent, while that for advanced-processing industries declined 0.3 percentage point, to 79.1 percent.
Output at utilities, which had fallen back more than 2-1/2 percent in November, increased 3.5 percent; the operating rate at utilities rebounded 3 percentage points, to 93.1 percent. Boosted by the continuing recovery in oil and gas extraction, mine production increased 0.4 percent, about the same gain as in November; the utilization rate at mines, which increased to 83.4 percent, was still noticeably below its long-term average. While drilling and other oil and gas field activity has been recovering since June, the level of activity remains relatively low.
Revision of Industrial Production and Capacity Utilization
As previously announced, the Federal Reserve Board on November 30, 1999, published a revision
to its index of industrial production (IP) and the related measures of capacity and capacity utilization
for the period from January 1992 to October 1999. The updated measures reflect both the
incorporation of newly available, more comprehensive source data typical of annual revisions and,
for some series, the introduction of improved methods for compiling the series. The new source data
are for recent years, primarily 1997 and 1998, and the modified methods affect data for 1992 onward.
In addition, the supplementary series on the gross value of products leaving the industrial sector are
now expressed in 1996 dollars; these series begin in 1977.
The updated IP measures include some annual data from the Census Bureau's 1997 Census
of Manufactures and from selected editions of its 1998 Current Industrial Reports. Annual data from
the U.S. Geological Survey on metallic and nonmetallic minerals (except fuels) for 1997 and 1998
are also introduced. The updating includes revisions to the monthly indicator for each industry
(either physical product data, production worker hours, or electric power usage) and revised seasonal
factors.
The revision introduced improved measures of production for computers and office
equipment (SIC 357) and motor vehicles (SIC 3711, 3). The new monthly measure for computers
is derived from detailed information on the major products produced by the industry. For example,
from 1994 to 1998, quarterly data on the physical quantity and average unit values of about 1,100
distinct models of personal computers, notebooks, servers, and workstations are used to construct
the new IP index for computers; previously, monthly electric power use by the industry was used as
the within-year indicator of production. The new measures of motor vehicle production incorporate
price weights for the different models of light vehicles; previously, all autos and light trucks were
weighted equally in compiling an aggregate figure. In addition, the monthly production indicators
for bolts and fasteners (SIC 345) and for metalworking machinery (SIC 354) were changed from
electric power use to production worker hours.
Capacity and capacity utilization rates have been revised to incorporate preliminary data from
the Census Bureau's 1998 Survey of Plant Capacity, which covers manufacturing, along with other
new data on capacity from the U.S. Geological Survey, the Department of Energy, and other
organizations.
The revision is available on the Board's web site, at www.federalreserve.gov/releases/g17,
and on diskettes from Publications Services (telephone 202-452-3245). The revised data are also
available through the STAT-USA web site of the Department of Commerce (www.stat-usa.gov).
Further information on these revisions is available from the Board's Industrial Output Section
(telephone 202-452-3197).
G.17 Release Tables:
G.17:
Release |
Release dates |
About |
ASCII |
PDF (199 KB) |
Historical data