
INDUSTRIAL PRODUCTION AND CAPACITY UTILIZATION
INDUSTRIAL PRODUCTION AND CAPACITY UTILIZATION
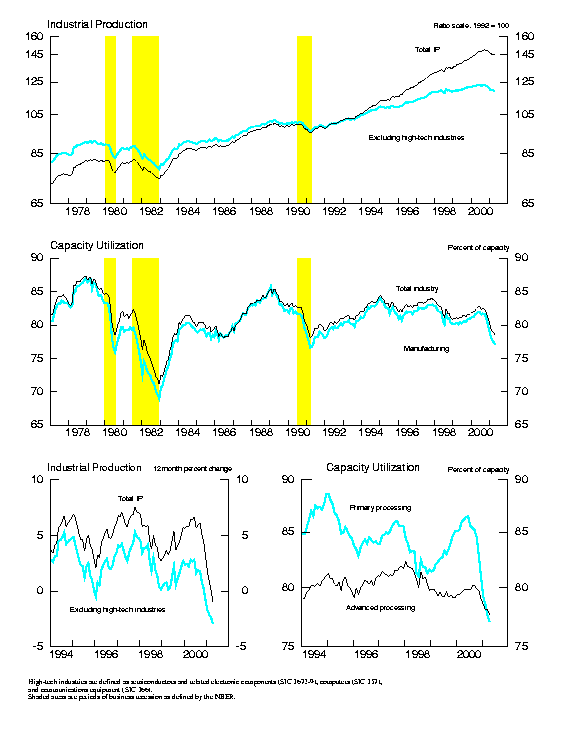
Industrial production declined 0.3 percent in April after a drop in output in the first quarter that was steeper than previously reported. At 144.9 percent of its 1992 average, industrial production in April was 1.0 percent lower than in April 2000. Manufacturing output also fell 0.3 percent in April and has contracted nearly 3.5 percent since its recent peak in September 2000. Manufacturing output excluding motor vehicles and parts declined 0.4 percent in April. Output at utilities moved down 1.0 percent, and production in mining rose 0.6 percent. The rate of capacity utilization for total industry fell further, to 78.5 percent, more than 3-1/2 percentage points below its 1967-2000 average.
 INDUSTRIAL PRODUCTION AND CAPACITY UTILIZATION:  SUMMARY
 Seasonally adjusted
                               |                    1992=100                     |                  Percent change
 ----------------------------------------------------------------------------------------------------------------------------------
                               |       2001                                      |   2001                          |   Apr. '00 to
 Industrial production         |       Jan.        Feb.        Mar.        Apr.  |   Jan.    Feb.    Mar.    Apr.  |     Apr. '01
 ----------------------------------------------------------------------------------------------------------------------------------
                               |                                                 |                                 |
  Total index                  |      146.0       145.5       145.3       144.9  |    -.9     -.4     -.1     -.3  |          -1.0
     Previous estimates        |      146.4       145.9       146.5              |    -.6     -.4      .4          |
                               |                                                 |                                 |
 Major market groups:          |                                                 |                                 |
  Products, total              |      135.0       134.7       134.8       134.3  |    -.7     -.2      .1     -.4  |           -.7
     Consumer goods            |      121.8       122.3       122.4       122.2  |   -1.1      .4      .1     -.2  |           -.8
     Business equipment        |      197.4       195.1       196.1       193.8  |    -.9    -1.2      .5    -1.1  |           1.4
     Construction supplies     |      140.7       139.7       139.2       138.4  |     .0     -.7     -.3     -.6  |          -4.2
  Materials                    |      165.9       164.8       164.3       163.9  |   -1.1     -.6     -.4     -.2  |          -1.3
                               |                                                 |                                 |
 Major industry groups:        |                                                 |                                 |
  Manufacturing                |      151.3       150.7       150.3       149.8  |    -.8     -.4     -.2     -.3  |          -1.6
     Durable                   |      192.3       191.0       191.9       190.7  |   -1.4     -.7      .4     -.6  |           -.1
     Nondurable                |      114.0       114.0       112.8       112.8  |    -.1      .0    -1.1      .0  |          -3.3
  Mining                       |      101.0       101.3       102.4       103.1  |    1.4      .3     1.1      .6  |           3.2
  Utilities                    |      124.0       123.1       123.6       122.3  |   -3.9     -.7      .4    -1.0  |           3.1
 ----------------------------------------------------------------------------------------------------------------------------------
                               |                                                                                   |    Capacity
                               |                                Percent of capacity                                |     growth
                               |     Average        1982     1988-89       2000  |   2001                          |   Apr. '00 to
 Capacity utilization          |  1967-2000          Low        High       Apr.  |   Jan.    Feb.    Mar.    Apr.  |     Apr. '01
 ----------------------------------------------------------------------------------------------------------------------------------
                               |                                                 |                                 |
  Total industry               |       82.1        71.1        85.4        82.5  |   79.7    79.2    78.9    78.5  |           4.0
     Manufacturing             |       81.1        69.0        85.7        81.8  |   78.4    77.9    77.5    77.1  |           4.5
                               |                                                 |                                 |
        Advanced processing    |       80.6        71.0        84.2        79.8  |   78.6    78.1    78.1    77.7  |           2.3
        Primary processing     |       82.2        65.7        88.3        86.2  |   79.2    78.6    77.6    77.1  |           8.0
     Mining                    |       87.4        80.3        88.0        85.7  |   87.5    87.8    88.9    89.6  |          -1.3
     Utilities                 |       87.6        75.9        92.6        90.0  |   91.7    90.7    90.8    89.6  |           3.5
 ----------------------------------------------------------------------------------------------------------------------------------
Market Groups
The output of consumer goods declined 0.2 percent in April. The production of automotive products edged up 0.6 percent after a stronger gain in March; nonetheless, output remained below the level posted before the industry's downturn that began in October of last year. The production indexes declined for most other consumer durables and for consumer energy products. The decline in the energy index reflected a drop in utility output for residential use that more than offset a jump in the production of automotive gasoline. The output of nondurable consumer goods excluding energy was unchanged and thus continued the sluggish pattern of production that has been evident over the past year.
The production of business equipment dropped 1.1 percent, more than reversing the gain posted in March; production for this group has fallen more than 3 percent since November. The output of industrial and other equipment fell nearly 2 percent in April, with sharp losses in construction equipment, metalworking machinery, and farm machinery. The output of information processing equipment declined 0.4 percent further, pushed down by continued weakness in the production of communications equipment and computers. The output of transit equipment also declined, largely owing to a rollback in the production of medium and heavy trucks.
Within intermediate products, the output of construction supplies fell 0.6 percent further in April; output for that group is more than 4 percent below its level in April 2000. The production of materials receded 0.2 percent in April, with the losses concentrated in durables. The production of semiconductors and related electronic components fell further, as did the output of basic metals. In addition, the production of semiconductors and related electronic components in the first quarter was revised down significantly, leaving the April level about 6 percent below the December level. The output of nondurable goods materials edged up 0.2 percent in April after a 2 percent decline in March. The production of both chemical and paper materials posted small gains, while the output of textiles fell again. The production of energy materials was up 0.3 percent, as declines at electric and gas utilities were more than offset by gains in the coal and oil and gas extraction industries.
Industry Groups
Manufacturing output fell 0.3 percent in April, the seventh consecutive monthly decline. Most of the losses were posted in the durable goods industries, most notably in high technology, other industrial machinery, and primary metals. The production of nondurable goods was unchanged; both the textile mill products industry and the apparel industry made significant cutbacks in production, while the output of petroleum products jumped sharply.
The factory operating rate edged down further, to 77.1 percent. The utilization rate for primary-processing industries decreased slightly, to 77.1 percent, while the rate for advanced-processing industries edged down to 77.7 percent. Capacity utilization in high-technology industries (computers, communications equipment, and semiconductors) dropped for the ninth successive month, to 73.4 percent, a level more than 6-1/2 percentage points below its July 2000 peak. The operating rate at utilities dipped to 89.6 percent. The operating rate for mining increased for the fourth consecutive month, to 89.6 percent.
Note: The capacity indexes have been revised in this release beginning with January 2001. Although changes among most industries were offsetting, a significant downward revision to capacity growth at both semiconductor and computer manufacturers has led to a reduction in the overall estimate of capacity growth in 2001 from 3.5 percent to 2.7 percent.
G.17 Release Tables: