
Release Date: March 14, 2003
Release dates | Historical data | Documentation
Current Monthly Release Other formats: ASCII | PDF (144 KB)
Supplemental Monthly Release Other formats: ASCII | PDF (144 KB)
Annual Revision Release Other formats: ASCII | PDF (150 KB)
INDUSTRIAL PRODUCTION AND CAPACITY UTILIZATION
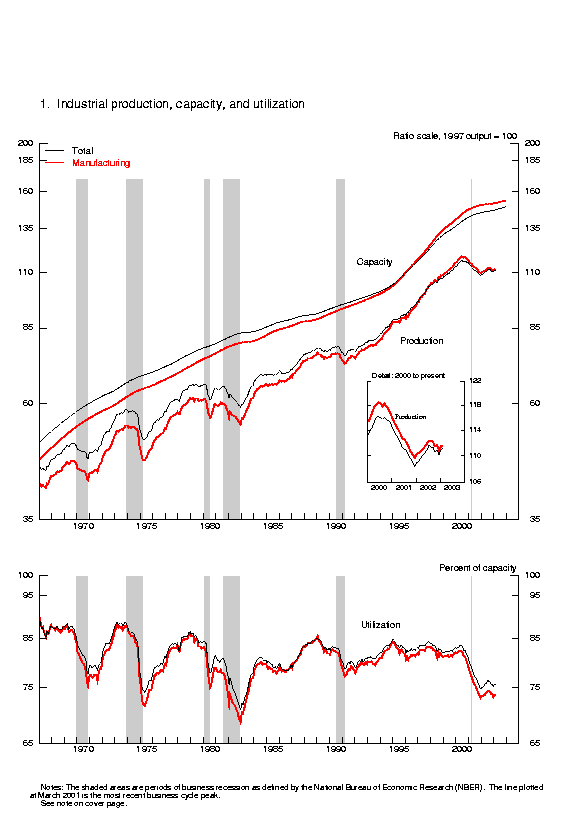
Industrial production rose 0.1 percent in February. At 111.1 percent of the 1997 average,
output was 1.7 percent above its level in February 2002. A decline of 0.1 percent in
manufacturing production was more than offset by gains at utilities and mines. For the second
consecutive month, manufacturing output excluding motor vehicles and parts rose 0.2 percent.
Capacity utilization for total industry, at 75.6 percent, was unchanged from January and
remained 5.7 percentage points below its 1972-2002 average.
 INDUSTRIAL PRODUCTION AND CAPACITY UTILIZATION:  SUMMARY
 Seasonally adjusted
 --------------------------------------------------------------------------------------------------------------------------------------
                                  |                    1997=100                     |                  Percent change
                                  | ----------------------------------------------- | -------------------------------------------------
                                  |       2002                    2003              |   2002            2003          |    Feb. '02 to
 Industrial production            |       Nov.        Dec.        Jan.        Feb.  |   Nov.    Dec.    Jan.    Feb.  |      Feb. '03
 --------------------------------------------------------------------------------------------------------------------------------------
                                  |                                                 |                                 |
  Total index                     |      110.8       110.1       111.0       111.1  |     .2     -.6      .8      .1  |            1.7
     Previous estimates           |      110.8       110.3       111.1              |     .2     -.4      .7          |
                                  |                                                 |                                 |
  Major market groups             |                                                 |                                 |
  Final Products                  |      107.1       106.0       107.1       106.9  |     .4    -1.0     1.0     -.2  |             .1
     Consumer goods               |      107.8       106.7       107.8       107.5  |     .7    -1.0     1.0     -.3  |             .7
     Business equipment           |      106.1       104.7       105.6       105.6  |     .0    -1.3      .9      .0  |           -2.4
  Nonindustrial supplies          |      114.9       114.2       115.0       115.5  |    -.4     -.6      .8      .4  |            2.4
     Construction                 |      103.8       102.8       103.0       102.8  |    -.3    -1.0      .1     -.2  |            -.3
  Materials                       |      113.1       112.8       113.4       113.8  |     .2     -.2      .6      .3  |            3.2
                                  |                                                 |                                 |
  Major industry groups           |                                                 |                                 |
  Manufacturing (see note below)  |      111.6       110.8       111.5       111.4  |     .1     -.7      .6     -.1  |             .9
     Previous estimates           |      111.6       111.1       111.7              |     .1     -.4      .5          |
  Mining                          |       93.6        95.4        93.7        94.6  |    1.4     1.9    -1.8     1.0  |             .5
  Utilities                       |      112.1       110.5       114.9       116.4  |     .0    -1.4     4.0     1.3  |           10.6
 --------------------------------------------------------------------------------------------------------------------------------------
                                  |                                                                                   |    Capacity
                                  |                                Percent of capacity                                |     growth
                                  | --------------------------------------------------------------------------------- | ---------------
                                  |     Average        1982     1988-89       2002  |   2002            2003          |    Feb. '02 to
 Capacity utilization             |  1972-2002          Low        High       Feb.  |   Nov.    Dec.    Jan.    Feb.  |      Feb. '03
 --------------------------------------------------------------------------------------------------------------------------------------
                                  |                                                 |                                 |
  Total industry                  |       81.3        70.8        85.1        75.1  |   75.6    75.1    75.6    75.6  |            1.1
     Previous estimates           |                                                 |   75.6    75.2    75.7          |
                                  |                                                 |                                 |
  Manufacturing (see note below)  |       80.2        68.6        85.6        73.4  |   73.7    73.2    73.6    73.4  |             .8
     Previous estimates           |                                                 |   73.7    73.4    73.7          |
  Mining                          |       86.9        78.6        85.6        85.4  |   85.0    86.6    85.0    85.8  |             .0
  Utilities                       |       86.7        77.2        92.6        85.2  |   86.4    84.8    87.8    88.5  |            6.5
                                  |                                                 |                                 |
  Stage-of-process groups         |                                                 |                                 |
  Crude                           |       86.4        77.2        88.6        82.5  |   82.9    84.5    82.8    83.7  |            -.4
  Primary and semifinished        |       82.2        67.9        86.2        76.4  |   78.1    77.4    78.3    78.4  |            1.6
  Finished                        |       78.5        71.3        83.1        71.8  |   70.9    70.2    70.7    70.3  |             .9
 --------------------------------------------------------------------------------------------------------------------------------------
 r  Revised.  p  Preliminary.
        The statistics in this release cover output, capacity, and capacity utilization in the
 industrial sector, which the Federal Reserve defines as manufacturing, mining, and electric and
 gas utilities.  Manufacturing consists of those industries included in the North American Industry
 Classification System, or NAICS, manufacturing plus those industries-logging and newspaper, periodical,
 book and directory publishing-that have traditionally been considered manufacturing and included
 in the industrial sector.
Market Groups
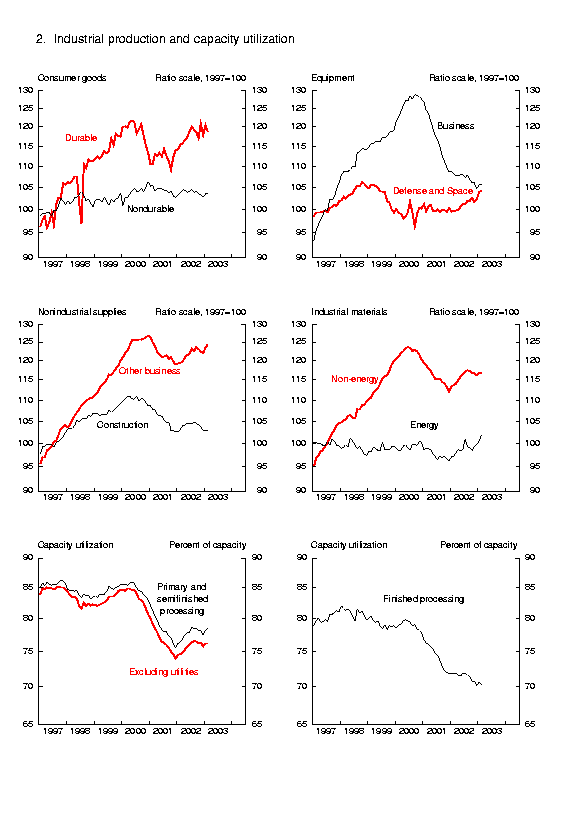
The output of consumer goods fell 0.3 percent in February. A decline of 1.4 percent in the production of durables reflected mainly a drop of 2.2 percent in the output of automotive products. The production of nondurables moved up 0.1 percent. An expansion of 1.1 percent in the output of consumer energy products, which includes sales of residential electricity and gas, more than offset a contraction in non-energy consumer goods that resulted primarily from a decline in the production of foods and tobacco.
The output of business equipment was unchanged in February and was 2.4 percent below its level of a year ago. The production of transit equipment fell 1.5 percent as a result of a drop in the assemblies of business autos. The index for information processing equipment edged up slightly, to its highest level in fifteen months, but remained more than 15 percent below its January 2001 peak. The modest increases in the production of industrial and other equipment in January and February were led by gains in the output of industrial and other general purpose machinery. The index for defense and space equipment moved up further in February and has risen 4.6 percent during the past twelve months.
The output of construction supplies was little changed, on balance, in January and February. Business supplies expanded in February for the second consecutive month, as commercial energy products, especially commercial and other electricity sales, increased significantly.
The index of industrial materials, which rose 0.3 percent in February, was boosted by another sizable increase in the production of energy materials. The production of non-energy materials was unchanged, as a small decline in durable materials was entirely offset by gains in nondurable materials, particularly paper products and chemical products.
Industry Groups
Manufacturing output edged down 0.1 percent in February. The overall factory operating rate declined 0.2 percentage point, to 73.4 percent. A 0.3 percent drop in the production of durable goods was led by a pullback in motor vehicles assemblies. Other industries that contributed to the decline include wood products and primary metal, particularly steel. Among high-technology industries, both computers and semiconductors posted significant gains. The gain of 0.1 percent in the production of nondurables ended six consecutive months of decline for that group. The production of other (non-NAICS) manufacturing industries (publishing and logging) rose for the third consecutive month.
Output at mines rose 1.0 percent in February; the utilization rate increased 0.8 percentage point, to 85.8 percent. Utilities production, which surged in January, rose an additional 1.3 percent in February. Both natural gas production and electricity generation contributed to the increased ouptut. Capacity utilization for utilities, at 88.5 percent, was 1.8 percentage points above its 1972-2002 average.
By stage of processing, the rate of capacity utilization rose 0.9 percentage point for industries in the crude stage, rose 0.1 percentage point for those in the primary and semifinished stages, and fell 0.4 percentage point for those in the finished stage.
Note: Indexes for production, utilization, and capacity for communications equipment and all affected aggregates have been re-issued for the period to 1996. The rates of change for the output of communications equipment were revised up from 1987 to 1996 by about 2 percentage points per year on average. The corresponding capacity indexes were revised up by a similar amount, and thus, utilization rates were little changed. Estimates of the gross value of products were restated through January 2003 because estimates for the base year (1996) were revised.
G.17 Release Tables:
| Ascii | Screen reader | Summary: Industrial Production and Capacity Utilization | Chart | Chart 1: Industrial Production, Capacity, and Capacity Utilization | Chart | Chart 2: Industrial Production and Capacity Utilization | Chart | Chart 3: Industrial Production and Capacity Utilization, High Technology Industries |
| Ascii | Screen reader | Table 1:Industrial Production: Market and Industry Groups (percent change) |
| Ascii | Screen reader | Table 2:Industrial Production: Special Aggregates and Selected Detail (percent change) |
| Ascii | Screen reader | Table 3: Motor Vehicle Assemblies |
| Ascii | Screen reader | Table 4: Industrial Production Indexes: Market and Industry Group Summary |
| Ascii | Screen reader | Table 5: Industrial Production Indexes: Special Aggregates |
| Ascii | Screen reader | Table 6: Diffusion Indexes of Industrial Production |
| Ascii | Screen reader | Table 7: Capacity Utilization: Manufacturing, Mining, and Utilities |
| Ascii | Screen reader | Table 8: Industrial Capacity: Manufacturing, Mining, and Utilities (percent change) |
| Ascii | Screen reader | Table 9: Industrial Production: Gross Value of Products |
| Ascii | Screen reader | Table 10: Gross-Value-Weighted Industrial Production: Stage-of-Process Groups |
| Ascii | Screen reader | Table 11: Electric Power Use: Manufacturing and Mining |
| Ascii | Screen reader | Table 12: Historical Statistics for IP, Capacity, and Utilization: Total Industry |
| Ascii | Screen reader | Table 13: Historical Statistics for IP, Capacity, and Utilization: Manufacturing |
| Ascii | Screen reader | Table 14: Historical Statistics for IP, Capacity, and Utilization: Total Industry excluding Selected High-Technology Industries |
| Ascii | Screen reader | Table 15: Historical Statistics for IP, Capacity, and Utilization: Manufacturing excluding Selected High-Technology Industries |
Release dates | Historical data | Documentation
Current Monthly Release Other formats: ASCII | PDF (144 KB)
Supplemental Monthly Release Other formats: ASCII | PDF (144 KB)
Annual Revision Release Other formats: ASCII | PDF (150 KB)