
Release Date: November 14, 2003
Release dates | Historical data | Documentation
Current Monthly Release Other formats: ASCII | PDF (144 KB)
Supplemental Monthly Release Other formats: ASCII | PDF (144 KB)
Annual Revision Release Other formats: ASCII | PDF (150 KB)
INDUSTRIAL PRODUCTION AND CAPACITY UTILIZATION
[2003 Revision Notice Below]
| 1997=100 | Percent change | ||||||||
|---|---|---|---|---|---|---|---|---|---|
| 2003 | 2003 | Oct. '02 to | |||||||
| Industrial production | July | Aug. | Sept. | Oct. | July | Aug. | Sept. | Oct. | Oct. '03 |
| Total index | 110.8 | 111.0 | 111.5 | 111.8 | .8 | .2 | .5 | .2 | .6 |
| Previous estimates | 110.8 | 110.8 | 111.3 | .7 | .1 | .4 | |||
| Major market groups | |||||||||
| Final Products | 107.1 | 107.3 | 107.8 | 107.4 | .6 | .2 | .4 | -.3 | -.1 |
| Consumer goods | 105.8 | 105.9 | 106.2 | 105.8 | .7 | .0 | .3 | -.3 | -.8 |
| Business equipment | 109.3 | 110.0 | 110.8 | 110.2 | .3 | .6 | .7 | -.5 | 1.2 |
| Nonindustrial supplies | 108.7 | 109.0 | 108.8 | 109.9 | .8 | .3 | -.1 | 1.0 | .5 |
| Construction | 101.5 | 101.9 | 102.2 | 103.2 | .7 | .4 | .3 | 1.0 | .0 |
| Materials | 115.4 | 115.5 | 116.5 | 116.9 | .9 | .1 | .8 | .4 | 1.4 |
| Major industry groups | |||||||||
| Manufacturing (see note below) | 111.8 | 111.8 | 112.6 | 112.7 | .5 | .0 | .7 | .1 | .7 |
| Previous estimates | 111.7 | 111.5 | 112.3 | .5 | -.2 | .7 | |||
| Mining | 93.4 | 93.0 | 94.0 | 93.2 | .2 | -.4 | 1.0 | -.8 | 1.5 |
| Utilities | 111.3 | 113.3 | 111.0 | 113.2 | 3.1 | 1.8 | -2.0 | 2.0 | -.2 |
| Capacity | |||||||||
|---|---|---|---|---|---|---|---|---|---|
| Percent of capacity | growth | ||||||||
| Average | 1982 | 1988-89 | 2002 | 2003 | Oct. '02 to | ||||
| Capacity utilization | 1972-2002 | Low | High | Oct. | July | Aug. | Sept. | Oct. | Oct. '03 |
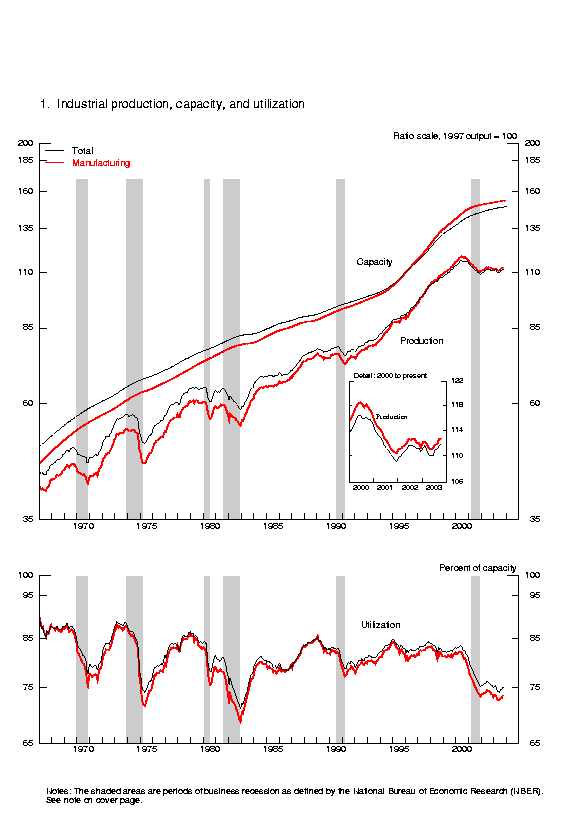
| Total industry | 81.3 | 70.9 | 85.2 | 75.4 | 74.5 | 74.6 | 74.9 | 75.0 | 1.1 |
| Previous estimates | 74.5 | 74.5 | 74.8 | ||||||
| Manufacturing (see note below) | 80.2 | 68.7 | 85.6 | 73.7 | 73.0 | 73.0 | 73.5 | 73.5 | 1.0 |
| Previous estimates | 73.0 | 72.8 | 73.3 | ||||||
| Mining | 86.9 | 78.6 | 85.6 | 83.2 | 85.0 | 84.7 | 85.6 | 84.9 | -.5 |
| Utilities | 87.0 | 77.6 | 92.8 | 87.9 | 83.4 | 84.6 | 82.7 | 84.0 | 4.5 |
| Stage-of-process groups | |||||||||
| Crude | 86.4 | 77.2 | 88.5 | 82.1 | 83.9 | 83.3 | 84.1 | 83.5 | -1.2 |
| Primary and semifinished | 82.4 | 68.1 | 86.4 | 77.8 | 76.3 | 76.6 | 76.7 | 77.4 | 1.8 |
| Finished | 78.4 | 71.3 | 83.2 | 71.3 | 70.8 | 70.7 | 71.1 | 70.7 | .9 |
r Revised. p Preliminary.
The statistics in this release cover output, capacity, and capacity utilization in the
industrial sector, which the Federal Reserve defines as manufacturing, mining, and electric and
gas utilities. Manufacturing comprises those industries included in the North American Industry
Classification System, or NAICS, manufacturing plus the logging and newspaper, periodical,
book and directory publishing industries that have traditionally been considered manufacturing
and included in the industrial sector.
Market Groups
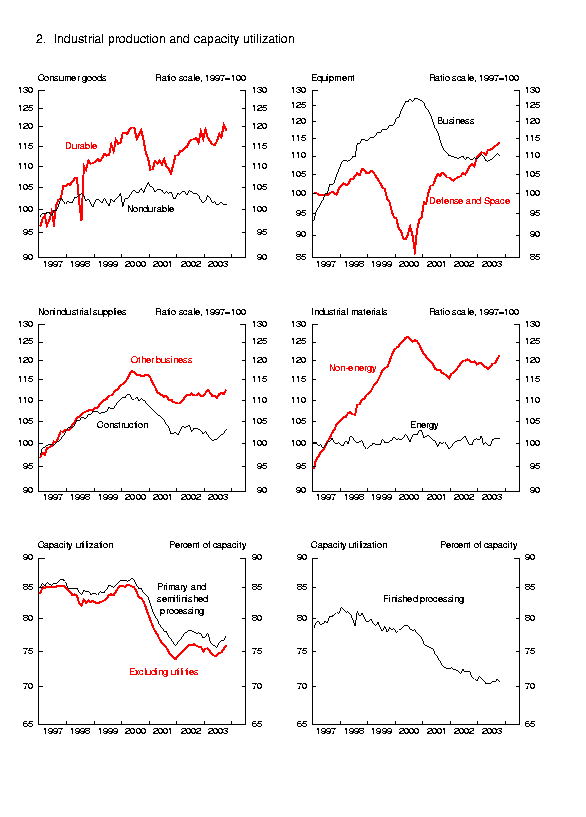
The output of consumer goods decreased 0.3 percent in October. The production of durable consumer goods fell 1.3 percent. A decline of 2.9 percent in the index for automotive products more than offset increases in all other major categories of consumer durables, including a rise of 2.3 percent in the output of home electronics. The production of consumer nondurables in October was unchanged from the September level. The output of non-energy nondurables slid 0.3 percent, but the output of consumer energy products moved up 1.2 percent. Within the non-energy category, declines in the production of foods and tobacco and of chemical products more than offset increases in the output of paper products and clothing; the output of clothing was still 13.6 percent below its year-earlier level despite the increase in October. The production of business equipment fell back 0.5 percent. Declines in the output of transit equipment and of industrial and other equipment, particularly farm equipment, outweighed an increase in the production of information processing equipment. The output of defense and space equipment moved up 0.5 percent and was 5.5 percent higher than its level a year earlier. The indexes for construction supplies and for business supplies each climbed 1.0 percent.
The output of industrial materials rose 0.4 percent in October and was 1.4 percent higher than its year-earlier level. The production of durable materials increased 0.9 percent, while the indexes for nondurable materials and energy materials were little changed. Among durable materials, the indexes for equipment parts and for other durables posted noticeable gains.
Industry Groups
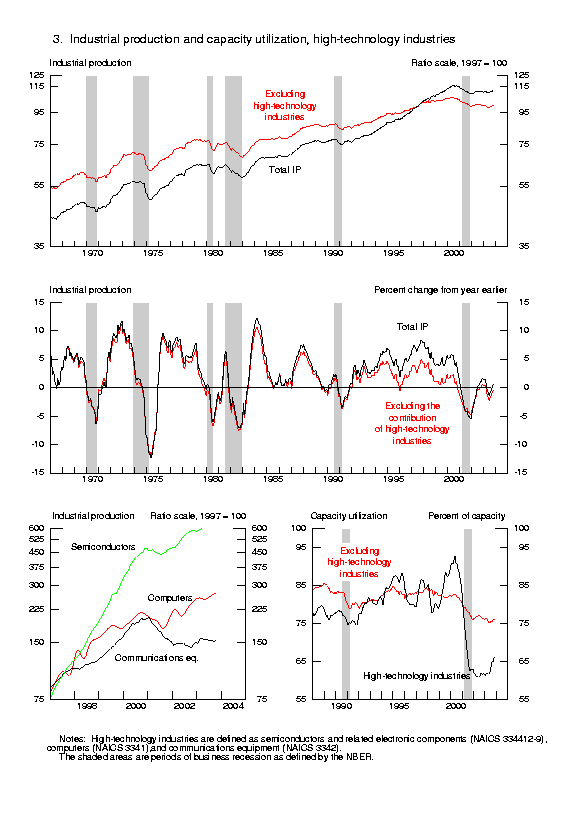
Despite a decline of 3.8 percent in the production of motor vehicles and parts, manufacturing output edged up 0.1 percent in October. Excluding motor vehicles and parts, manufacturing output increased 0.4 percent. Among durable goods industries, sizable increases were posted for primary metals (particularly steel), wood products, and computers and electronic products. In the latter category, all three major components--computers, semiconductors, and communications equipment--recorded gains to move the index 15.5 percent higher than its year-ago level. Smaller increases were recorded in the indexes for fabricated metal products; electrical equipment, appliances, and components; furniture and related products; and nonmetallic mineral products. The output of nondurables fell 0.1 percent in October. Declines in the production of food, beverage, and tobacco products, of chemical products, and of paper more than offset increases in the other nondurables industries. The index for other manufacturing industries, which consists of logging and of newspaper, periodical, book, and directory publishing, moved up 1.6 percent.
The factory operating rate in October was 73.5 percent, 6.7 percentage points below its 1972-2002 average. By stage-of-processing category, capacity utilization for industries in the primary and semifinished stage increased 0.7 percentage point, to 77.4 percent. The utilization rates for industries in the crude and finished stages fell in October. The operating rate at mines declined 0.7 percentage point, to 84.9 percent, and the rate at utilities increased 1.3 percentage points, to 84.0 percent.
| Ascii | Screen reader | Summary: Industrial Production and Capacity Utilization | Chart | Chart 1: Industrial Production, Capacity, and Capacity Utilization | Chart | Chart 2: Industrial Production and Capacity Utilization | Chart | Chart 3: Industrial Production and Capacity Utilization, High Technology Industries |
| Ascii | Screen reader | Table 1:Industrial Production: Market and Industry Groups (percent change) |
| Ascii | Screen reader | Table 2:Industrial Production: Special Aggregates and Selected Detail (percent change) |
| Ascii | Screen reader | Table 3: Motor Vehicle Assemblies |
| Ascii | Screen reader | Table 4: Industrial Production Indexes: Market and Industry Group Summary |
| Ascii | Screen reader | Table 5: Industrial Production Indexes: Special Aggregates |
| Ascii | Screen reader | Table 6: Diffusion Indexes of Industrial Production |
| Ascii | Screen reader | Table 7: Capacity Utilization: Manufacturing, Mining, and Utilities |
| Ascii | Screen reader | Table 8: Industrial Capacity: Manufacturing, Mining, and Utilities (percent change) |
| Ascii | Screen reader | Table 9: Industrial Production: Gross Value of Products |
| Ascii | Screen reader | Table 10: Gross-Value-Weighted Industrial Production: Stage-of-Process Groups |
| Ascii | Screen reader | Table 11: Electric Power Use: Manufacturing and Mining |
| Ascii | Screen reader | Table 12: Historical Statistics for IP, Capacity, and Utilization: Total Industry |
| Ascii | Screen reader | Table 13: Historical Statistics for IP, Capacity, and Utilization: Manufacturing |
| Ascii | Screen reader | Table 14: Historical Statistics for IP, Capacity, and Utilization: Total Industry excluding Selected High-Technology Industries |
| Ascii | Screen reader | Table 15: Historical Statistics for IP, Capacity, and Utilization: Manufacturing excluding Selected High-Technology Industries |
Release dates | Historical data | Documentation
Current Monthly Release Other formats: ASCII | PDF (144 KB)
Supplemental Monthly Release Other formats: ASCII | PDF (144 KB)
Annual Revision Release Other formats: ASCII | PDF (150 KB)