
INDUSTRIAL PRODUCTION AND CAPACITY UTILIZATION
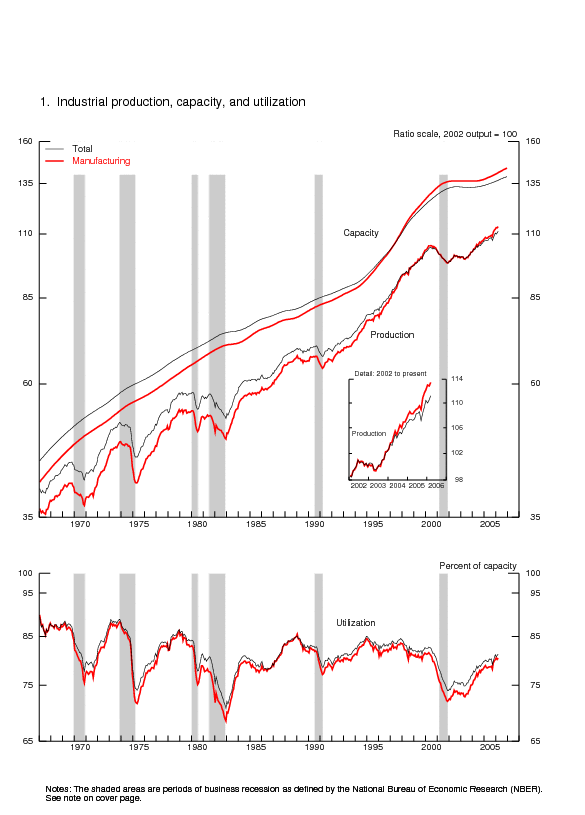
Industrial production increased 0.6 percent in March after a downward-revised gain of 0.5 percent
in February. For the first quarter as a whole, industrial production rose at an annual rate of 4.5
percent. In March, manufacturing output advanced 0.5 percent after little change in February. The output
of mines was up 0.9 percent, and the output of utilities increased 0.5 percent. At 111.2 percent of its
2002 average, overall industrial production in March was 3.6 percent above its year-earlier level.
Capacity utilization for total industry moved up in March to 81.3 percent, a rate that was 0.3 percentage
point above its 1972-2005 average. The factory operating rate, at 80.4 percent, was 0.6 percentage point
above its 1972-2005 average. Capacity utilization in mining rose to a rate about equal to its 1972-2005
average. The operating rate for utilities also increased, but it remained below its long-run average.
| Industrial production |
2002=100 | Percent change | |||||||
|---|---|---|---|---|---|---|---|---|---|
| 2005 Dec. |
2006 | 2005 Dec. |
2006 | Mar. '05 to Mar. '06 |
|||||
| Jan. | Feb. | Mar. | Jan. | Feb. | Mar. | ||||
| Total index | 110.4 | 110.0 | 110.6 | 111.2 | 1.0 | -.4 | .5 | .6 | 3.6 |
| Previous estimates | 110.4 | 110.2 | 110.9 | 1.0 | -.3 | .7 | |||
| Major market groups | |||||||||
| Final Products | 112.3 | 111.8 | 112.5 | 113.0 | .7 | -.5 | .6 | .5 | 4.5 |
| Consumer goods | 106.6 | 105.5 | 106.2 | 106.6 | .8 | -1.0 | .7 | .5 | 1.9 |
| Business equipment | 126.4 | 127.7 | 128.0 | 129.0 | .5 | 1.1 | .2 | .8 | 10.9 |
| Nonindustrial supplies | 111.1 | 109.6 | 110.1 | 110.5 | .7 | -1.4 | .5 | .3 | 3.8 |
| Construction | 113.1 | 113.2 | 112.3 | 112.5 | -.3 | .1 | -.8 | .2 | 5.9 |
| Materials | 108.3 | 108.4 | 108.8 | 109.6 | 1.3 | .1 | .4 | .8 | 2.7 |
| Major industry groups | |||||||||
| Manufacturing (see note below) | 112.2 | 113.0 | 112.8 | 113.4 | .4 | .7 | -.1 | .5 | 4.8 |
| Previous estimates | 112.2 | 113.1 | 113.1 | .4 | .8 | .0 | |||
| Mining | 95.5 | 97.1 | 96.5 | 97.4 | 2.6 | 1.7 | -.7 | .9 | -3.0 |
| Utilities | 109.2 | 96.5 | 104.2 | 104.8 | 4.2 | -11.6 | 8.0 | .5 | .0 |
| Capacity utilization |
Percent of capacity |
Capacity growth Mar. '05 to Mar. '06 |
|||||||
|---|---|---|---|---|---|---|---|---|---|
| Average 1972-2005 |
1994-95 High |
2001-02 Low |
2005 Mar. |
2005 Dec. |
2006 | ||||
| Jan. | Feb. | Mar. | |||||||
| Total industry | 81.0 | 85.0 | 73.9 | 79.9 | 81.1 | 80.7 | 81.0 | 81.3 | 1.8 |
| Previous estimates | 81.2 | 80.8 | 81.2 | ||||||
| Manufacturing (see note below) | 79.8 | 84.5 | 72.0 | 78.5 | 80.1 | 80.5 | 80.2 | 80.4 | 2.3 |
| Previous estimates | 80.1 | 80.5 | 80.4 | ||||||
| Mining | 87.3 | 89.0 | 85.6 | 89.5 | 85.4 | 86.8 | 86.3 | 87.2 | -.4 |
| Utilities | 86.7 | 93.7 | 83.7 | 85.2 | 89.0 | 78.6 | 84.9 | 85.3 | -.1 |
| Stage-of-process groups | |||||||||
| Crude | 86.4 | 89.4 | 83.2 | 88.5 | 84.0 | 85.6 | 85.3 | 86.0 | -.7 |
| Primary and semifinished | 82.1 | 88.1 | 74.6 | 81.4 | 83.2 | 81.5 | 82.1 | 82.4 | 2.7 |
| Finished | 77.9 | 80.5 | 70.8 | 76.1 | 78.4 | 78.9 | 78.9 | 79.2 | 1.5 |
Market Groups
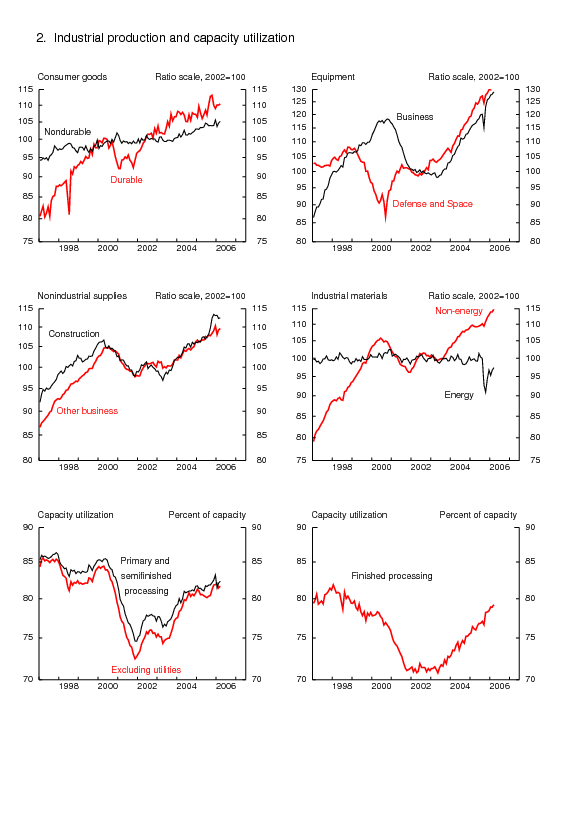
The production of consumer goods rose 0.5 percent in March but fell at an annual rate of 0.5 percent in the first quarter. The index of consumer durables advanced 0.3 percent in March; higher output of automotive products and of appliances, furniture, and carpeting more than offset declines in the production of home electronics and of miscellaneous goods. The index of consumer nondurables rose 0.5 percent but was held down by a drop of 0.4 percent in consumer energy products. The output of non-energy nondurable consumer goods was up 0.7 percent, and gains were widespread.
The production of business equipment rose 0.8 percent in March and increased at an annual rate of 10.6 percent in the first quarter. The indexes for information processing equipment and for industrial and other equipment both increased 1.2 percent in March. Although the production of transit equipment moved lower for the month, it was up at an annual rate of 26.4 percent in the first quarter, an increase driven in part by sharp gains in the output of civilian aircraft and medium and heavy trucks. The output of defense and space equipment fell 0.3 percent in March, after a jump of 1.4 percent in February. Construction supplies moved up 0.2 percent, and business supplies advanced 0.3 percent. Both posted small declines for the first quarter as a whole.
The production of industrial materials rose 0.8 percent in March and was up at an annual rate of 8.8 percent in the first quarter. The indexes for both energy and non-energy materials increased 0.8 percent in March. The output of durable materials advanced 1.1 percent, and consumer parts and equipment parts had notable gains. The output of nondurable materials edged up 0.2 percent, as a decrease in the production of textiles was offset by advances elsewhere.
Industry Groups
Manufacturing production moved up in March and rose 5.4 percent at an annual rate in the first quarter. The output of durable goods rose 0.7 percent in March; among the industries posting gains were fabricated metal products; machinery; computer and electronic products; electrical equipment, appliances, and components; motor vehicles and parts; and furniture and related products. Although the production of nonmetallic mineral products and of aerospace and miscellaneous transportation equipment fell in March, both components posted sizable gains over the first quarter as a whole. The production of nondurable goods rose 0.3 percent in March; it increased at an annual rate of 7.2 percent in the first quarter. Among the nondurable goods industries posting production gains was apparel and leather products, which showed a jump of 2.1 percent in output in March, the fifth consecutive monthly increase. Production in the non-NAICS manufacturing industries (logging and publishing) increased 0.5 percent in March but was down at an annual rate of 1.3 percent in the first quarter.
The output of mines rose in March and was up more than 20 percent at an annual rate in the first quarter, an increase due to the continued recovery of the oil and gas facilities that were affected by last year�s hurricanes and a surge in the output of coal mines. The index for oil and natural gas extraction moved higher in March and increased at a 24 percent annual rate in the first quarter; however, the March level of the index was 6.5 percent below its year-ago level. The output of natural gas utilities rose 3.5 percent; electricity output edged lower.
By stage of processing, capacity utilization for industries in the crude stage of processing rose to 86.0 percent in March, a rate 0.4 percentage point below its 1972-2005 average. For industries in the primary and semifinished stages of processing, the utilization rate rose to 82.4 percent, a level slightly above its 1972-2005 average of 82.1 percent. For producers in the finished stage, the utilization rate moved up to 79.2 percent, which is 1.3 percentage points above its 1972-2005 average.
Note. The statistics in this release cover output, capacity, and capacity utilization in the
U.S. industrial sector, which is defined by the Federal Reserve to comprise manufacturing,
mining, and electric and gas utilities. Mining is defined as all industries in sector 21 of the
North American Industry Classification System (NAICS); electric and gas utilities are those in
NAICS sectors 2211 and 2212. Manufacturing comprises NAICS manufacturing industries (sector 31-33)
plus the logging industry and the newspaper, periodical, book, and directory publishing industries.
Logging and publishing are classified elsewhere in NAICS (under agriculture and information
respectively), but historically they were considered to be manufacturing and were included in
the industrial sector under the Standard Industrial Classification (SIC) system. In December 2002
the Federal Reserve reclassified all its industrial output data from the SIC system to NAICS.
G.17 Release Tables:
| Ascii | Screen reader | Summary: Industrial Production and Capacity Utilization | Chart | Chart 1: Industrial Production, Capacity, and Capacity Utilization | Chart | Chart 2: Industrial Production and Capacity Utilization | Chart | Chart 3: Industrial Production and Capacity Utilization, High Technology Industries |
| Ascii | Screen reader | Table 1: Industrial Production: Market and Industry Groups (percent change) |
| Ascii | Screen reader | Table 2: Industrial Production: Special Aggregates and Selected Detail (percent change) |
| Ascii | Screen reader | Table 3: Motor Vehicle Assemblies |
| Ascii | Screen reader | Table 4: Industrial Production Indexes: Market and Industry Group Summary |
| Ascii | Screen reader | Table 5: Industrial Production Indexes: Special Aggregates |
| Ascii | Screen reader | Table 6: Diffusion Indexes of Industrial Production |
| Ascii | Screen reader | Table 7: Capacity Utilization: Manufacturing, Mining, and Utilities |
| Ascii | Screen reader | Table 8: Industrial Capacity: Manufacturing, Mining, and Utilities (percent change) |
| Ascii | Screen reader | Table 9: Industrial Production: Gross Value of Products and Nonindustrial Supplies |
| Ascii | Screen reader | Table 10: Gross-Value-Weighted Industrial Production: Stage-of-Process Groups |
| Ascii | Screen reader | Table 11: Historical Statistics for IP, Capacity, and Utilization: Total Industry |
| Ascii | Screen reader | Table 12: Historical Statistics for IP, Capacity, and Utilization: Manufacturing |
| Ascii | Screen reader | Table 13: Historical Statistics for IP, Capacity, and Utilization: Total Industry excluding Selected High-Technology Industries |
| Ascii | Screen reader | Table 14: Historical Statistics for IP, Capacity, and Utilization: Manufacturing excluding Selected High-Technology Industries |
Release dates | Historical data | Data Download |Documentation
Current Monthly Release Other formats: ASCII | PDF (144 KB)
Supplemental Monthly Release Other formats: ASCII | PDF (144 KB)
Annual Revision Release Other formats: ASCII | PDF (150 KB)