
INDUSTRIAL PRODUCTION AND CAPACITY UTILIZATION
[2006 Revision Notice Below]
Industrial production rose 0.4 percent in December after a decrease of 0.1 percent in November.
Output in November was previously estimated to have advanced; weaker data for a number of industries,
particularly steel, led to the downward revision. For the fourth quarter as a whole, industrial production
decreased 0.5 percent (annual rate). In the manufacturing sector, output increased 0.7 percent in
December, and most major industry groups registered gains. The output of utilities fell 2.6 percent, the
result of relatively mild temperatures during the month, while the output of mines moved up 0.8 percent.
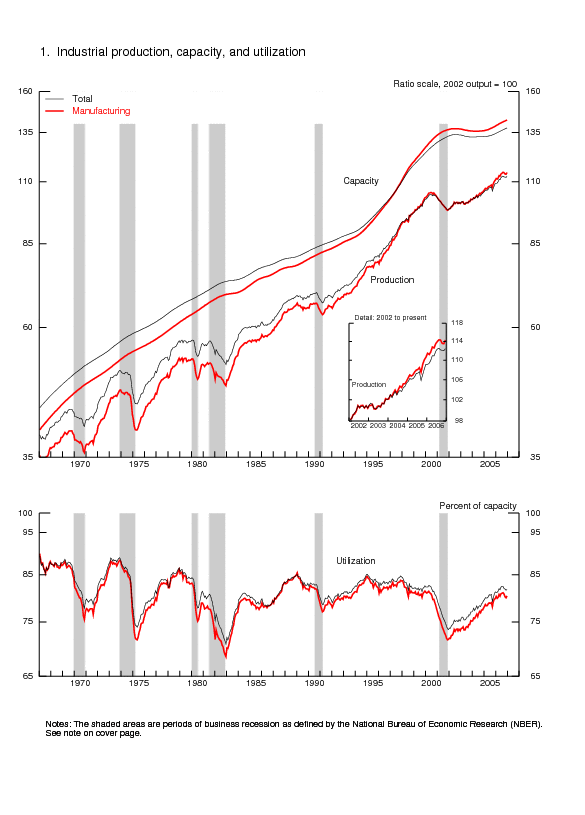
Over the twelve months ending in December, total industrial production increased 3.0 percent, to a level
that was 112.4 percent of its 2002 average, and total industrial capacity expanded 2.4 percent. The rate
of capacity utilization in December, at 81.8 percent, was 0.5 percentage point above its year-earlier level
and 0.8 percentage point above its 1972-2005 average.
| Industrial production |
2002=100 | Percent change | |||||||
|---|---|---|---|---|---|---|---|---|---|
| 2006 | 2006 | Dec. '05 to Dec. '06 |
|||||||
| Sept. | Oct. | Nov. | Dec. | Sept. | Oct. | Nov. | Dec. | ||
| Total index | 112.2 | 112.1 | 112.0 | 112.4 | -.3 | -.1 | -.1 | .4 | 3.0 |
| Previous estimates | 112.1 | 112.1 | 112.3 | -.4 | .0 | .2 | |||
| Major market groups | |||||||||
| Final Products | 112.7 | 112.4 | 112.7 | 113.4 | -.1 | -.3 | .2 | .6 | 2.9 |
| Consumer goods | 107.6 | 107.2 | 107.3 | 107.6 | -.1 | -.4 | .1 | .2 | .6 |
| Business equipment | 128.5 | 128.6 | 129.8 | 131.8 | -.1 | .1 | .9 | 1.6 | 10.4 |
| Nonindustrial supplies | 110.7 | 111.1 | 110.5 | 110.7 | -.7 | .4 | -.5 | .2 | 1.1 |
| Construction | 110.3 | 109.0 | 107.9 | 108.2 | -.9 | -1.1 | -1.0 | .2 | -2.8 |
| Materials | 112.2 | 112.1 | 111.9 | 112.2 | -.4 | -.1 | -.1 | .2 | 3.8 |
| Major industry groups | |||||||||
| Manufacturing (see note below) | 114.3 | 113.6 | 113.5 | 114.3 | .0 | -.6 | .0 | .7 | 3.3 |
| Previous estimates | 114.3 | 113.7 | 113.9 | -.1 | -.5 | .3 | |||
| Mining | 101.0 | 101.1 | 100.6 | 101.4 | 1.1 | .0 | -.4 | .8 | 4.7 |
| Utilities | 104.5 | 109.3 | 109.6 | 106.7 | -3.9 | 4.6 | .2 | -2.6 | -1.1 |
| Capacity utilization |
Percent of capacity |
Capacity growth Dec. '05 to Dec. '06 |
|||||||
|---|---|---|---|---|---|---|---|---|---|
| Average 1972-2005 |
1994-95 High |
2001-02 Low |
2005 Dec. |
2006 | |||||
| Sept. | Oct. | Nov. | Dec. | ||||||
| Total industry | 81.0 | 85.1 | 73.6 | 81.3 | 82.0 | 81.8 | 81.6 | 81.8 | 2.4 |
| Previous estimates | 82.0 | 81.8 | 81.8 | ||||||
| Manufacturing (see note below) | 79.8 | 84.6 | 71.6 | 79.8 | 80.9 | 80.2 | 80.0 | 80.4 | 2.6 |
| Previous estimates | 80.8 | 80.3 | 80.3 | ||||||
| Mining | 87.3 | 88.9 | 84.8 | 87.8 | 91.2 | 91.1 | 90.7 | 91.3 | .7 |
| Utilities | 86.8 | 93.7 | 83.8 | 87.9 | 83.9 | 87.6 | 87.6 | 85.1 | 2.2 |
| Stage-of-process groups | |||||||||
| Crude | 86.4 | 89.5 | 82.0 | 85.6 | 89.6 | 89.2 | 88.9 | 89.1 | .3 |
| Primary and semifinished | 82.2 | 88.2 | 74.6 | 83.9 | 83.5 | 83.3 | 82.7 | 82.5 | 3.0 |
| Finished | 77.8 | 80.5 | 70.0 | 76.7 | 78.0 | 77.7 | 78.1 | 78.6 | 2.2 |
Market Groups
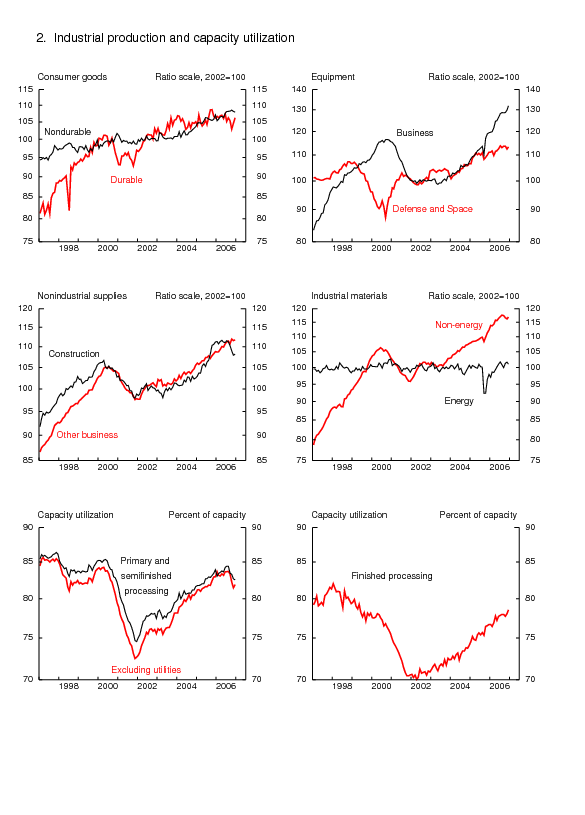
The output of consumer goods edged up 0.2 percent in December; a gain of 1.5 percent in consumer durables more than offset a small decrease in consumer nondurables. For the fourth quarter as a whole, consumer goods fell 0.8 percent (annual rate). The gains in consumer durables were widespread in December; automotive products advanced 2.3 percent, home electronics gained 1.9 percent, and smaller increases were recorded elsewhere.
The output of consumer nondurables, pulled down by a decrease in the index for residential energy sales, declined 0.2 percent. The output of non-energy nondurables in December was unchanged; a decline of 0.3 percent in the production of foods and tobacco offset gains in the production of clothing, of chemical products, and of paper products.
Broad-based advances lifted the output of business equipment 1.6 percent in December; for the fourth quarter as a whole, this index rose at an annual rate of 5.4 percent. Strength in commercial aircraft production continued to support gains in the index for transit equipment. The output of information processing equipment picked up 1.2 percent in December, the fourth consecutive month of gains around 1 percent. Industrial and other equipment production advanced 1.3 percent in December but was little changed for the quarter as a whole. For December, the production of defense and space equipment increased 0.8 percent.
Construction supplies output edged up 0.2 percent in December after four consecutive months of declines; for the fourth quarter as a whole, this index fell at an annual rate of more than 9 percent. The index for materials also edged up in December after several months of declines; the gains were broadly based except for energy materials, which declined.
Industry Groups
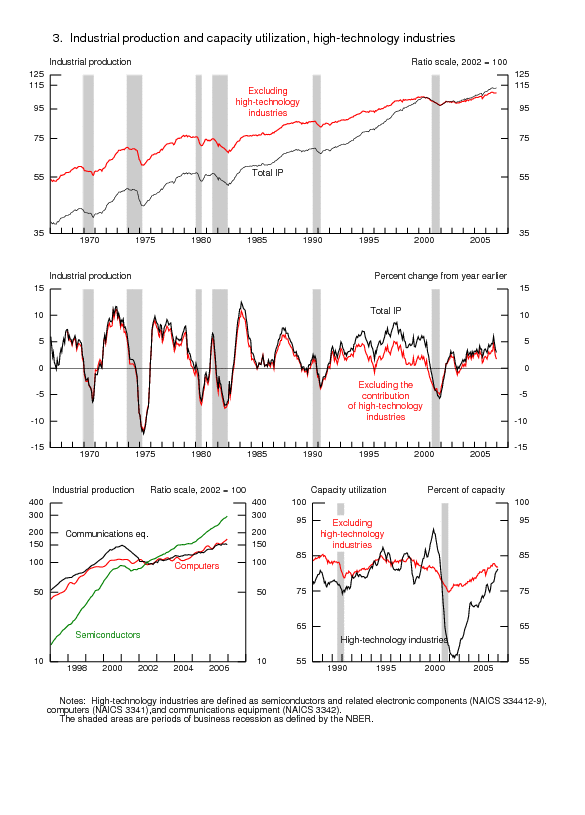
Manufacturing production increased 0.7 percent in December; however, output for the fourth quarter as a whole was down 1.4 percent (annual rate) from the third quarter. In December, the factory operating rate moved up 0.4 percentage point, to 80.4 percent, 0.6 percentage point above its 1972-2005 average. The production of durable goods increased 1.1 percent in December; the largest gains were in motor vehicles and parts and in computer and electronic product manufacturing. Most other major durable goods industries also showed gains; the exceptions were nonmetallic mineral products, fabricated metal products, and furniture and related products, all of which continued their recent monthly declines. Among the selected high-technology industries, gains in computer and peripheral equipment and in semiconductors and related electronic components more than offset a decrease in the output of communications equipment. After five months of declines, primary metal production, supported by an increase of 1.6 percent in iron and steel production, turned up in December. Likewise, machinery manufacturing advanced 1.2 percent after several months of declines. The production of nondurable goods, which increased 0.3 percent, included sizable gains for apparel and leather and for petroleum and coal products; smaller increases were posted in paper, in printing and support, and in chemicals. In contrast, the production indexes for food, beverage, and tobacco products, for textile and product mills, and for plastics and rubber products all declined. Production in the non-NAICS manufacturing industries (logging and publishing) edged up.
In December, the output of natural gas utilities dropped 8.9 percent, and the output of electric utilities decreased 1.4 percent. The gain in mining output was primarily due to increases in crude oil extraction and in nonmetallic mineral mining. Capacity utilization for industries in the crude stage of processing increased 0.2 percentage point, to 89.1 percent, a rate that is 2.7 percentage points above its 1972-2005 average. Capacity utilization for industries in the primary and semifinished stages edged down 0.2 percentage point, to 82.5 percent, and the capacity utilization for finished goods producers increased 0.5 percentage point, to 78.6 percent.
| Ascii | Screen reader | Summary: Industrial Production and Capacity Utilization | Chart | Chart 1: Industrial Production, Capacity, and Capacity Utilization | Chart | Chart 2: Industrial Production and Capacity Utilization | Chart | Chart 3: Industrial Production and Capacity Utilization, High Technology Industries |
| Ascii | Screen reader | Table 1: Industrial Production: Market and Industry Groups (percent change) |
| Ascii | Screen reader | Table 2: Industrial Production: Special Aggregates and Selected Detail (percent change) |
| Ascii | Screen reader | Table 3: Motor Vehicle Assemblies |
| Ascii | Screen reader | Table 4: Industrial Production Indexes: Market and Industry Group Summary |
| Ascii | Screen reader | Table 5: Industrial Production Indexes: Special Aggregates |
| Ascii | Screen reader | Table 6: Diffusion Indexes of Industrial Production |
| Ascii | Screen reader | Table 7: Capacity Utilization: Manufacturing, Mining, and Utilities |
| Ascii | Screen reader | Table 8: Industrial Capacity: Manufacturing, Mining, and Utilities (percent change) |
| Ascii | Screen reader | Table 9: Industrial Production: Gross Value of Products and Nonindustrial Supplies |
| Ascii | Screen reader | Table 10: Gross-Value-Weighted Industrial Production: Stage-of-Process Groups |
| Ascii | Screen reader | Table 11: Historical Statistics for IP, Capacity, and Utilization: Total Industry |
| Ascii | Screen reader | Table 12: Historical Statistics for IP, Capacity, and Utilization: Manufacturing |
| Ascii | Screen reader | Table 13: Historical Statistics for IP, Capacity, and Utilization: Total Industry excluding Selected High-Technology Industries |
| Ascii | Screen reader | Table 14: Historical Statistics for IP, Capacity, and Utilization: Manufacturing excluding Selected High-Technology Industries |