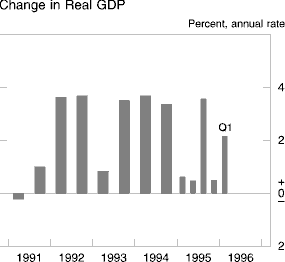
|
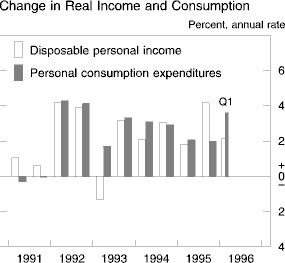
Outlays for durable goods have continued to be the strongest component
of spending, extending the long-standing uptrend in the share of
durables in total real consumption. Declining relative prices and the
availability of innovative products have continued to lift demand
for home electronic equipment and software products. In addition, sales
of light motor vehicles, bolstered by relatively generous incentives
and perhaps by the cash freed up by the surge in mortgage
refinancings last winter, averaged a healthy 15 million unit annual
rate in the first half of 1996.
After a lackluster performance in 1995, real outlays for
nondurable goods have also risen this year; the average level of these
expenditures in April and May was nearly 3 percent at an annual
rate above that recorded in the fourth quarter. Meanwhile, spending on
services has remained on a moderate uptrend, with short-run variations
reflecting the effects of weather on household energy use.
Consumer spending has been supported by brisk gains in wage and
salary income associated with the better pace of hiring this
year. However, other components of before-tax income, taken together,
have risen less rapidly than they did in 1995, and gains in after-tax
income were restrained by larger-than-usual tax bills (final payments
less refunds) this spring. Accordingly, the level of the personal
saving rate in May was somewhat below that recorded in late 1995,
although fragmentary data suggest that saving rose sharply in June. In
any event, taking a longer perspective, spending and income have grown
at roughly similar rates over the past few years, and
the saving rate has generally fluctuated in a fairly narrow
band between 4 percent and 5 percent since 1993--a low
level historically.
The recent developments in financial markets may have had an
important influence on the spending decisions of individual households.
In particular, households holding large stock portfolios have enjoyed
sizable increases in wealth over the past year and a half, which may be
inducing them to consume greater fractions of their incomes than they
would otherwise. At the same time, a growing number of households are
apparently finding it difficult to meet their debt-service obligations,
judging from the appreciable rise in delinquency rates on consumer
loans in recent years. In addition, it is possible that job insecurity
and longer-run concerns about retirement income have caused many
households to raise their targets for asset accumulation. However, the
relative stability of the saving rate over the past few years
suggests that the net effect of these factors on overall
consumption--at least to date--has been limited.
Residential construction has, on the whole, been robust this year.
Private housing starts averaged nearly 1.5 million units at an
annual rate through June, a pace appreciably above that in 1995. In
addition, the volume of shipments of mobile homes ("manufactured
housing"), which has doubled over the past five years, now stands
around 350,000 units at an annual rate, the highest level since
1974.
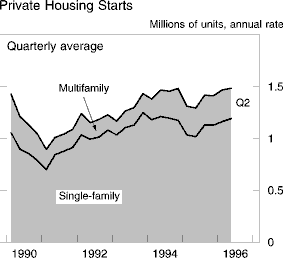
In the single-family sector, starts and sales of new
homes were surprisingly firm in the face of severe weather in early
1996, and they moved still higher in the second quarter. Moreover, the
regular survey of the National Association of Homebuilders continued to
indicate solid demand through early July, and the Mortgage Bankers
Association reported that loan applications for home purchases remained
brisk through midyear.
Relative to the lows reached in early 1996, the rate on 30-year
conventional fixed-rate home mortgages has risen nearly
1-1/2 percentage points and has been fluctuating around
8-1/4 percent in recent weeks. However, a number of factors
seem to have cushioned the effects of these higher mortgage rates. In
particular, rates on adjustable-rate mortgages have risen only about
half as much as have those on 30-year fixed-rate loans. Also, house
prices have firmed somewhat, which may have raised confidence in the
investment value of residential real estate and thus contributed to the
recent rise in the homeownership rate, which is now at its highest
level since the early 1980s. Probably more important in this regard,
however, is the trend in the affordability of housing. One simple
measure of affordability is the monthly mortgage payment on a new
home having a given set of attributes, divided by average monthly
household income. Despite the increase in mortgage rates this year,
this measure suggests that the cash-flow burden of homeownership is
still only modestly above the lows of the past thirty years.
Construction of multifamily housing averaged about 300,000 units
at an annual rate in the first half of 1996, a rate somewhat above that
in 1995 but a fairly low one historically. Market conditions vary
geographically, but the rental vacancy rate for the nation as a
whole seems to have tilted back up, after generally trending down
between mid-1993 and mid-1995. Also, the absorption rate, which
measures the percentage of apartments that are rented within three
months of their completion, edged back down in 1995 after several years
of increases.
The Business Sector
Developments in the business sector were quite favorable in the
first half of 1996. After decelerating in 1995, real business fixed
investment rose at a 12-1/2 percent annual rate in the
first quarter of 1996, with sizable advances for both equipment and
structures. And, although real investment appears to have decelerated
again in the second quarter, it probably posted an appreciable gain.
Over the past four years, real investment has grown around 8
percent per year, on average, and now stands at a level that implies
quite substantial growth in the capital stock. The updating of capital
and the increase in capital per worker are key to lifting
productivity growth and living standards.
Outlays for producers' durable equipment rose at an annual rate of
about 14 percent in real terms in the first quarter, after a
7-1/2 percent rise over the course of 1995. As has been
true throughout the expansion, much of the first-quarter growth was in
real outlays for computers and other information-processing equipment;
such investment received particular impetus from extensive
price cutting in virtually all segments of the computer market and from
a push to acquire the state-of-the-art equipment needed to
take full advantage of popular new software and opportunities for
information transfer. However, incoming orders data and recent
anecdotal reports suggest that the growth in real computer outlays may
be slowing. Meanwhile, demand for other types of capital equipment,
which had softened in 1995, firmed somewhat in the first
quarter.
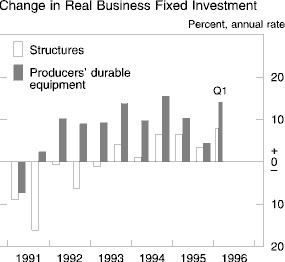
In the nonresidential construction area, real investment
continued to expand in the first quarter. However, the monthly data
suggest that outlays softened in the second quarter, an occurrence that
is consistent with the downturn in contracts--a forward-looking
indicator of construction outlays--since late 1995.
Trends within the construction sector have been divergent. In the
office sector, the modest recovery that seemed to be under way appears
to have waned even though vacancy rates have continued to fall and
transactions prices have continued to rise. Outlays dropped noticeably
in the fourth quarter of 1995 and the first quarter of 1996, and
preliminary data suggest that they remained at a fairly low level in
the second quarter. In contrast, spending for commercial structures
other than office buildings, which has been rising briskly since 1992,
continued to advance through the first quarter--although further gains
may be limited by an emerging excess of retail space in some parts of
the country and the recent leveling out of transactions prices.
Elsewhere, outlays for industrial construction, which had moved up over
1994 and the first half of 1995, have been nearly flat over the past
few quarters, while construction of hotels and motels, which account
for less than 10 percent of structures outlays, has boomed.
Investment in nonfarm business inventories slowed dramatically in
the fourth quarter of 1995 after running at a fairly rapid pace over
much of last year, and it nearly ceased in the first quarter of 1996 as
motor vehicle stocks plummeted. Automotive stocks had risen appreciably
over the second half of 1995, and some reduction was in train even
before a March strike at General Motors curbed production; with the
strike, dealer stocks were drawn down sharply. In addition, although
firms outside motor vehicles apparently made considerable progress in
rectifying inventory imbalances in late 1995, many continued to
restrain production in response to continued weak orders in early 1996;
producers of household durables and textiles are notable
examples.
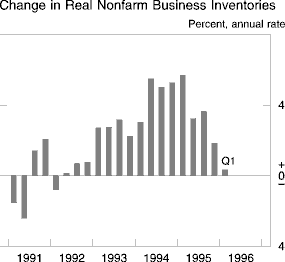
Inventory investment evidently rebounded in the second
quarter, mainly because motor vehicle stocks stabilized as sales and
production returned to rough balance. Outside of motor vehicles,
stocks accumulated moderately, on balance, in April and May. As of
May, inventory--sales ratios for all major sectors were noticeably
below their levels in late 1995; the decline in the ratio for retailers
was especially steep.
Economic profits of all U.S. corporations continued to surge in
the first quarter, extending the steep climb that began in the early
1990s. The strength in profits in recent quarters has been attributable
in large part to robust earnings growth at domestic financial
institutions and a rebound in profits at foreign subsidiaries of U.S.
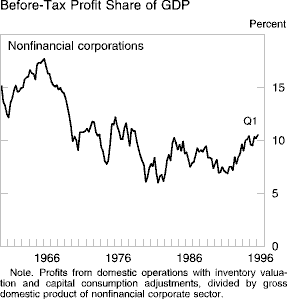
corporations. In the domestic nonfinancial corporate sector, the profit
share--pretax profits divided by the sector's GDP--has been hovering
around 10 percent since mid-1994, after having risen appreciably
over the preceding few years; its current level is similar to the
levels attained in the mid-1980s but well below the highs of the 1960s
and 1970s. About half of the increase in the sector's profit share
since the early 1990s has reflected a reduction in net interest
expenses.
The Government Sector
Although the nation continues to grapple with the prospect of
growing federal budget deficits in the years ahead, the incoming news
on the budget for fiscal 1996 has been extremely favorable. The deficit
in the unified budget over the first eight months of the fiscal
year--the period from October to May--was only $109 billion,
$27 billion less than during the comparable period of fiscal
1995. The improvement in the deficit primarily reflected exceptionally
rapid growth in receipts; outlays continued to rise at about the same
pace as had been recorded, on average, over the preceding four years.
If present trends continue, the fiscal 1996 deficit, when measured as a
percentage of nominal GDP, will be the smallest since 1979.
Federal receipts in the first eight months of fiscal 1996 were
8 percent higher than in the same period a year earlier; the rise
was considerably greater than that of nominal GDP. Boosted by the
upswing in business profits, corporate taxes have been increasing at
double-digit rates since fiscal 1993, and that path has extended into
fiscal 1996. Individual income taxes have also risen sharply this year;
little information is available on the factors behind the surge in
individual payments, but it may have resulted, at least in part, from
capital gains realizations associated with the strong performance in
financial markets last year.
In total, federal outlays in the first eight months of fiscal 1996
were 4 percent higher than during the corresponding period of
fiscal 1995. Outlay growth was damped by the reductions in
discretionary domestic spending implied by this year's appropriations
legislation. However, expenditures for "mandatory" programs
continued to rise rapidly, and net outlays for deposit insurance were
less negative than in 1995 (that is, insurance premiums and the proceeds
from net sales of thrift assets declined). In addition, net interest
payments increased moderately, reflecting the growth in the stock of
outstanding federal debt.
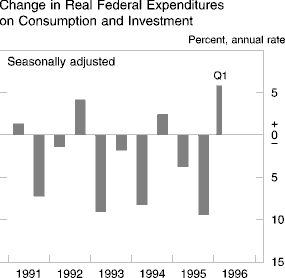
Federal expenditures on consumption and investment--the part of federal
spending included directly in GDP--increased at an annual rate of about
6 percent in real terms in the first quarter of 1996 after
declining about 13 percent in the fourth quarter of
1995. In part, real spending rose in the first quarter because the
government shutdowns that occurred during the budget crisis
depressed real spending less in the first quarter than in the fourth.
Even so, given the enacted appropriations, the first-quarter increase
was almost surely a transitory spike.
The fiscal position of states and localities has been relatively
stable in the aggregate over the past few years. As measured in the
national income and product accounts, the surplus (net of social
insurance funds) in the sector's operating accounts has fluctuated in
the range of $30 billion to $40 billion (annual rate) since
the beginning of 1994; it stood around the middle of that range in the
first quarter. On the whole, these governments are in considerably
better shape than they were in the early 1990s. Even so, the sector
remains under pressure to balance rising demand for
services--especially in education, corrections, and health
care--against the public desire for tax relief.
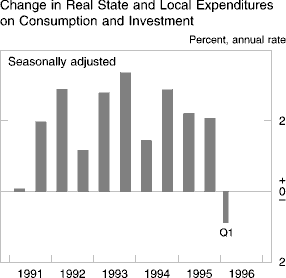
Real expenditures on consumption and gross investment--the part of state
and local spending included directly in GDP--declined somewhat in the
first quarter of 1996. However, the decrease reflected primarily the
effects of the unusually adverse winter weather, and spending appears
to have rebounded in the second quarter. State and local employment
posted a respectable gain, on net, over the first six months of the
year. In addition, outlays for construction rose about
3-1/2 percent in real terms over the year ending in the
first quarter, reflecting higher spending on highways and schools;
monthly construction data through May suggest that spending rose
substantially in the second quarter.
Receipts of state and local governments rose about 4 percent
in nominal terms over the year ending in the first quarter, about
matching the rise in nominal GDP. The sector's own-source general
receipts, which comprise income, corporate, and indirect business
taxes, rose about 1 percentage point faster, with solid gains in
all major components. Federal grants have changed little, on net, over
the past four quarters.
The External Sector
The nominal trade deficit in goods and services widened from its
low fourth-quarter level of $78 billion at an annual rate to
$97 billion in the first quarter of 1996, slightly less than the
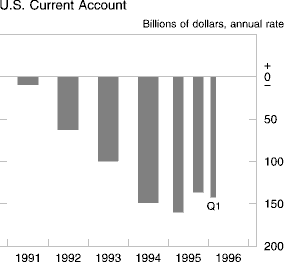
deficit of $105 billion for 1995 as a whole. The current account
deficit stood at $142 billion (annual rate) in the first quarter, about
the same as the figure for 1995 as a whole. In April, the trade deficit
increased from the average level for the first
quarter.
After expanding very slowly during the second half of
1995, the quantity of U.S. imports of goods and services rose about 10
percent at an annual rate in the first quarter, and preliminary data
for April show another sizable increase. The rebound in imports largely
reflected the strengthening of U.S. economic activity. In addition,
non-oil import prices have declined somewhat since last fall, after
having risen sharply in late 1994 and early 1995. A turnaround in
imported automotive vehicles, consumer goods, and non-oil industrial
supplies, following more than six months of declines, accounted for
most of the increase in imports during the first four months of 1996.
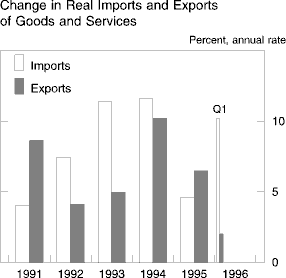
The quantity of U.S. exports of goods and services expanded at
a 2 percent annual rate during the first quarter; it also appears
to have expanded at about this pace in April. The somewhat subdued pace
of export growth so far this year reflects, in part, a bunching of
shipments, particularly of machinery, that resulted in an unusually
strong increase in exports in the fourth quarter of last year.
Trends in economic activity have varied across the major foreign
industrial countries so far in 1996. In Japan, economic recovery
appears to have taken hold, although the underlying pace of real GDP
growth is clearly less than the nearly 13 percent annual rate
reported for the first quarter; the first-quarter growth rate was
boosted in part by a temporary surge in government spending and
measurement practices associated with the leap
year.1
In Canada, growth remained subdued in the first quarter as real GDP
rose only 1-1/4 percent at an annual rate despite much
stronger growth in domestic demand; indicators for the second quarter
suggest some strengthening.
Economic performance so far this year in Europe has been mixed. In
Germany, real GDP declined another 1-1/2 percent at an
annual rate in the first quarter, largely because severe weather caused
a substantial contraction in construction spending; preliminary data
suggest that construction activity rebounded in the second quarter with
the return to more normal weather. In contrast, French real
GDP expanded nearly 5 percent at an annual rate in the
first quarter, supported by a very sizable rebound in consumption as
well as leap-year effects; strikes during the fourth quarter of last
year depressed economic activity and contributed to a decline in
private consumption spending. Indicators for the second quarter suggest
that output growth moderated from its first-quarter pace. In the United
Kingdom, real GDP grew at an annual rate of 1-1/2 percent
during the first quarter, somewhat more slowly than during the second
half of 1995. On the policy front, most European countries are seeking
to rein in their fiscal deficits during 1996 and 1997, in part to
comply with the criterion in the Maastricht Treaty that countries
participating in the third stage of the European Monetary Union, now
scheduled to begin on January 1, 1999, not have excessive fiscal
deficits. As a reference value, the treaty specifies that deficits
greater than 3 percent of a country's GDP are excessive, but it
also provides scope for accepting deficits above that level in some
circumstances.
In Mexico, robust growth of real GDP in the first quarter
extended the recovery in economic activity that began in the second
half of 1995. Through June, the Mexican trade balance remained roughly
stable at the level reached toward the end of last year, after having
improved markedly over the course of 1995. Argentina also appears to be
emerging from the steep declines in output experienced during the first
half of 1995, while Chile continues to enjoy steady growth. Activity in
Brazil has begun to expand again in recent months, following a sharp
contraction in mid-1995.
Economic growth in our major Asian trading partners (other
than Japan) appears to have picked up again this year after slowing
noticeably during the second half of 1995 from the extremely rapid
rates recorded in 1994 and the first half of 1995. The recent pickup in
activity was associated with an easing of monetary policy in some of
these countries in the second half of last year and the early part of
this year. In China, output appears to have expanded during the first
quarter at around the 10 percent annual rate recorded in 1995,
with a pickup in consumption spending compensating for weaker growth in
the external sector.
Consumer price inflation generally stayed low in the major
foreign industrial countries and declined or remained moderate
elsewhere. In Japan, prices in the second quarter, on average, were
slightly above their year-earlier levels because of the effects of yen
depreciation on import prices; this upturn followed a year of
deflation. In western Germany, inflation slowed through June to only
about 1-1/4 percent. Inflation in Italy remained higher
than in the other major foreign industrial countries but slowed to
below 4 percent through June. In Canada, inflation also moved
down further this year, to about 1-1/2 percent in May.
Inflation trends in Latin America have been mixed. In Mexico, the
twelve-month change in consumer prices diminished to about 32
percent in June, compared with a reading of 52 percent for the
twelve months ending in December 1995. Consumer price inflation has
also declined further in Brazil and remained low in Argentina. In
contrast, prices have picked up in Venezuela in response to the
depreciation of its currency associated with the adoption of a program
of macroeconomic stabilization. In Asia, inflation has decreased so far
in 1996 in China and remained moderate to low elsewhere.
Labor Market Developments
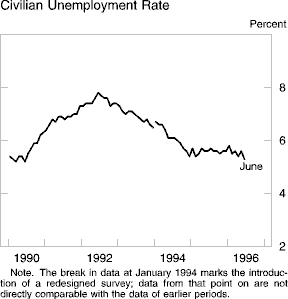
Labor demand was strong over the first half of 1996. Growth in
nonfarm payroll employment exhibited considerable month-to-month
variability but averaged a hefty 235,000 per month. In addition, the
civilian unemployment rate remained low, holding in the narrow range
around 5-1/2 percent that has prevailed since late
1994.
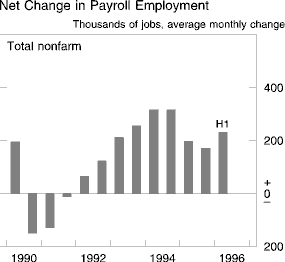
Employment gains were fairly broadly based over the first
half of the year. The services sector, which now accounts for nearly
30 percent of nonfarm employment, continued to be a mainstay of
job growth, showing increases of nearly 120,000 per month, on average,
over the first half. Within services, growth in employment in business
services remained rapid, with large gains at computer and data
processing firms as well as at temporary help agencies, and employment
in health services trended up further. In addition, construction
payrolls rose a brisk 30,000 per month, on average--an annual rate of
about 7 percent. Elsewhere, payrolls at wholesale and retail
trade establishments continued to increase at about the same pace as
that in 1995, and employment in the finance, insurance, and real estate
category picked up after having been nearly flat over 1994 and 1995.
Developments in manufacturing were uneven but showed some improvement in
the second quarter. As 1996 started, firms were still adjusting
employment to the slower path of output that had been evident since
early 1995, and payrolls--especially at firms producing nondurable
goods--were reduced further. In the past three months, manufacturing
employment has held fairly steady, buoyed by the pickup in industrial
activity, and the average factory workweek, which had contracted
appreciably in 1995, trended up through June.
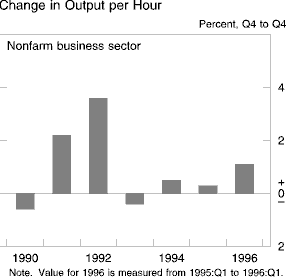
For the nonfarm business sector as a whole, productivity rose at
an annual rate of about 2 percent in the first quarter of 1996,
echoing the acceleration in output. However, productivity had
posted an outright decline in the fourth quarter of 1995; all told,
productivity rose about 1 percent over the year ending in the
first quarter of 1996, in line with the average pace this decade. In
the manufacturing sector, productivity rose 4-1/4 percent
over the past year, although the reported increase was
probably overstated because firms in this sector have been relying
increasingly on workers supplied by temporary help firms, who are
counted as service industry employees rather than as manufacturing
employees in the establishment survey of the Bureau of Labor
Statistics.
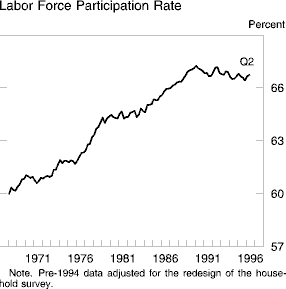
Labor force participation has remained sluggish this year. The
participation rate, which measures the percentage of the working-age
population that is either employed or looking for work, did retrace the
dip that occurred in late 1995. But, taking a longer perspective, the
overall participation rate (adjusted for the redesign of the
household survey in 1994) has changed little, on net, since 1989, after
rising fairly steadily from the mid-1960s to the late 1980s. The
flattening reflects mainly a marked deceleration in women's
participation, owing both to a leveling off in the percentage of women
who are in the labor force for at least part of a given year and slower
growth in the average number of weeks they spend in the labor force
that year. Moreover, with the average number of weeks these women spend
in the labor force having risen to a level only slightly below the
average for men, a significant rebound in participation does not seem
very likely over the near term. The sluggishness in participation tends
to restrain the growth of potential output unless it is offset by a
better productivity performance or by faster growth in the working-age
population--neither of which has yet been in evidence.
Despite the tightness in labor markets in recent quarters, the
broad trends in hourly compensation appear to have held fairly steady.
The employment cost index for private industry--a measure that includes
wages and benefits--rose at an annual rate of about 3 percent
over both the first three months of 1996 and over the twelve months
ending in March; the ECI had also increased about 3 percent over
the twelve months ending in March 1995. Compensation growth has
continued to be damped by a marked deceleration in employer-paid
benefits--especially payments for medical insurance, which have been
restrained by the slowing in medical care costs, the switch in
insurance arrangements from traditional indemnity plans to HMOs and
other managed care plans, and changes in the provisions of health plans
(including greater sharing of health care costs by employees). On the
whole, wages also seem to have been held in check, although the most
recent data may be hinting at some acceleration. Notably, the wage and
salary component of the ECI rose sharply in the first quarter; although
the data are volatile and the first-quarter figure likely overstates
current wage trends, the twelve-month change in the series moved up to
3-1/4 percent, nearly 1/2 percentage point
larger than the increases in the preceding two years. Separate data on
average hourly earnings of production or nonsupervisory workers also
show a recent acceleration in wages; the twelve-month change in this
series moved up to about 3-1/2 percent in June.
Price Developments
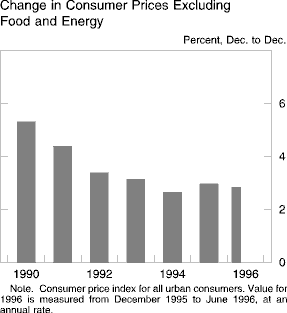
The underlying trend of prices has remained favorable this
year--notably, the CPI excluding food and energy rose at an annual rate
of 2-3/4 percent over the first six months of the year,
near the lower end of the narrow range than has been evident since
early 1994.
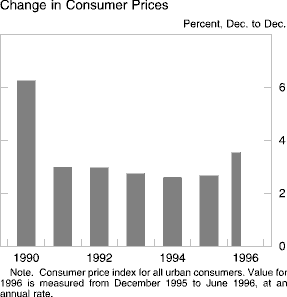
Developments in food and energy markets boosted overall inflation,
however, and the total CPI rose at an annual rate of 3-1/2
percent over the first half; this pattern was the reverse of that seen
in 1995, when a small drop in energy prices, combined with only a
modest increase in food prices, held the rise in the total CPI to
just 2-1/2 percent. Meanwhile, the producer price
index for finished goods rose about 2-3/4 percent
over the twelve months ending in June; excluding food and energy,
the PPI rose 1-1/2 percent, a bit less than over the
preceding year.
Consumer energy prices picked up around the turn of the
year and rose at an annual rate of about 12 percent, on net, over
the first six months of 1996. With crude oil stocks drained by strong
worldwide demand for heating oil and weather-related supply disruptions
in the North Sea and elsewhere, the spot price of West Texas
intermediate (WTI) soared from around $18 per barrel, on average, in
the second half of 1995 to a high of around $25 per barrel in
mid-April; the WTI price has since retraced much of that run-up.
Reflecting the surge in crude oil prices, retail prices of
refined petroleum products rose sharply through May, on balance.
However, they fell markedly in June, and private surveys of
gasoline prices imply a further decrease in early July.
Retail food prices rose at an annual rate of about 4
percent over the first six months of 1996, somewhat above the pace of
the preceding few years. At the farm level, prices of grains and other
commodities rose to exceptionally high levels as adverse crop
conditions in some parts of the country exacerbated an already tight
stock situation. For some foods--notably, dairy products, cereals and
bakery products, poultry, and pork--the pass-through tends to occur
relatively rapidly, and retail prices of such items have already risen
appreciably. Beef prices fell through May as producers sold off herds
in response to higher feed costs and poor range conditions; they turned
around in June and will likely rise further over the next several
quarters as the selloff of breeding stock will eventually lead to
tighter supplies.
Price increases for consumer goods other than food and
energy slowed to 1 percent at an annual rate over the first
half of 1996, after averaging about 1-1/2 percent per year
over the preceding three years. Increases in goods prices have been
restrained in part by the uptrend in the dollar since mid-1995, which
has helped to damp import prices. In addition, with the operating rate
in the manufacturing sector having fallen to about its long-term
average, pressure from the materials side has been limited. Indeed, the
PPI for intermediate materials (excluding food and energy) actually
fell a bit over the past twelve months, after having risen
7-1/2 percent over the preceding year. Looking ahead,
however, the latest report from the National Association of Purchasing
Managers suggests that vendor performance deteriorated markedly in
June, a development that could portend some firming of prices of
materials and supplies over the near term.
Prices of non-energy services rose 3-3/4 percent at an
annual rate over the first half, about the same as the rise over 1995
as a whole. Airfares accelerated significantly in the first half.
However, shelter costs increased less rapidly than they had in 1995,
and prices of medical care continued to decelerate; over the six months
ending in June, the CPI for medical care services rose at an annual
rate of only about 3-1/4 percent, roughly 1
percentage point below the 1995 pace. Moreover, there is some evidence
that the CPI may be understating the recent slowing in medical care
inflation, in part because it does not fully capture the discounts
negotiated between medical providers and insurers, including managed
care plans. The price measure used to deflate consumer expenditures on
medical care in the NIPA better reflects such factors; it rose less
than 2 percent over the year ending in the first quarter of 1996,
after having risen 4-1/2 percent over the preceding year.
Judging from the various surveys of consumers and forecasters,
expectations of near-term CPI inflation deteriorated slightly in the
first half of 1996. Notably, although both the University of Michigan
and the Conference Board had reported a noticeable drop in their
one-year-ahead measures in the second half of 1995, that improvement
was not sustained in 1996; the recent monthly readings have bounced
around, but the June results from both surveys were similar to those
recorded, on average, in the first half of 1995. In contrast,
longer-run inflation expectations, which have presumably been less
affected by the recent news in food and energy markets, have held
fairly steady. Smoothing through the monthly data, the University of
Michigan's measure of expected CPI inflation over the next five to ten
years has not changed much since late 1994, and the survey of
professional forecasters conducted by the Federal Reserve Bank of
Philadelphia during the second quarter of 1996 produced the same
expectation for the ensuing ten years as that in the survey taken in
the fourth quarter of 1995.
Financial Developments
Credit
Financial conditions in the first half of 1996 supported the
pickup in the growth of spending. For the most part, lenders continued
to pursue credit applicants aggressively as reflected, for example, in
narrow spreads of interest rates on corporate securities over
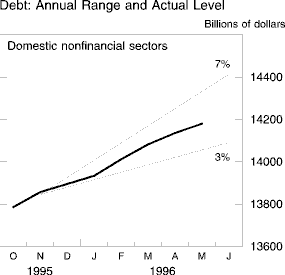
those on Treasury securities. The debt of domestic nonfinancial sectors
increased about 4-3/4 percent at an annual rate from the
fourth quarter of 1995 through May of this year, a bit more slowly than
last year but still sufficient to place the level of this aggregate in
the middle of its monitoring range for 1996.
The Government Sector. Federal
debt outstanding increased about 4 percent at an annual rate over
the first half of 1996, a shade below the average rate of increase last
year. The impasse over the debt ceiling disrupted the timing and size
of some Treasury auctions but did not alter the longer-term trajectory
of federal debt.
The pattern of net borrowing by state and local governments in the
past several years has been heavily influenced by their efforts to
retire debt issued at relatively high interest rates in the mid-1980s.
They have pursued these efforts through a strategy of advance
refunding: In the early 1990s, when bond yields were seen as especially
favorable, state and local governments issued new debt, even before
call provisions on the older bonds could be exercised, and placed the
proceeds in escrow accounts. As it became possible to do so, the
issuing governments began calling the older debt, using the contents of
the escrow accounts to complete the transactions. Reflecting these
retirements, the amount of state and local government debt outstanding
declined about 4 percent per year in 1994 and 1995. This process
is still in train but evidently on a smaller scale; available
information suggests that state and local government debt outstanding
declined only marginally during the first half of this year.
The Household
Sector. The pace of borrowing by households
appears to have moderated somewhat from the elevated rates of
1994 and 1995, but it remains substantial. In particular,
consumer credit expanded at a 9-1/2 percent annual rate
from the fourth quarter of 1995 through May of this year, down from
14-1/2 percent over the four quarters of 1995. Mortgage
debt actually expanded somewhat more rapidly during the first quarter
than in 1995 (7-3/4 percent at an annual rate versus
6-1/2 percent), and available indicators suggest that
growth during the second quarter dropped back only to about last year's
pace. The recent backup in mortgage rates, which only began in
February, has had little effect on borrowing thus far, and might even
have increased it temporarily by accelerating transactions.
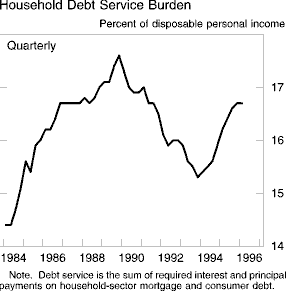
The rapid growth in household debt during the past few years has
resulted in a sizable increase in the estimated ratio of scheduled
payments of principal and interest to disposable personal income. This
measure of debt-servicing burden has trended up over the past two
years, and as of the first quarter of 1996, was approaching--but still
short of--the levels attained toward the end of the last business
cycle
expansion.
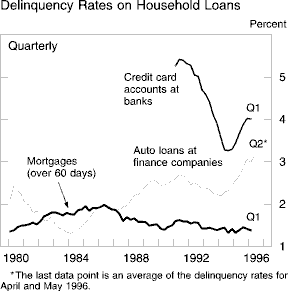
Several other recent indicators suggest that some
households are experiencing financial strains. For example, the
Consolidated Report of Condition and Income shows that the delinquency
rate on credit card receivables at commercial banks has increased
significantly in recent quarters, retracing about one-third of the
improvement that took place during the first few years of the current
economic expansion. The delinquency rate on auto loans at the finance companies affiliated
with the major manufacturers moved up sharply beginning about two years
ago and since late last year has hovered around historically high
levels. Anecdotal evidence suggests that the rise in both credit card
and auto-loan delinquency rates reflects a strategy to liberalize
lending standards as part of an overall marketing effort. The auto-loan
delinquency rate has also been boosted a bit by the increased
prevalence of leasing. Lease customers tend to be better credit risks
than the average conventional borrower, and the shift toward leasing
has had the effect of skimming the more financially secure car buyers
and thus degrading somewhat the remaining pool of people financing
their purchases through conventional loan contracts.
The personal bankruptcy rate also surged to a new high this year.
The extent to which this development reflects mounting financial
difficulties of households is clouded, however, by changes in federal
law (effective at the start of 1995) that may have increased the
attractiveness of bankruptcy by increasing the value of assets that can
be protected from liquidation in bankruptcy proceedings. The
"cost" of bankruptcy to households also has been effectively
lowered by the greater willingness of lenders to extend credit to
riskier borrowers--even those with a previous bankruptcy on their
records.
Other indicators are less suggestive of a deterioration in the
financial condition of households. For example, the delinquency rate
for mortgage loans sixty days or more past due at all lenders is near
its lowest level in two decades, while the rate on closed-end
consumer loans--despite having moved up over the past eighteen
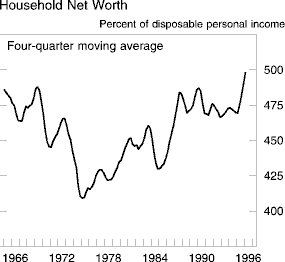
months--remains low by historical standards. Moreover, the aggregate
balance sheet of the household sector clearly is in very good shape;
owing in large part to the surge in equity prices over the past year
and a half, the ratio of household net worth to disposable personal
income moved up into record territory recently.
Apparently in response to the recent run-up in delinquency and charge-off
rates on consumer loans, banks have selectively tightened their
standards for consumer lending. These actions reversed steps taken
earlier in the decade, when many card issuers increased the growth of
their credit card receivables by offering accounts to customers who
previously would have been denied credit. The belief was that more
sophisticated credit-scoring techniques would control risks adequately,
but it appears that some "adverse selection" occurred and that
the uptick in delinquencies has been larger than at least some banks
had planned. About 20 percent of the respondents in the Federal
Reserve's most recent survey of senior loan officers reported having
tightened standards for approving applications for credit cards, and
10 percent reported tightening standards for other consumer
loans. Notwithstanding the recent tightening of standards, supply
conditions for loans from banks to consumers still appear
accommodative.
The Business
Sector. The debt of nonfinancial businesses also
appears to have expanded somewhat less rapidly during the first half of
1996 than it did last year. In part, the moderation in borrowing can
be traced to the behavior of the financing gap for
incorporated nonfinancial enterprises--the excess of their capital
expenditures (including inventory investment) over their internally
generated funds. During 1995, this gap narrowed quite substantially,
reflecting strong profits and a marked reduction in inventory
investment. Available indications are that the gap has remained small
this year.
External funding for business spending has been in
plentiful supply thus far this year. One piece of evidence on this
point is that interest rate spreads on investment-grade bonds have
edged down slightly since the beginning of the year. Additionally,
spreads on high-yield bonds have declined markedly and are as
low as they have been in at least a decade. Also, supply conditions for
loans from banks to businesses continue to look quite favorable.
According to the Federal Reserve's most recent survey of bank
lending officers, standards for approval of commercial and industrial
loans were about unchanged from January to May of this year, and terms
on such loans were eased on net. Surveys by the National Federation of
Independent Business indicate that small businesses have not faced
difficulty getting credit, and stories abound of new small-business
lending programs of banks.
Gross offerings of long-term bonds by nonfinancial
corporations have been running about in line with last year's pace.
However, the mix of issuers has shifted somewhat, reflecting the
changing structure of rates. Late last year and early this year,
investment-grade corporations were issuing a hefty volume of bonds in
order to pay down commercial paper and to refinance existing long-term
debt. As the rates on investment-grade bonds increased this year,
issuance of such debt dropped off. Rates on high-yield bonds moved up
less, however, and issuers of those bonds continued to offer new debt
at a rapid pace.
Gross issuance of equity shares by nonfinancial
corporations has been exceedingly strong this year. Indeed, total
offerings in each of the three months of the second quarter set
successive monthly records. This activity has been fueled by initial
public offerings and other equity issuance by relatively young
companies. Share retirements by nonfinancial corporations have also
been very heavy. Announced stock buybacks by such firms in both the
first and second quarters ran at $28 billion per quarter--the
fastest pace since the late 1980s. On net, available information
suggests that nonfinancial corporations retired even more equity during
the first half of 1996 than they had in 1995.
Share retirements and merger activity have generated much less
issuance of debt recently than they did in the 1980s. Recent share
repurchases have been undertaken mostly by companies seeking to return
the excess cash on their balance sheets to stockholders. And recent
mergers and acquisitions have mainly been accomplished through stock
swaps between companies in similar lines of business, rather than the
leveraged transactions commonplace in the 1980s. In line with the
limited extent of debt financing, the mergers executed thus far in 1996
have resulted in little net change in bond ratings--again in marked
contrast to the experience of the 1980s.
Depository
Intermediation. The growth of credit provided by
depository institutions slowed sharply in the fourth quarter of last
year and first quarter of this year, and commercial bank credit--a
component of total depository credit for which more recent data are
available--slowed further in the second quarter. The share of thrift
institutions in total depository credit has continued to decline in
recent quarters. This long-standing trend may have been given
additional impetus last summer by the opening up of a differential
between the premium rates paid by banks and thrift institutions for their deposit
insurance; this differential has reduced the cost of funds for
banks relative to the cost of funds for thrift institutions.
The reduction and subsequent elimination of the deposit insurance
premium for financially sound banks probably played a role in shifting
bank funding toward deposits. During the first half of 1996, banks
increased their deposit liabilities more rapidly than their nondeposit
liabilities--a contrast from the preceding few years when banks
relied disproportionately for their funding on nondeposit sources,
including borrowing from their foreign offices.
The Monetary Aggregates
The increased reliance on deposit sources of funding by banks has
helped support the growth of the broad money aggregates of late.
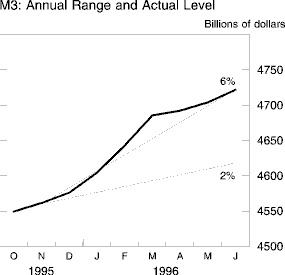
Between the fourth quarter of last year and June of this year, M3
expanded at an annual rate of about 6 percent, putting it at the
upper boundary of its annual growth cone. As in 1995, the growth in M3
this year was led by those components not included in M2. In
aggregate, these components increased about 11 percent at an
annual rate between the fourth quarter of last year and June of this
year, only moderately below the 1995 average pace of 14-1/2
percent. Institution-only money-market mutual funds increased about
18 percent at an annual rate over this period. This component of
the money stock increased especially rapidly during the first three
months of the year. Often, the yields on these funds lag changes in
short-term market interest rates, making them particularly attractive
investments when short-term market rates are declining, as they were
around the turn of the year when the Federal Reserve eased policy.
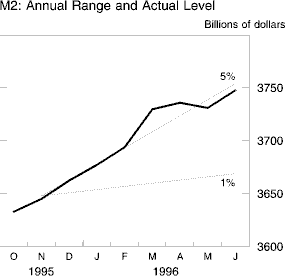
M2 increased 4-3/4 percent at an annual rate between the
fourth quarter of 1995 and June of this year, leaving it near the upper
boundary of its growth range. For many years before the early 1990s,
the velocity of M2 (defined as the ratio of nominal GDP to M2) moved
roughly in tandem with the opportunity cost of holding
M2--that is, the interest earnings forgone by holding M2 assets rather
than market instruments such as Treasury bills. This relationship
implied that M2 tended to move in proportion to nominal GDP, except as
it was influenced by changes in the opportunity cost of holding it.
When the opportunity cost rose, owners of M2 tended to economize on
their holdings, driving up the velocity of M2.
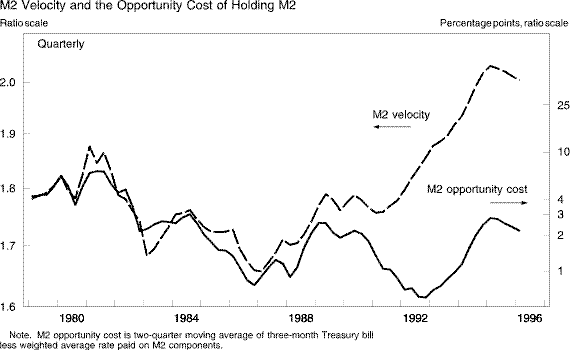
Beginning around the early 1990s, however, this historical relationship
began to break down. Indeed, in 1991 and 1992, the velocity of M2 rose
sharply even as the opportunity cost of holding M2 declined. A number
of reasons for this development have been adduced, including the
unusually steeply sloped yield curve and very low level of short-term
interest rates, which helped to attract the public out of liquid
balances and into more readily available long-term mutual funds; the
credit crunch at banks and the resolution of troubled thrifts, which
reduced the aggressiveness with which these institutions sought
retail deposits; and household balance-sheet restructuring, which
entailed in part repayment of loans out of liquid money balances. The
divergent movement of the velocity of M2 and its opportunity cost
continued until the end of 1992. More recently, the variables have once
again been moving essentially in parallel. In light of the rapid
ongoing pace of innovation and technological change in financial
services, however, it is impossible to know whether the new
parallel movement of velocity and the opportunity cost will persist.
M1 declined about 1-3/4 percent at an annual rate during the
first half of 1996, just as it had done over the four quarters of 1995.
The recent sluggish behavior of M1 reflects the ongoing spread of
so-called sweep programs, under which idle reservable deposits are
"swept" into money-market-deposit accounts (MMDAs). (The appendix
provides additional information on sweep accounts.) Estimates based on
initial amounts swept suggest that M1 would have expanded at about a
7 percent annual rate during the first half of 1996 in the
absence of these programs. Another factor contributing to the recent
weakness in M1 has been the growth of currency, which has been sluggish
by the standards of the early 1990s. Foreign demand for currency
apparently has tailed off somewhat. In large part, the slackening in
net foreign demand owes to substantial reflows from Argentina and
Mexico, where earlier worst-case fears about the stability of the
financial system have not been realized. Reflows from Western Europe
and Asia have also been significant, but net shipments to the former
Soviet Union remain sizable. On the whole, demand for the new
$100 bill has been substantial, but this has not had any
detectable effect on the stock of currency outstanding.
The sluggish growth of currency has held down expansion of the
monetary base to only about 2 percent at an annual rate thus far
this year. The other restraint on the growth of the base has been the
turnaround in the behavior of required reserves. After surging at
double-digit rates in 1992 and 1993, required reserves have been on a
downward trend, and at an increasing rate. Thus far this year, required
reserves have contracted about 7-1/2 percent at an annual
rate. The emergence of this trend is perhaps the most direct
consequence of the spread of sweep programs. Absent such programs,
required reserves probably would have increased about 10 percent
over the same period, owing to strong growth in demand deposits.
Continued spread of sweep programs could affect the federal funds
market, perhaps leading to greater volatility like that experienced in
early 1991 following the elimination of reserve requirements on
nontransactions deposits. Thus far, such instabilities have not been
realized, but the Federal Reserve is monitoring the situation
carefully.
Interest Rates, Equity Prices,
and Exchange
Rates
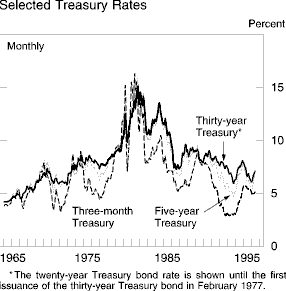
Interest Rates. Interest
rates on Treasury securities rose over the first half of 1996, with the
most pronounced increases occurring for intermediate-term securities.
Between the end of December 1995 and the middle of July, the rate on
three-month bills increased somewhat less than 1/4
percentage point, the rate on 5-year notes rose about 1-1/4
percentage points, and the rate on 30-year bonds rose about 1
percentage point. Despite these increases, nominal Treasury
rates overall continued to be relatively low by the standards of the
past twenty years.
The spread between interest rates on investment-grade private
bonds and those on comparable-maturity Treasury securities remained
narrow during the first half of the year. In particular, the average
spread on Baa-rated industrial bonds over 30-year Treasury bonds
continued to fluctuate near where it has been for the last several
years and well below the levels typical of the 1980s. The spread on
investment-grade utility bonds continued to drift upward, but this
appeared to reflect the market's increasing perception that some firms
in that industry might become riskier as a result of deregulation and
new competitive pressures. The rate spread on high-yield
bonds over the comparable Treasury notes narrowed sharply,
reversing the upward drift of 1995, and returning this measure to the
low end of its range over the last decade. The continuing low level of
spreads on most investment-grade securities, as well as the marked
decline of the spread on high-yield securities, appeared to reflect in
part market participants' increasing confidence in the durability of
the economic expansion and consequent optimism about the
creditworthiness of corporate
borrowers.
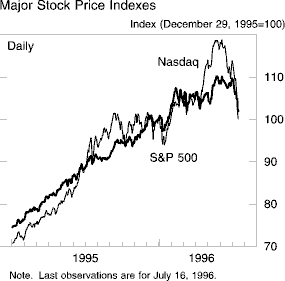
Equity
Prices. Share prices have fallen in recent weeks,
most notably those of "high-tech" companies whose ability to
maintain steep earnings trajectories has come into question. On
net, though, broad indexes of equity prices have held steady or moved
up slightly since the end of 1995. As of July 16, the S&P
500 composite index of stock prices had increased 2 percent thus
far this year, while the NASDAQ index had returned to its beginning-of-year
level. Even this performance has been impressive, given that it
occurred in the face of appreciable upward movement in long-term
interest rates.
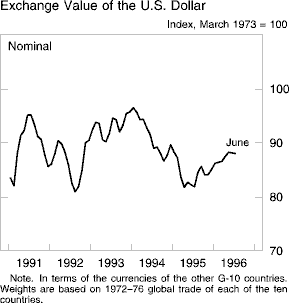
Exchange Rates. Since
mid-April, the weighted-average value of the dollar in terms of the
other G-10 currencies has generally been about 4 percent above
its level at the end of December, although the dollar has moved down
somewhat in mid-July. When compared with an index of currencies from a
somewhat broader group of U.S. trading partners, the dollar has
appreciated 3 percent since December after adjustment for changes
in relative consumer prices. The dollar has risen on balance about
4 percent in terms of the German mark and about 6
percent in terms of the Japanese
yen.
The dollar has been supported by perceptions of a
disparity in the performance of the U.S. economy relative to that of
many of our major trading partners and the resulting expectations for
the course of relative interest rates. Specifically, while data
suggesting robust growth in the United States caused interest rates to
rise, questions remained about the strength of expansions in a number
of other industrial countries, particularly in Europe. Average
long-term (ten-year) interest rates in the other G-10 countries have
risen only slightly, about 20 basis points, since the end of December.
With U.S. rates rising substantially more than that, the appreciation
of the dollar over this period is consistent with the shift in the
long-term interest differential in favor of the dollar. In addition,
the dollar was lifted to an extent against the yen by data early in the
year showing that the Japanese external surpluses were narrowing.
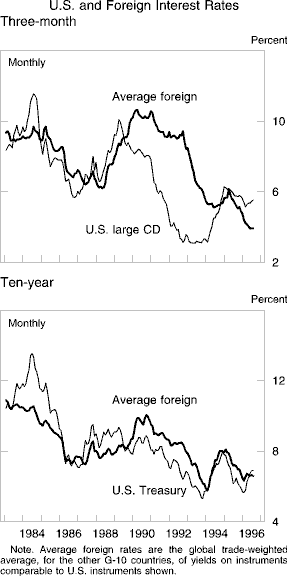
Despite a weak output performance, long-term interest rates in Germany
have risen about 50 basis points, with much of that increase coming
during the first quarter. Long-term interest rates have actually
fallen since the end of last year in some European countries, such as
France and Italy, where political and economic policy uncertainties
have been reduced. In Japan, long-term interest rates have risen
about 30 basis points, on balance. Short-term market interest
rates abroad are generally lower than they were atthe end of
last year. German short-term market rates are down nearly 50 basis
points, while rates in France are down more than 100 basis points and
those in the United Kingdom are down 70 basis points. Official
lending rates have been reduced by the central banks in Germany,
France, the United Kingdom, and several other European countries in
1996. In Japan, short-term market interest rates remain near the
historically low levels reached during the second half of 1995 as the
Bank of Japan's official rates have been unchanged. Stock markets
in the foreign G-10 countries have risen 3 percent to 15 percent
since the end of December, except in the United Kingdom, where stock
prices, on balance, are about unchanged.
The Mexican peso traded during the first half of 1996 in a
range somewhat stronger than that which prevailed at the end of 1995.
Mexican 28-day treasury bill (cetes) rates have declined from nearly
50 percent in December to around 30 percent as the rate of
inflation has fallen. The economic positions of Mexican households and
firms have improved since early 1995, but problems in the financial
system remain, as evidenced by increasing nonperforming loans at
banks. Stock prices have risen, on balance, about 5 percent in
peso terms since December, buoyed by the interest rate declines and
evidence of recovery in the Mexican economy.
The pace at which private foreigners acquired U.S. assets
increased markedly in the first quarter. Although private net
purchases of U.S. Treasury securities were small, there were large
increases in the private holdings of U.S. government agency bonds and
U.S. corporate bonds, as U.S. corporations issued heavily in the
Eurobond market. In addition, direct investment capital inflows surged
to almost $30 billion in the first quarter, reflecting a pickup
in foreign acquisitions of U.S. firms. Together, these gross inflows
totaled nearly $80 billion, roughly twice the U.S. current
account deficit for the quarter. U.S. net purchases of foreign stocks
and bonds were also sizable in the first quarter, with net purchases of
foreign stocks from Japan particularly large. U.S. direct investment
abroad slowed somewhat between the fourth quarter of 1995 and the first
quarter of 1996 but remained near the record pace for all of last
year. In April and May, private foreign interest in U.S. securities
continued to be strong while U.S. investor interest in foreign stocks
cooled somewhat from the strong first-quarter pace.
Foreign official holdings in the United States increased about
$52 billion in the first quarter of 1996 after a record
$110 billion rise in 1995. These increases reflected both
intervention to support the foreign exchange value of the dollar by
certain industrial countries and substantial reserve accumulation by
several developing countries. Data for April and May indicated
continued increases in official holdings in the United States, but on a
much more modest scale.
Appendix: Sweeps of Retail Transaction
Deposits
In January 1994, depository institutions began implementing sweep
programs for retail customers.2
In such programs, balances in household transaction accounts (typically
NOW accounts, but also some demand deposits, both of which are included
in M1) are swept into savings deposits, which are part of the non-M1
portion of M2. Such sweeps shift deposits from reservable
(transactions) accounts to nonreservable (savings) accounts without
impairing depositors' ability to access the funds for transactions
purposes. Depositories have an incentive to establish these programs
because reserves held at the Federal Reserve earn no interest. Retail
sweep programs reduce reported reserves, the monetary base, and M1.
They have no effect on M2 because both transactions and savings accounts
are in M2.
Retail sweep programs have been established either as
daily sweeps or as weekend sweeps. Under a daily sweep, a depositor's
transaction balances above a target level are shifted each night into a
special savings account created for the purpose. If debits threaten to
reduce the remaining transaction account balances below zero, enough
funds are transferred back from the savings account to reestablish the
target level of transaction balances. Because only six transfers are
allowed out of a savings account within a statement month, on the sixth
transfer, the entire savings balance is returned to the transaction
account. Alternatively, in a weekend sweep program, all affected
transaction account balances are swept into the special purpose
savings account over the weekend and then returned on Monday. Some
"weekend sweep" programs undertake sweeps on certain holidays as
well.
No information is available on the current amounts of
transaction balances that are being swept into savings accounts. The
Federal Reserve has obtained data from depositories only on the initial
amounts swept on the date each program was established. The table
below, which is updated and made available to the public on an ongoing
basis, shows that the initial amounts swept under programs implemented
through May 1996 have cumulated to $98 billion. With a
marginal reserve requirement of 10 percent on most of these
balances, the cumulative reduction of required reserves attributable to
the initial amounts swept has been nearly $10
billion.
Sweeps of Transaction
Deposits
into Savings Accounts
Billions of dollars
|
|
Monthly averages
of initial
amounts
|
Cumulative
total
|
1994
| | |
January
| 5.3 | 5.3
|
February
| 2.2 | 7.5
|
March
| 0.0 | 7.5 |
April
| 0.0 | 7.5 |
May
| 0.0 | 7.5 |
June
| 0.0 | 7.5 |
July
| 0.0 | 7.5 |
August
| 0.0 | 7.5 |
September
| 1.5 | 9.0 |
October
| 0.6 | 9.6 |
November
| 0.3 | 9.9 |
December
| 0.0 | 9.9 |
| | | |
1995
| | |
January
| 0.0 | 9.9 |
February
| 0.0 | 9.9 |
March
| 0.0 | 9.9 |
April
| 0.0 | 9.9 |
May
| 5.0 | 14.9 |
June
| 7.3 | 22.2 |
July
| 0.6 | 22.8 |
August
| 4.6 | 27.4 |
September
| 5.9 | 33.3 |
October
| 7.7 | 41.0 |
November
| 4.3 | 45.3 |
December
| 9.2 | 54.5 |
| | | |
1996
| | |
January
| 13.7 | 68.2 |
February
| 7.0 | 75.2 |
March
| 6.4 | 81.6 |
April
| 7.8 | 89.4 |
May
| 8.4 | 97.8 | |
Note. Figures are the
estimated total of transaction account
balances inititally swept into
savings accounts owing to the introduction
of new sweep programs.
Monthly totals are averages of daily data.
Regular monthly updates
of initital amounts swept may be
obtained by email by sending an email
address along with a
phone number to
[email protected]. Those without access
to email
may request data by calling (202) 872-7577.
Growth of Money and
Debt
Percent
Period
|
M1
|
M2
|
M3
|
Domestic
nonfinancial
debt
|
| Annual 1
| | | | |
| 1980 | 7.5 | 8.7 | 9.6 | 9.5
|
| 1981 | 5.4 (2.5)2 | 9.0 | 12.4 | 10.2
|
| 1982 | 8.8 | 8.8 | 9.7 | 9.8
|
| 1983 | 10.3 | 11.8 | 9.5 | 11.9
|
| 1984 | 5.4 | 8.1 | 10.8 | 14.6
|
|
| | | | |
| 1985 | 12.0 | 8.6 | 7.7 | 14.4
|
| 1986 | 15.5 | 9.2 | 9.0 | 13.3
|
| 1987 | 6.3 | 4.2 | 5.9 | 10.0
|
| 1988 | 4.3 | 5.7 | 6.3 | 8.8
|
| 1989 | 0.6 | 5.2 | 4.0 | 7.9
|
|
| | | | |
| 1990 | 4.1 | 4.1 | 1.8 | 6.8
|
| 1991 | 7.9 | 3.1 | 1.2 | 4.6
|
| 1992 | 14.3 | 1.8 | 0.6 | 4.7
|
| 1993 | 10.5 | 1.4 | 1.0 | 5.2
|
| 1994 | 2.4 | 0.6 | 1.6 | 5.2
|
| | | | | |
| 1995 | -1.8 | 4.0 | 5.9 | 5.6
|
| | | | | |
Quarterly
(annual
rate) 3
| | | | |
| 1995 Q1 | -0.1 | 1.0 | 4.5 | 5.4
|
| Q2 | -0.5 | 3.8 | 6.3 | 7.1
|
| Q3 | -1.5 | 6.9 | 7.9 | 4.9
|
| Q4 | -5.1 | 4.1 | 4.5 | 4.7
|
|
| | | | |
| 1996 Q1 | -2.7 | 5.9 | 7.2 | 4.7
|
| Q2 | -0.5 | 4.1 | 5.3 | n.a. | |
1. From average for fourth
quarter of preceding year to average
for fourth quarter of year
indicated.
2. Adjusted for shifts to NOW accounts in
1981.
3. From average for
preceding quarter to average for quarter
indicated.
ENDNOTES
1. Although the statistical agencies in many countries take the
number of working days in the quarter into account when seasonally
adjusting data, the statistical agencies in Japan, France, and Italy
among the G-10 countries do not make working-day
adjustments.Return to text
2. Sweep accounts for business customers of banks became
widespread in the mid-1970s. They involve sweeps of demand deposits
into RPs or other money market instruments whose minimum sizes are too
large to accommodate households.Return to text
Section 1
Home |
News and events |
Monetary policy |
July 1996 report
Accessibility | Contact Us
Last update: July 18, 1996 10:00 AM
|

