Economic Developments
The Household Sector
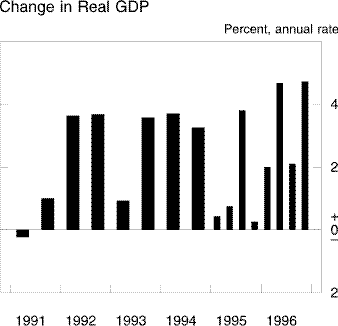
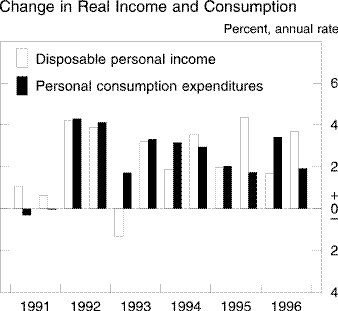
After rising less than 2 percent in 1995, real personal
consumption expenditures moved up 2-3/4 percent in
1996. Although debt problems arose with greater frequency this past
year, households benefited from healthy increases in real income and
another year of sizable gains in wealth. Consumers were relatively
optimistic about prospects for the economy at the start of 1996, and
they became more so as the year
progressed.
Real outlays for consumer durables rose more than 5
percent in 1996 after a gain of only 1-1/4 percent
during 1995. As has been true for many years, real expenditures on
computers and electronic equipment outpaced the growth of other
household outlays by a wide margin in 1996. Sizable increases were also
reported for most other types of consumer durables. However, real
expenditures on vehicles changed little on net over the year, as gains
achieved during the first half were reversed after mid-year. Late in
1996, sales of light vehicles may have been constrained to some
degree by supply shortages that arose during strikes in the United
States and Canada; early in 1997, vehicle sales strengthened.
Consumer purchases of nondurables rose 1-3/4 percent in
1996 after increasing 1 percent during 1995. Spending for
services rose 2-1/2 percent last year, about the same as
the average gain in previous years of the expansion.
After-tax personal income increased 5 percent in nominal
terms over the four quarters of last year. Wages and salaries rose
briskly, and the income of farm proprietors surged. Other types of
income generally exhibited moderate gains. Given the low level
of price inflation, the rise in nominal income translated into
another significant advance in real disposable income--about
2-3/4 percent over the year.
As in 1995, strong cross-currents continued to shape
individual households' willingness--and ability--to spend from current
income. Huge increases in stock market wealth provided some households
the wherewithal to boost spending at a pace considerably faster than
the growth of disposable income. But a number of households were likely
held back by the need to divert income to the servicing of debt, and
according to some survey evidence, households have become more
concerned about saving for retirement. Responding to these influences,
the annual average of the personal saving rate was up slightly from
that of 1995; however, it remained relatively low compared with its
longer-run average.
Residential investment expenditures posted a gain of
4 percent in real terms over the four quarters of 1996, more than
reversing a small decline in the previous year. Demand for
single-family housing was especially strong. Although interest rates on
longer-term fixed-rate mortgage loans moved up considerably in 1996, a
substantial number of homebuyers side-stepped at least the initial
costs by using adjustable-rate loans that were available at lower
rates. The effects of the rate increases on the single-family market
were cushioned by other influences as well, most notably the growth of
employment and income. Even for fixed-rate loans, mortgage financing
costs held at a level that, by historical standards, was low relative
to household incomes. All told, sales of new homes surged to the
highest annual total of the current expansion, and sales of
existing homes established a historical high. New construction of
single-family dwellings also rose but not so dramatically as sales, as
builders apparently chose to work off some of their inventories of
unsold units, which had climbed in 1995. Mild sluggishness in starts
toward the end of 1996--which was probably exacerbated by poor weather
in December--was followed by more upbeat indicators of new construction
in January of this
year.
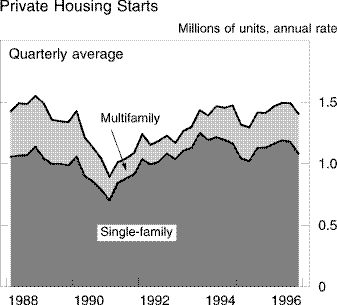
Construction of multifamily units maintained a path of
recovery from the extreme lows of the early 1990s, moving up about
13 percent in terms of annual totals. The number of multifamily
units started-- about 315,000--was double the number started in
1993, when construction of these units was at a low. However, compared
with previous peaks, the 1996 total was less impressive--starts were
twice as high in some years of the 1970s and 1980s. Although
market conditions for multifamily properties varied
considerably from city to city in 1996, the national average vacancy
rate for multifamily rental units remained relatively high, and
demographic influences were probably less supportive of multifamily
housing than they were a decade or so ago. Also, manufactured houses
have provided an increased number of families with an alternative to
rental apartments in recent
years.
The Business Sector
Business fixed investment recorded a fifth consecutive year of
strong expansion in 1996, rising about 9 percent according to the
initial estimate. As in other recent years, investment was driven by
rising profits, favorable trends in the cost of capital, and the
ongoing efforts of businesses to boost efficiency.
Although much of the investment spending was to replace
depreciated equipment, the net addition to the aggregate
capital stock appears to have been substantial. The rate of rise in the
stock has picked up over the past two or three years after subpar
growth through the latter half of the 1980s and first few years of
the 1990s; the resulting rise in the level of capital per worker should
enhance labor productivity and potential output.
Equipment outlays moved up almost 9-1/2
percent in real terms in 1996. Business purchases of office and
computing equipment once again rose much faster than the outlays for
other types of equipment. Computer purchases were propelled by many of
the same forces that have been at work in other recent years--most
particularly, the expansion of networks and the availability of new
models of computers embodying substantially improved computing
power at highly attractive prices. Outlays for communications
equipment also rose quite rapidly in 1996. Gains for other types of
equipment were generally more modest.
Investment in nonresidential structures also rose
substantially over the four quarters of 1996, posting the largest
advance in several years. Business spending on structures went through
an extended contraction in the latter part of the 1980s and early
1990s, and until recently, the subsequent recovery has been relatively
slow. That the 1996 gain in nonresidential investment would be so large
was not evident until late in the year, when incoming data began to
trace out sizable increases in new construction for many types of
buildings. Investment in office buildings scored an especially large
gain over the year, amid widespread reports of firming market
conditions and reduced vacancy rates, and real outlays for other
commercial structures moved up for a fifth consecutive year. Financing
appears to be in ample supply for commercial construction, and
according to reports from the District Reserve Banks, speculative
office building projects--that is, those without pre-committed
tenants--are becoming more common.
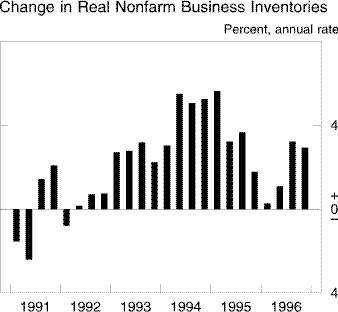
Inventory investment was relatively subdued in 1996. The
stock of nonfarm business inventories rose less than 2 percent
over the four quarters of the year, the smallest increase since 1992.
Businesses had been moving toward a reduced rate of stockpiling over
much of 1995, and the rate of accumulation came almost to a halt in
early 1996, when stocks of motor vehicles plummeted in conjunction with
a strike at two plants that manufacture auto parts. Thereafter,
inventory developments were relatively uneventful. Stocks of vehicles
changed little on net over the final three quarters of the year, and
accumulation of inventories by other nonfarm businesses was
moderate on average. Stocks at year-end generally appeared to be at
comfortable levels relative to recent trends in
sales.
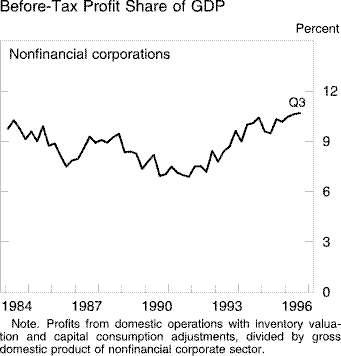
Business profits turned in another strong performance in 1996.
Economic profits of all U.S. corporations rose at an annual rate of
more than 10 percent from the final quarter of 1995 to the third
quarter of 1996. Profits earned by foreign subsidiaries of U.S.
corporations fluctuated from quarter to quarter but remained at
high levels, and returns from domestic operations rose
substantially, for both financial and nonfinancial firms. Domestic
profits of nonfinancial corporations amounted to
10.7 percent of the nominal value of these firms' output in the
third quarter, the highest reading of the current expansion.
The Government Sector
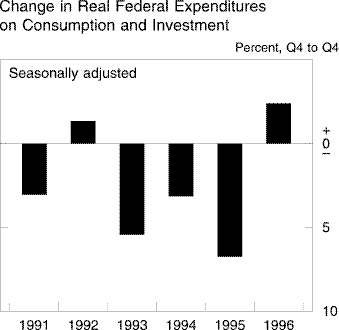
Real federal expenditures on consumption and gross
investment--the part of federal spending that is included in GDP--rose
about 2-1/2 percent, on net, from the fourth quarter of
1995 to the fourth quarter of 1996, but the rise was mostly an artifact
of late-1995 real purchases having been pushed to especially low levels
by government shutdowns. The underlying trend of federal consumption
and investment expenditures probably is better represented by the
2-1/2 percent annual rate of decline from the fourth
quarter of 1994 to the final quarter of 1996. Reductions have been
apparent over the past two years both in real defense purchases and in
real nondefense
purchases.
Federal expenditures in the unified budget increased
about 3 percent in nominal terms in fiscal 1996 after having
increased 3-3/4 percent in fiscal 1995. Slower growth was
recorded across many budgetary categories this past year, and outright
declines were reported in some. Combined expenditures on health,
social insurance, and income security--items that account for more than
half of all federal outlays--moved up 4-1/2 percent, the
smallest increase this decade. Defense spending was down about
2-1/4 percent in nominal terms, and net interest outlays
rose much less rapidly than in fiscal 1995. Measured relative to the
size of nominal GDP, total outlays in the most recent fiscal year were
the smallest since 1979. Legislative restraint has led to cuts in a
number of discretionary programs in recent years, and the expanding
economy has relieved pressure on those outlays that tend to vary
inversely with the strength of activity.
Federal receipts increased about 7-1/2 percent in
fiscal 1996, the third year in which growth of receipts outpaced growth
of nominal GDP by a significant margin. Receipts from individual income
taxes climbed more than 11 percent in the most recent fiscal
year, in conjunction with healthy increases in households' taxable
earnings from capital and labor. Taxes on corporate profits also
continued to rise rapidly, more or less in step with the growth of
business earnings. The rapid growth of receipts, coupled with the
restrained growth of expenditures, brought the unified budget deficit
down to $107 billion in fiscal 1996 from almost $165
billion in fiscal 1995. The deficit as a share of nominal GDP was
1.4 percent, the smallest in more than twenty
years.
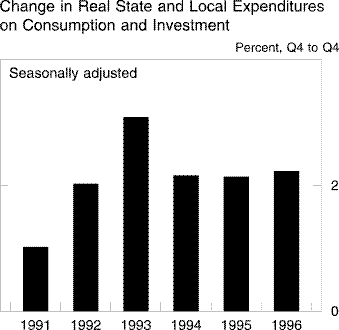
The aggregate consumption and investment expenditures of state
and local governments rose 2-1/4 percent in real terms over
1996. This gain was about the same as those of the two previous years.
Outlays for services, which consist mainly of employee compensation and
account for more than two-thirds of all state and local purchases, rose
roughly 1-1/4 percent in real terms last year. Investment
expenditures, which make up the next biggest portion of state and local
purchases, rose about 4-1/2 percent in real terms. In the
aggregate, the budget picture for state and local governments was
relatively stable in 1996, as the surplus of nominal receipts
overnominal current expenditures changed little from the
positive readings of other recent years.
The External Sector
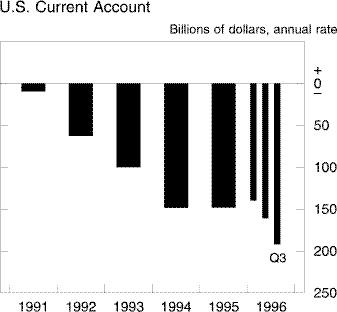
The nominal trade deficit for goods and services widened to
$115 billion in 1996 from $105 billion the previous year.
For the first three quarters of the year, the current account deficit
totaled $165 billion at an annual rate, somewhat greater than the
$150 billion deficit recorded in
1995.
The quantity of imports of goods and services rose
strongly over the four quarters of 1996--about 8-1/2
percent according to the preliminary estimate--after expanding
only 4-1/4 percent the previous year. The pickup in U.S.
real output growth boosted the demand for imported goods, as did
the declines in the prices of non-oil imports. Sizable increases in
import volume were widespread among most major merchandise trade
categories, with the notable exceptions of oil and semiconductors.
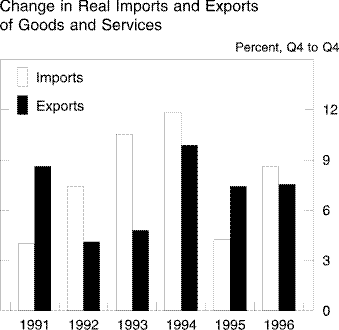
Very strong export growth in the fourth quarter of 1996 raised
the yearly gain in the quantity of exports of goods and services to
7-1/2 percent. Growth in the economies of our major trading
partners was only moderate on average but was somewhat faster than
in 1995. As a consequence, growth of exports was similar to the
1995 rate despite the appreciation of the dollar. Over the past year,
most of the rise in the value of merchandise exports went to Canada and
Latin America. Exports to Western Europe and Asia were only marginally
higher than they were a year earlier.
In most of the major industrial countries abroad, real economic
activity accelerated last year from a relatively weak performance in
1995. In the United Kingdom, real output growth firmed through the
year, as growth in consumption spending rebounded from its low 1995
rate. In Germany and France, real GDP growth strengthened but was still
too low to prevent a further rise in the unemployment rate in
both countries. In Italy, output growth slowed as the rebound in the
lira from its previous depreciation sharply reduced the growth of
exports and depressed investment spending. For most continental
European countries, further fiscal restraint is planned this year as
governments hoping to participate in the third stage of European
Monetary Union strive to meet the Maastricht Treaty's 1997 reference
standard of a budget deficit no larger than 3 percent of GDP. In
Japan, fiscal stimulus spurred economic expansion early last year;
subsequently, slower private consumption, reduced inventory
accumulation, and decreased government investment spending reduced
output growth. In contrast, Canada's real output growth rose over 1996
as inventory adjustment was completed during the first half of the year
and as exports strengthened.
Except in the United Kingdom, inflation pressures in the foreign
industrial countries continued to decline or remained subdued during
1996. Consumer prices in Japan were flat. Consumer price inflation fell
sharply in Italy and remained below 2 percent in Germany and
France. In the United Kingdom, consumer prices excluding mortgage
interest payments accelerated to an annual rate of more than 3
percent.
The Mexican economy continued on a course of recovery that
returned GDP to its pre-crisis level in the fourth quarter of
1996. Increases in income and a strengthening of the price-adjusted
value of the peso contributed to a reduction in the Mexican
merchandise trade surplus over 1996. Argentina and Brazil also
continued to recover from recessions. In Chile, real GDP growth
moderated from the very high rate recorded in 1995 to about 6
percent in 1996. In Venezuela, windfall oil revenues softened the
decline in real GDP in 1996 and improved the prospects for 1997.
In our major trading partners in Asia other than Japan, real
output growth generally slowed from its 1995 pace, despite a pickup in
many countries toward year-end in response to more accommodative
monetary policies and a partial recovery in export markets. In China,
the slowdown of growth to about 10 percent last year from the 12 to
14 percent annual rates experienced during 1992-94 reflected a
substantial deceleration in investment spending, owing to China's
efforts to reduce inflation by tightening central bank credit to
state-owned enterprises and by restricting investment.
Consumer price inflation in Mexico was around 28 percent in
1996, significantly lower than the 1995 inflation rate of over 50
percent. Venezuela's inflation rate in 1996 exceeded 100 percent,
but inflation in most other Latin American countries was at levels well
under 10 percent. Inflation rates generally remained low in
Asia.
The Labor Market
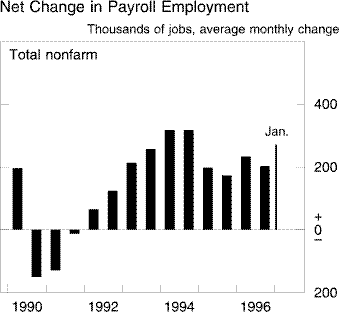
The number of jobs on nonfarm payrolls rose more than
2-1/2 million from December 1995 to December 1996, an
increase of about 2-1/4 percent. Employment gains
were substantial in each quarter last year, and the labor market report
for January of this year showed a further sizable expansion of
payrolls.
Employment in the private service-producing sector, in
which nearly two-thirds of all nonfarm workers are employed, increased
about 3 percent during 1996. Moderate employment gains were
posted in retail trade, transportation, and finance, and sizable gains
in hiring continued in some other service-producing industries, such as
data processing, computer services, and engineering and management.
Job growth at suppliers of personnel--a category that includes
temporary help agencies--was about 6-1/2 percent, a touch
faster than in 1995 but much slower than it had been over 1992-94;
with the tightening of labor markets in the past couple of years,
longer-lasting commitments in hiring may have come back into
greater favor among some employers.
Employment changes among producers of goods were mixed in
1996. In construction, employment climbed about 5-1/2
percent, to a new high that was almost 4 percent above the peak of the
last business expansion. In manufacturing, increases in factory jobs
through the latter part of 1996 were not sufficient to reverse declines
that had taken place earlier in the year. On net, last year's loss of
factory jobs amounted to about 1/2 percent, a shade less
than the average rate of decline since 1979, the year in which
manufacturing employment peaked. Manufacturers of durable goods boosted
employment slightly last year, but many producers of nondurables
implemented further job cuts. As in many other recent years, reductions
in factory employment were accompanied by strong gains in worker
productivity. Consequently, increases in output were sizable--the rise
in the Federal Reserve's index of manufacturing production cumulated to
4-1/4 percent over the year.
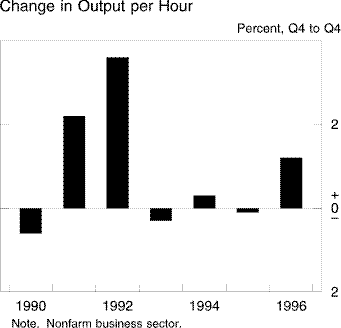
Growth of output per hour in the nonfarm business sector
as a whole picked up in 1996, rising about 1-1/4 percent
over the year according to preliminary data. However, coming after a
three-year period in which output per hour changed little, this rise
left the average rate of productivity growth in the 1990s a bit below
that of the 1980s and well below the average gains achieved in the
first three decades after World War II. The sustained
sluggishness in measured productivity growth this decade is difficult
to explain, as it has occurred during a period when high levels of
investment in new capital and extensive restructuring of business
operations should have been boosting the efficiency of workers. Of
course, measurement problems could be distorting the data. As a summary
measure that relates aggregate output to aggregate input of labor, the
nonfarm productivity index is affected by whatever deficiencies might
be present either in adding up the nominal expenditures for goods and
services in the economy or adjusting those expenditures for price
change. A considerable amount of recent research suggests that growth
of output and productivity is in fact understated, but whether the
degree of understatement has been increasing over time is less
clear.
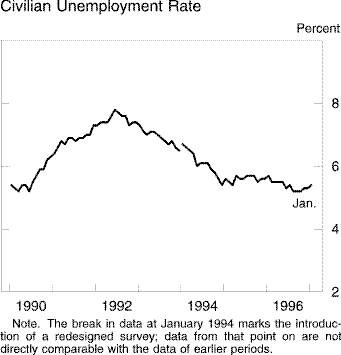
In contrast to the experience of most other recent years, this
past year's rise in employment was accompanied by a
sustained pickup in the labor force participation rate. The rise in
participation boosted the labor supply and helped to relieve pressures
on the labor market. Nonetheless, hiring during 1996 was sufficient to
reduce the civilian unemployment rate from a December 1995 rate of
5.6 percent to a December 1996 rate of 5.3 percent. In
January of this year, the rate remained low, at 5.4 percent.
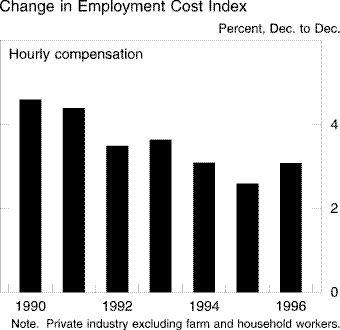
Tightness of the labor market appears to have exerted some upward
pressure on the cost of labor in 1996, even as some workers
continued to express anxiety about job security. The employment cost
index (ECI) for the private nonfarm sector of the economy showed
compensation per hour moving up 3.1 percent over the year.
The index had risen 2.6 percent in 1995. The step-up in hourly
pay increases was to some extent the result of a hike in the minimum
wage that took place at the start of October. More generally, however,
businesses probably had to boost hourly compensation either to attract
workers or to retain them at a time when alternative employment
opportunities were perceived to be more widely
available.
As in 1995, increases in hourly compensation in 1996 came more as
wage and salary increases than as increases in fringe benefits.
According to the ECI, the rise in wage rates for workers in the nonfarm
sector amounted to nearly 3-1/2 percent this past year
after a rise of 2-3/4 percent in 1995. By contrast,
the ECI measure of the hourly cost of benefits rose only 2
percent, slightly less than it did in 1995 and much less than it rose
on average over the past decade. Increases in the cost of benefits have
been held down in recent years by reduced inflation for medical
services and by the actions that many firms have taken to shift
employees into managed care arrangements and to require them to assume
a greater portion of the cost of health insurance and other medical
benefits.
Prices
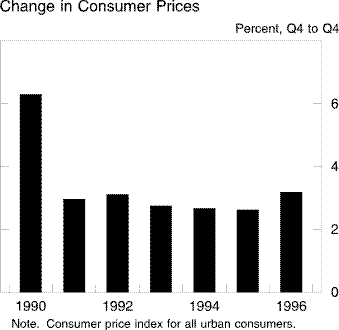
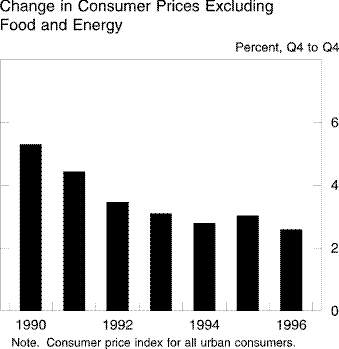
The consumer price index rose more rapidly than in 1995, but the
step-up was concentrated in the food and energy sectors--areas in which
prices were affected by supply limitations that seemed likely to be
of temporary duration. The CPI excluding food and energy--often called
the "core" CPI--rose just a touch more than 2-1/2
percent after increasing 3 percent during 1995. Both the total CPI and
the core CPI have been affected in the past two years by technical
improvements implemented by the Bureau of Labor Statistics that are
aimed at obtaining more accurate readings of price change; the rise
in the CPI in 1996 would have been somewhat greater if procedures used
through 1994 had not been
altered.
Other price indexes generally rose less rapidly than the CPI.
Like the overall CPI, the chain type price index for personal
consumption expenditures (PCE) accelerated somewhat in 1996, but its
rate of rise, shown in the accompanying table, was significantly
lower than that of the CPI. The two measures of consumer prices
differ to some degree in their weights and methods of aggregation. They
also differ somewhat in their selection of price data,
with the PCE measure relying on alternative data in some areas in which
the accuracy of the CPI has been questioned. The chain type price index
for gross domestic purchases, which takes account of the
prices paid by businesses and governments as well as those paid
by consumers, moved up 2-1/4 percent during 1996, about the
same as the percentage rise during 1995. By contrast, price
measures associated with GDP decelerated in 1996 to thirty-year lows of
around 2 percent or less. Conceptually, the GDP measures are
indicative of price changes for goods and services that are
produced domestically rather than price changes for goods and services
purchased domestically--foreign trade accounting for the
difference.
Alternative Measures
of Price Change
Percent
Price
measure
|
1995
|
1996
|
| Fixed weight |
| |
Consumer price index
| 2.7 | 3.2 |
Excluding
food and energy
| 3.0 | 2.6 |
|
| | |
Chain type
| | |
Personal
consumption expenditures
| 2.1 | 2.5 |
Excluding
food and energy
| 2.3 | 2.0 |
Gross domestic
purchases
| 2.3 | 2.2
|
Gross domestic product
| 2.5 | 2.1 |
|
| | |
Deflator
| | |
Gross domestic
product
| 2.5 | 1.8 | |
Note. Changes are
based on quarterly averages and are
measured to the fourth quarter of
the year
indicated from the fourth quarter of the
previous year.
The 1996 outcomes for all these measures reflected an economy in
which inflation pressures were muted. Sharp declines in non-oil import
prices during the year lowered input costs for many domestic firms and
likely caused other firms to restrain their product prices for fear of
losing market share to foreign competitors. Also important, in all
likelihood, were the favorable imprints that several years of moderate
and relatively stable rates of inflation have left on inflation
expectations. Despite the uptick in hourly compensation and adverse
developments in the food and energy sectors, survey data showed little
change in consumers' expectations of inflation, and private
forecasters' views of the prospects for prices held steady. Businesses
commonly described the situation as one in which competitive pressures
were intense and the "leverage" for raising prices simply was not
present.
Food and energy prices were the exceptions. In the food
sector, steep increases in grain prices in 1995 and the first few
months of 1996 caused production adjustments among livestock farmers
and substantial price increases for some livestock products. Later in
the year, grain prices fell back, but livestock production could not
recover in time to prevent significant price advances for some retail
foods. Consumer prices for pork, poultry, and dairy products registered
their largest increases in several years. Retail beef prices
also rose but only moderately: Expansion of the cattle herd in previous
years had laid the groundwork for a high flow of product to consumers,
and herd reductions that occurred in 1996 augmented that flow.
Elsewhere in the food sector, acceleration was reported in the price
index for food away from home--a category that has a weight of almost
40 percent in the CPI for food; the rise in the minimum
wage appears to have been an important factor in the acceleration. All
told, the 1996 rise in CPI food prices amounted to 4-1/4
percent, the largest increase since 1990.
The energy sector was the other major part of the economy in
which significant inflation pressures were evident this past year.
Crude oil prices, which had started firming in the latter part of 1995,
continued on an upward course through much of 1996, rising more than
30 percent in total. Stocks of crude oil and petroleum products
were tight during the year, even after allowing for an apparent
downward trend in firms' desired inventories. Inventory building was
forestalled by production disruptions at refineries, a string of
weather problems here and abroad that boosted fuel requirements for
heating or cooling, and a reluctance of firms to take on
inventories that seemed likely to fall in value once renewed supplies
from Iraq became available. Natural gas, too, was in tight supply at
times, and its price surged. With retail prices of gasoline, fuel oil,
and natural gas all moving up substantially, the CPI for energy rose
about 7-1/2 percent over the four quarters of 1996, the
largest increase since the Gulf War.
The CPI for goods other than food and energy rose 1 percent
during 1996, one of the smallest increases of recent decades. As in
1995, price increases for new vehicles were moderate last year, and
prices of used cars turned down after several years of sizable
advances. Prices of apparel and house furnishings also fell; these
prices, as well as the prices of vehicles, may have been heavily
affected by the softness of import prices. Moderate increases were the
rule among most other categories of goods in the CPI. In the producer
price index, prices of capital equipment rose less than
1/2 percent over 1996; computer prices continued to
plunge, and the prices of other types of equipment rose moderately, on
balance. Materials prices were weak: Prices of intermediate materials
excluding food and energy declined about 1-1/4 percent from
the fourth quarter of 1995 to the final quarter of 1996, and the
producer price index for crude materials excluding food and energy
dropped more than 6-1/2 percent over that period.
Productive capacity was adequate among domestic producers of
materials, and supplies of many materials were readily available at
competitive prices on the world market.
The CPI for non-energy services increased 3-1/4
percent in 1996. The rise was somewhat smaller than the increases of
most other recent years. Prices of medical services decelerated for a
sixth consecutive year, and increases in the cost of shelter were held
down by another year of moderate advances in residential rent and
owners' equivalent rent. Large increases were evident only in scattered
categories: Airfares posted a large increase, and educational costs,
maintaining a long-established trend, continued to rise quite rapidly
relative to prices in general.
Financial Developments
Debt
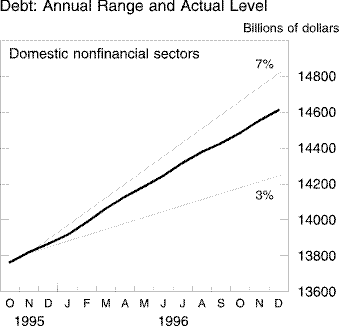
Growth of the debt of nonfinancial sectors slowed slightly last
year, to 5-1/4 percent. The growth of household sector debt
dropped from 8-1/4 percent to 7-1/2 percent, a
deceleration accounted for entirely by a sharp slowing of
consumer credit. The expansion of business borrowing was held
below its 1995 pace by an increase in internally generated funds, but
at 5-1/4 percent, it was faster than in any other
year since 1989. Its strength reflected robust spending,
extremely favorable credit conditions, and financing needs associated
with a high level of mergers and acquisitions. Federal government
debt grew 3-3/4 percent, the lowest rate in more than two
decades. The debt outstanding of the state and local sectors was
unchanged.
The Household
Sector. Consumer credit grew 8-1/4
percent last year, just a bit over half the pace of the preceding two
years. The sharp retrenchment likely reflected the burdens associated
with a substantial accumulation of outstanding consumer debt over
recent years as well as some tightening of lending terms and standards
by commercial banks, particularly with respect to credit cards.
The slowing in consumer credit growth also was associated
with a shift toward increased use of home equity loans. These loans
were marketed vigorously, particularly by finance companies, in part as
a vehicle for consolidating credit card and other outstanding
consumer debt. Some of the growth in home equity loans reflected moves
by finance companies and banks into the sub-prime market--lending
either to higher-risk customers or on terms entailing unusually high
loan-to-value ratios, or both. The push to expand home equity lending
last year offset to some degree the effect of tighter lending standards
and terms on credit cards and other forms of consumer credit.
The shift toward home equity loans, along with a strong
housing market, led to a pickup in mortgage debt growth last year to a
rate of 7-1/2 percent, the largest advance since 1990.
Mortgage borrowing for home purchases was restrained surprisingly
little by the increase in interest rates over the first half of the
year. As noted previously, many borrowers were able to put off, at
least for a time, much of the impact of the increase in rates by
shifting to adjustable-rate mortgages, the rates on which rose much
less last year than those on fixed-rate
mortgages.
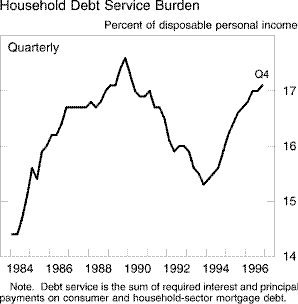
Although the growth of household sector debt fell off a
bit from the pace of recent years, it still exceeded that of disposable
income. With loan rates up on average for mortgages and down only a
little on consumer loans, debt service burdens continued to rise last
year, and some households experienced difficulties servicing
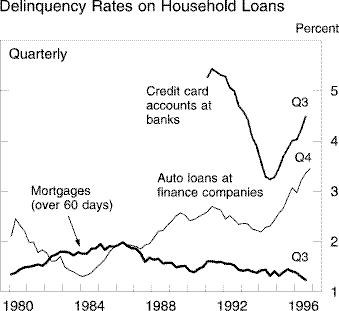
certain kinds of debt. Delinquency rates on banks' consumer loans,
particularly credit card loans, posted a second year of considerable
increase, although they remained below levels in the early 1990s.
At finance companies that are subsidiaries of automakers, auto loan
delinquency rates rose to very high levels; but this rise apparently
resulted in large part from a business strategy to compete in the
vehicle market by easing lending standards. Auto loan delinquency rates
at commercial banks also rose but remained well within historical
ranges. Delinquency rates on residential mortgages remained low.
In the segment of the finance company market that deals in
"sub-prime" auto loans, some problems emerged last month. A small
firm in this market defaulted on its commercial paper after it restated
earlier earnings at lower levels, and another firm filed for
bankruptcy. Although the share prices of these and other firms
primarily engaged in sub-prime lending declined along with their
earnings outlook, this sector constitutes a very small part of the
overall auto loan market, and the implications for the availability of
credit to the household sector overall appear
slight.
Charge-off rates on consumer loans rose at banks in 1996 to
around the peak levels of the last recession in 1990-91. According to
Federal Reserve surveys of senior loan officers, banks had
anticipated some deterioration in the quality of their consumer
loan portfolios last year, but they were surprised by its extent. These
surveys also showed that banks considered the rate of charge-offs last
year to be high relative to the level of delinquencies and that the
credit-scoring models most banks use to evaluate consumer lending
decisions have tended to be too optimistic. An important reason for the
high level of charge-offs and the apparent shortcomings of the
credit-scoring models was a 30 percent increase in personal
bankruptcies. This surge stemmed in part from changes in the bankruptcy
code that became effective at the beginning of last year against a
backdrop of an apparently reduced stigma associated with this method of
dealing with financial problems. Banks responded to the deterioration
in their consumer loan portfolios by tightening standards and terms,
especially on credit cards. In contrast, banks eased terms and
conditions on home equity loans.
Despite the rise in delinquencies on consumer debt, household
balance sheets appear healthy overall, as growth of household assets
over the past two years has more than kept pace with the growth of
debt. Although year-end balance sheet figures are not yet complete, the
net worth of households appears to have risen approximately $5
trillion from the end of 1994 to the end of 1996, an amount that is
equal to almost a full year's personal disposable income. Roughly
two-thirds of that gain has been accounted for by the surge in the
prices of corporate shares, which has lifted the value of a wide range
of household investments, not only directly held stocks but also assets
held in other forms such as pension plans. The ratio of household net
worth to personal disposable income continued to climb this past
year, moving to its highest level in recent decades.
The Business
Sector. Although many interest rates rose last
year, businesses continued to find credit readily available and at
favorable terms. This accommodation likely resulted in part from the
strong financial condition of this sector, reflected in minimal
delinquency rates on bank loans to businesses and very low default
rates on corporate bonds, including those of low-rated issuers. With
securitization of household debt instruments proceeding apace and with
high levels of capital, banks appeared to have ample room on their
balance sheets for business loans. This situation encouraged the
development of a highly competitive lending environment in which banks
further eased a variety of credit terms, such as covenants and markups
over base rates. In capital markets, interest rate spreads of private
debt instruments over Treasuries narrowed, particularly in the case of
high-yield bonds. Surveys by the National Federation of Independent
Business revealed a rising tendency of small businesses to borrow over
1996, with credit availability reported to be in a range more favorable
than at any time in the current economic expansion.
On a gross basis, a pickup in bond issuance by
nonfinancial firms last year was accounted for mainly by
speculative-grade offerings, likely in part a reaction to the improved
pricing. In the fourth quarter, however, investment-grade issuance was
substantial, responding to the decline in interest rates that began in
late summer. Commercial paper declined in the final months of the year,
primarily because of paydowns from bond proceeds, but bank lending
to businesses was strong, owing in some part to robust merger
activity. Despite a marked increase in gross stock issuance--with
strong gains both for initial public offerings and for seasoned
offerings--equity continued to be retired on net last year, as merger
activity remained brisk and businesses used ample cash resources to
repurchase their outstanding shares.
The Government
Sector. The growth of federal debt was held down
in 1996 by legislative constraints on spending and by the boost to tax
receipts from both the stronger economy and a booming stock market. Two
years of contraction of state and local government debt ended last
year. The declines had occurred as issues that were pre-refunded
earlier in the decade, when interest rates were unusually favorable,
matured or became eligible to be called. Pre-refunded debt continued to
be called last year, albeit at a reduced pace, but this decline was
just offset by gross issuance, which picked up.
Depository
Intermediation. The expansion of depository credit
slowed last year, entirely reflecting a slower advance in bank credit.
Growth at thrift institutions picked up, benefiting from strong demand
for residential mortgages and improved capital positions. Growth of
commercial bank loans moderated, as loans to businesses and,
especially, consumers decelerated from elevated rates of growth in
1995. Bank portfolio expansion also appears to have been damped
somewhat by a faster pace of asset securitization, likely spurred by
receptive capital markets. For example, real estate loan growth at
banks was a subdued 4 percent last year, despite a robust housing
market and a pickup in commercial real estate. At the same time,
outstanding securities backed by mortgage pools expanded at a
$179 billion annual rate in the first three quarters of last
year, well above the pace of 1995. Commercial banks are a major source
of securitized mortgages. The outstanding amount of consumer credit
that had been securitized by banks also rose at a brisk pace last year,
although not so rapidly as in 1995. As a result of the slowing of bank
credit, the share of last year's advance in nonfederal debt that ended
up on the books of depositories fell to about 38 percent, down
from around 44 percent in the preceding two years.
The balance sheets and operating results of depositories
remained strong in 1996. Bank profits through the third quarter were at
historically high levels for the fourth consecutive year, reflecting
the maintenance of relatively wide interest rate margins, further
loan growth, and substantial fee income related to sales of mutual
funds as well as to securitization and other off-balance-sheet
activities. As of the third quarter, almost 99 percent of
commercial bank assets were held at banks classified as "well
capitalized." Underlying thrift profits were also stronger last
year. However, profits at thrift institutions and at banks with
deposits insured by the Savings Association Insurance Fund (SAIF) were
held down temporarily by a special assessment on deposits to
recapitalize SAIF. (Some bank deposits are SAIF-insured because of
mergers with thrifts or acquisitions of
them.)
The Monetary Aggregates
Despite the slowing of depository credit, growth of the broader
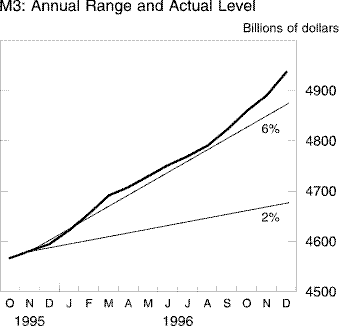
monetary aggregates strengthened last year: M3 expanded 7
percent, up 1 percentage point from 1995 and also 1
percentage point above the upper end of its 2 to 6 percent
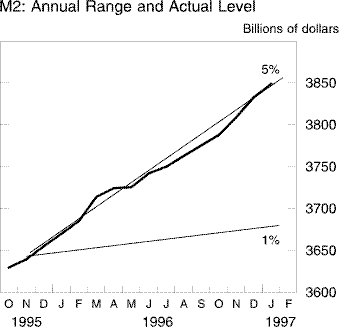
annual range. M2 grew 4-1/2 percent, up
1/2 percentage point and in the upper portion of its 1 to
5 percent range. As noted in Section 1, the ranges for
monetary growth last year had been chosen to be consistent with
approximate price stability and a sustainable rate of real economic
growth, rather than as indicators of the range of money growth rates
likely to prevail under expected economic
conditions.
The acceleration of M3 was caused partly by a shift in
the way banks financed their credit--specifically, substituting
issuance of large time deposits for borrowings from offices abroad.
Both foreign and domestically chartered banks paid down net borrowing
from foreign head offices and branches last year. For domestic banks,
this paydown may have been related to the reduction to zero of
insurance assessments on deposits, beginning with the last quarter of
1995. In addition, the greater growth of M3 relative to that of M2
reflected the need to fund particularly strong loan growth at U.S.
branches and agencies of foreign banks, which do not offer the retail
accounts that dominate deposits in M2.
Growth of both M2 and M3 was supported again last year by
continuing robust advances in money market mutual funds (MMMFs).
Because the yields on these funds are based on the average return
earned on their assets, they lag changes in yields on new market
instruments; thus, the funds tend to attract additional inflows when
market rates are falling. Accordingly, MMMFs advanced most rapidly
in the early part of last year, when the monetary easings of December
and January pulled down short-term rates, and also later in the year,
when short-term rates were again declining. However, these
instruments expanded briskly even in the third quarter, when short-term
rates were rising, suggesting that part of the attractiveness of
MMMFs is the convenience they offer those investors engaged in moving
funds in and out of stock and bond mutual funds, which
expanded at a record pace last year. In addition,
institution-only funds seem to be having considerable success in
marketing cash management programs that capture excess cash of
corporations and municipalities. Likely reflecting the attractiveness
of money market and capital market mutual funds last year, deposits in
M2 actually showed little growth in 1996. Retail deposit growth also
may have been damped by a lack of aggressive pricing of deposits on
the part of banks, as demand for their loans slipped and they
apparently found it cheaper to finance a larger share of loan
originations through securitizations and large time deposits.
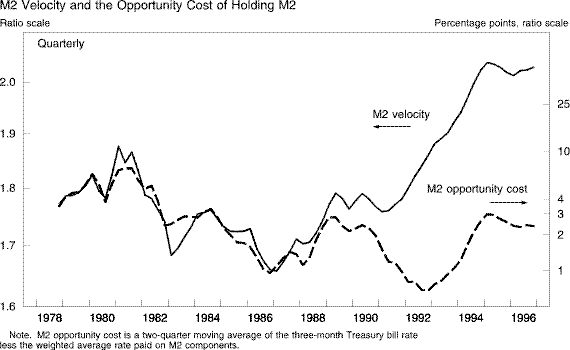
The behavior of M2 relative to income last year, as
summarized by its income velocity, again bore a fairly systematic
relationship to M2's opportunity cost--the return on M2 assets
relative to yields available on alternative instruments. The
relationship of velocity to opportunity costs was reasonably stable
historically, but it broke down in the early 1990s, a period
characterized by extensive restructuring of balance sheets by
households, businesses, and banks. In the process, M2 velocity rose
substantially and, apparently, permanently. Since 1993, velocity no
longer appears to be shifting higher, and M2 velocity and opportunity
costs are moving together about as they did before 1990. However, the
recent period of relative stability in this relationship has been too
short for the Federal Reserve to place increased reliance on M2 as a
guide to policy at this time.
M1 contracted 4-1/2 percent last year, as the
pace at which new arrangements were established to sweep reservable
retail transactions deposits to nonreservable nontransaction accounts
accelerated. The initial amounts removed from transaction accounts by
sweep arrangements established last year amounted to $116
billion, compared with $45 billion in 1995. M1 continued to
be supported by currency growth last year, when foreign demands, which
were depressed earlier in the year partly in anticipation of the new
$100 bill, picked up in the second half. Adjusted for the initial
amounts removed from transaction accounts by sweep arrangements, M1
grew 5-1/4 percent last year. The sweeping of transaction
deposits contributed to a contraction of almost 12 percent in
required reserves--twice the rate of decline of the previous year. The
monetary base decelerated only a little, however, as growth of its
major component, currency, was little changed between 1995 and 1996.
Continued declines in the levels of required reserves have
the potential to impinge on the Federal Reserve's ability to exert
close day-to-day control over the federal funds rate--the overnight
rate on reserves traded among depository institutions. Depositories
hold balances at Reserve Banks to meet daily clearing needs in addition
to satisfying statutory reserve requirements. At low enough levels,
reserve balances may provide inadequate protection against adverse
clearings, and banks' attempts to avoid overdrafts could generate
highly variable daily demands for balances at the Federal Reserve and a
volatile federal funds rate. To date, however, no serious problems have
emerged, in part because the substantial drop in depositories' required
reserve balances attributable to sweeps has been partially offset by
increases in their holdings of required clearing balances--an
arrangement whereby depositories pay for services provided by the
Federal Reserve through the holding of specified amounts in reserve
account balances. In addition, advances in banks' techniques of
monitoring balances at the Federal Reserve and gauging their clearing
needs have enabled them to operate efficiently and smoothly at
relatively low levels of balances. Sweeps have had an effect on Federal
Reserve earnings and the amounts it remits to the Treasury. The decline
in reserve balances of around $12 billion owing to sweeps must be
matched by an accompanying lower level of Treasury securities on the
books of Reserve Banks. The Federal Reserve continues to monitor sweep
activity
closely.
Interest Rates, Equity Prices,
and Exchange
Rates
Interest
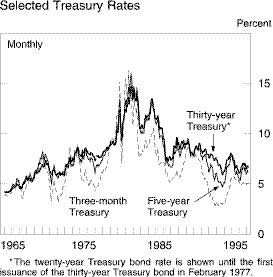
Rates. Declines in interest rates during the
second half of last year on evidence that economic growth had
moderated only partially reversed the increases over the first half.
Reflecting the surprising strength in economic activity last year,
longer-term Treasury rates rose on balance on the order of
1/2 percentage point over the year, and intermediate rates
were up somewhat more. Spreads between most private rates and
Treasuries narrowed markedly last year, reflecting the high quality of
business balance sheets. Municipal rates moved up comparatively little
over the first half of 1996 as earlier relative increases in these
yields associated with discussions of fundamental tax reform were
reversed when the likelihood of such changes to the tax code
diminished. Movements in interest rates over the year appeared to
be basically in their real component, as inflation expectations
were little changed, according to
surveys.
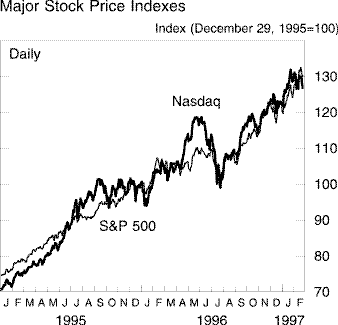
Equity Prices. The
substantial rise in equity prices last year was only a bit below that
registered in 1995. However, in contrast to 1995, when bond rates
declined substantially, the equity gains last year came despite the net
rise in bond rates. Corporate earnings were robust last year, but their
advance fell short of share price increases, and price-earnings ratios
rose to unusually high levels; dividend-price ratios were even more out
of line with historical experience. Market participants appear to
be anticipating further robust earnings growth, and they also seem to
be requiring much less compensation for the extra risk of holding
equities compared to, say, Treasury bonds. Such evaluations may be
based on a perceived environment of persisting low inflation and
balanced economic growth that would lower the odds of disruptions to
economic activity. Other asset prices were generally subdued.
Commodity prices were flat to down. Commercial real estate prices,
although no longer falling, rose at little more than the rate of
inflation. Residential real estate prices increased
moderately.
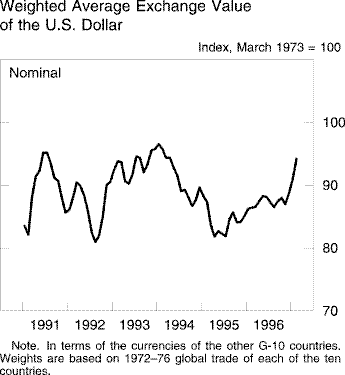
Exchange Rates. The
foreign exchange value of the dollar in terms of the currencies of the
other G-10 countries rose about 4 percent during 1996. When measured in
terms of the currencies of a broader group of U.S. trading partners and
adjusted for differences in consumer price inflation, the appreciation
of the dollar last year was also about 4 percent. Much of the rise in
the exchange value of the dollar occurred during the first half of the
year. Indications of greater-than-expected underlying strength in the
U.S. economy and signs of weakness in some European economies in the
first two quarters reinforced market expectations that U.S. monetary
policy was less likely to be eased than was policy in the other
industrial countries. These expectations boosted U.S. long-term
interest rates relative to those abroad and contributed to upward
pressure on the dollar. The dollar fluctuated somewhat from June
through December but on balance changed little. Over the course of
1996, the dollar appreciated 12 percent in terms of the yen and
7-3/4 percent in terms of the mark. During the first weeks
of 1997, the dollar's average value against the G-10 currencies has
again moved up, appreciating about 7 percent since the end of
December, as economic data have suggested additional strength in
the U.S. economy and have raised questions aboutthe vigor of
economic expansions in several foreign industrial
countries.
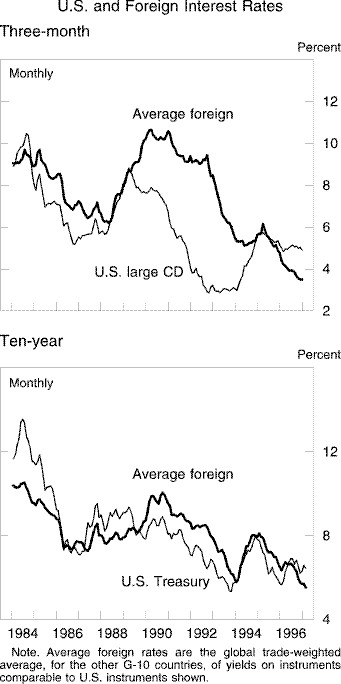
On average, yields on ten-year government securities in the major
foreign industrial countries fell about 80 basis points last year, with
most of the decline coming in the second half. In Italy, long-term
rates declined much more, about 375 basis points, in response to
low growth in real output, substantial progress in lowering inflation,
and sizable, credible measures to reduce the government deficit. In
contrast, long-term rates in the United Kingdom rose slightly as
the economy strengthened. Rates in Japan rose early in the year as the
economy spurted, but subsequent indicators of a weakening expansion
caused rates to turn back down; over the year, they declined about
40 basis points on net. Long-term rates abroad have moved down
slightly further so far this year. Short-term market rates in the
foreign industrial countries on average declined about 120 basis
points during 1996. Except in Japan, official central bank lending
rates were lowered in the foreign G-10 countries last year,
contributing to the decline in market rates.
Equity prices in most industrial countries rose strongly last
year. The major exception was Japan, where prices on balance fell
slightly. The general decline in long-term interest rates abroad and
moves toward monetary ease were among the factors contributing to
the upward movement in stock prices.
The dollar appreciated in nominal terms about 2-1/2
percent on balance against the Mexican peso during 1996, with much of
that appreciation coming over a few weeks in October. After fluctuating
in a narrow range for most of the year, the Mexican peso depreciated in
terms of the dollar when market participants became concerned about the
loss of competitiveness of Mexican exports during the year and about
the partial nature of the government's planned privatization of the
petrochemical industry. Peso interest rates rose in October and
November, but have since more than retraced that increase as the peso
has stabilized. In January, Mexican officials repaid all remaining
outstanding obligations to the Exchange Stabilization Fund of the U.S.
Treasury, completing repayment to the United States of all borrowings
that were made following the peso crisis in late 1994; a partial early
repayment was made to the International Monetary Fund as well.
In the first three quarters of 1996, large increases were
reported in both foreign ownership of assets in the United States and
U.S. ownership of assets abroad. Over the same period, foreign official
assets in the United States increased almost $90 billion. Part of
this increase was associated with exchange market intervention by the
Japanese authorities to counter a brief strengthening of the exchange
value of the yen early in the year, but a larger part reflected the
repurchase of reserves by several European countries whose currencies
strengthened against the mark. About half reflected increases in
reserves of newly industrializing countries.
Private foreigners also added substantially to their assets in
the United States in the first three quarters of 1996. Net purchases of
U.S. Treasury securities by private foreigners amounted to $85
billion through September, and net purchases of corporate and
government agency bonds were equally large. Foreign direct investment
in the United States surged to a record $71 billion in the first
three quarters, reflecting numerous mergers and acquisitions of U.S.
companies by foreigners.
U.S. private investors also added rapidly to their holdings of
foreign assets in the first three quarters of 1996. In contrast to
foreign investors in the United States, U.S. portfolio investors
favored foreign stocks over bonds. Net purchases in Japan were
particularly large in the first half of the year. In addition, U.S.
direct investment abroad remained strong, reflecting acquisitions and
continued privatizations of foreign
firms.
Growth of Money and
Debt
Percent
Period
|
M1
|
M2
|
M3
|
Domestic
nonfinancial
debt
|
| Annual 1
| | | | |
| 1980 | 7.5 | 8.7 | 9.6 | 9.5
|
| 1981 | 5.4 (2.5)2 | 9.0 | 12.4 | 10.2
|
| 1982 | 8.8 | 8.8 | 9.7 | 9.9
|
| 1983 | 10.3 | 11.8 | 9.5 | 11.9
|
| 1984 | 5.4 | 8.1 | 10.8 | 14.5
|
|
| | | | |
| 1985 | 12.0 | 8.6 | 7.7 | 14.2
|
| 1986 | 15.5 | 9.1 | 9.0 | 13.2
|
| 1987 | 6.3 | 4.2 | 5.8 | 10.0
|
| 1988 | 4.3 | 5.7 | 6.3 | 9.0
|
| 1989 | 0.5 | 5.2 | 4.0 | 7.9
|
|
| | | | |
| 1990 | 4.1 | 4.1 | 1.8 | 6.9
|
| 1991 | 7.9 | 3.1 | 1.2 | 4.6
|
| 1992 | 14.4 | 1.8 | 0.6 | 4.7
|
| 1993 | 10.6 | 1.3 | 1.1 | 5.1
|
| 1994 | 2.5 | 0.6 | 1.7 | 5.2
|
|
| | | | |
| 1995 | -1.6 | 4.0 | 6.2 | 5.5
|
| 1996 | -4.6 | 4.6 | 6.9 | 5.3
|
| | | | | |
Quarterly
(annual
rate) 3
| | | | |
| 1996 Q1 | -3.5 | 5.3 | 6.6 | 5.0
|
| Q2 | -1.4 | 4.5 | 6.3 | 5.7
|
| Q3 | -6.5 | 3.4 | 5.4 | 5.3
|
| Q4 | -7.4 | 5.0 | 8.5 | 4.9 | |
1. From average for fourth
quarter of preceding year to
average for fourth quarter
of year indicated.
2. Adjusted for shifts to NOW accounts in
1981.
3. From average for
preceding quarter to average
for quarter indicated.
Section 1
Home |
News and events |
Monetary policy |
February 1997 report
Accessibility | Contact Us
Last update: February 26, 1997 10:00 AM
|