
Humphrey-Hawkins Report, July 21, 1998
Section 2: Economic and Financial Developments in 1998
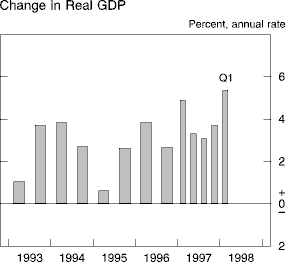
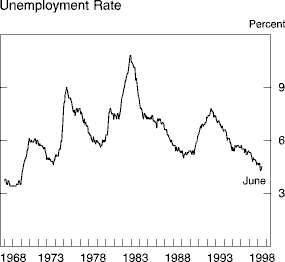
The U.S. economy continued to perform well in the first half of the year. The economic difficulties in Asia and the strong dollar reduced the demand for our exports and intensified the pressures on domestic producers from foreign competition. But these effects were outweighed by robust domestic final demand, owing in part to supportive financial conditions, including a higher stock market, ample availability of credit, and long-term interest rates that in nominal terms were among the lowest in many years. Sharp swings in inventory investment were mirrored in considerable unevenness in the growth of real GDP, which appears to have slowed markedly in the second quarter after having soared to nearly 5-1/2 percent at an annual rate in the first quarter. Nonetheless, over the first half as a whole, the rise in real output was large enough to support sizable gains in employment and to push the unemployment rate down to the range of 4-1/4 to 4-1/2 percent, the lowest in decades.
The further tightening of labor markets in recent quarters has been reflected in a more discernible uptilt to the trend in hourly compensation. But price inflation remained subdued in the first half of the year, held down in part by a sharp decline in energy prices and lower prices for non-oil imports. Intense competition in product markets, ample plant capacity, ongoing productivity gains, and damped inflation expectations also helped to restrain inflation pressures in the face of tight labor markets.
The Household Sector
Consumer Spending. The factors that fueled the sizable increase in household expenditures in 1997 continued to spur spending in the first half of 1998: Growth in employment and real disposable income remained very strong, and households in the aggregate enjoyed significant further gains in net worth. Reflecting these developments, sentiment indexes suggest that consumers continued to feel extraordinarily upbeat about the current and prospective condition of the economy and their own financial situations.
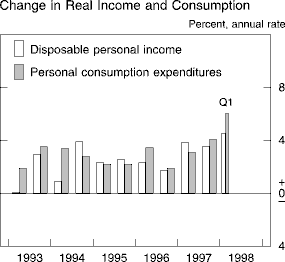
In total, real consumer outlays rose at an annual rate of 6 percent in the first quarter, and the available data point to another large increase in the second quarter. Increases in spending were broad-based, but outlays for durable goods were especially strong. Declining prices and ongoing product innovation continued to stimulate demand for personal computers and other home electronic equipment. In addition, purchases of motor vehicles were sustained by a combination of solid fundamentals and attractive pricing. Indeed, since 1994, sales of light vehicles have been running at a brisk pace of 15 million units (annual rate), and, in the second quarter, a round of very attractive manufacturers' incentives helped lift sales to a pace of 16 million units.
Spending on services also remained robust in the first half of the year, with short-run variations reflecting in part the effects of weather on household energy use; outlays on personal business services, including those related to financial transactions, and on recreation services continued to exhibit remarkable strength. In addition, real outlays for nondurable goods, which rose only moderately last year, grew about 6-1/2 percent at an annual rate in the first quarter, and they appear to have posted another sizable increase in the second quarter.
Real disposable income--that is, after-tax income adjusted for inflation--remained on a strong uptrend in early 1998: It rose about 4 percent at an annual rate between the fourth quarter of 1997 and May 1998. This increase in part reflected a sharp rise in aggregate wages and salaries, which were boosted by sizable gains in both employment and real wage rates; dividends and nonfarm proprietors' incomes also rose appreciably. However, growth in after-tax income (as measured in the national income and product accounts) was restrained by large increases in personal income tax payments--likely owing in part to taxes paid on realized capital gains; capital gains--whether realized or not--are not included in measured income. Reflecting the movements in spending and measured income, the personal saving rate fell from an already low level of about 4 percent in 1997 to 3-1/2 percent during the first five months of 1998.
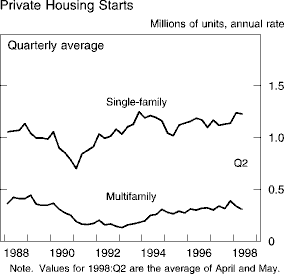
Residential Investment. Housing activity continued to strengthen in the first half of 1998, especially in the single-family sector, where starts rose noticeably and sales of both new and existing homes soared. Indeed, the average level of single-family starts over the first five months of the year--1-1/4 million units at an annual rate--was 9 percent above the pace for 1997 as a whole. Moreover, surveys by the National Association of Homebuilders suggested that housing demand remained vigorous at midyear, and the Mortgage Bankers Association reported that loan applications for home purchases have been around all-time highs of late.
The strong demand for homes has contributed to some firming of house prices, which are now rising in the neighborhood of 3 to 5 percent per year, according to measures that control for shifts in the regional composition of sales and attempt to minimize the effects of changes in the mix of the structural features of houses sold. In nominal terms, these increases are well within the range of recent years; however, in real terms, they are among the largest since the mid-1980s--a development that should reinforce the investment motive for homeownership. Of course, rising house prices may make purchasing homes more difficult for some families. But, with income growth strong and mortgage rates around 7 percent (thirty-year conventional fixed-rate loans), homeownership is as affordable as it has been at any time in the past thirty years. Moreover, innovative programs that relax the standards for mortgage qualification are helping low-income families to finance home purchases. Also, stock market gains have probably boosted demand among higher-income groups, especially in the trade-up and second-home segments of the market.
After having surged in the fourth quarter of 1997, multifamily starts settled back to about 325,000 units (annual rate) over the first five months of 1998, a pace only slightly below that recorded over 1997 as a whole. Support for multifamily construction continued to come from the overall strength of the economy, which undoubtedly has stimulated more individuals to form households, as well as from low interest rates and an ample supply of financing. In addition, real rents picked up over the past year, and the apartment vacancy rate appears to be edging down.
Household Finance. Household net worth rose sharply in the first quarter, pushing the wealth-to-income ratio to another record high. Although the flow of new personal saving was quite small, the revaluation of existing assets added considerably to wealth, with much of these capital gains accumulated on equities held either directly or indirectly through mutual funds and retirement accounts. Of course, these gains have been distributed quite unevenly: The 1995 Survey of Consumer Finances reported that 41 percent of U.S. families own equities in some form, but that families with higher wealth own a much larger share of total equities.
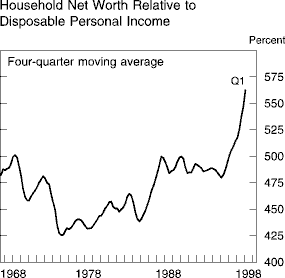
In the first quarter of this year, the runup in wealth, together with low interest rates and high levels of confidence about future economic conditions, supported robust household spending and borrowing. The expansion of household debt, at an annual rate of 7-3/4 percent, was above last year's pace and once again outstripped growth in disposable income. The consumer credit component of household debt grew 4-1/2 percent at an annual rate in the first quarter, a pace roughly double that for the fourth quarter of last year but near the 1997 average. Preliminary data for April and May point to a somewhat smaller advance in the second quarter.
Mortgage debt increased 8-1/4 percent at an annual rate in the first quarter, the same as its fourth-quarter advance and a little above its 1997 growth rate. Fixed-rate mortgage interest rates were 15 basis points lower in the first quarter than three months earlier and 75 basis points lower than a year earlier, which encouraged both new home purchases and a surge of refinancing of existing mortgages. Within total gross mortgage borrowing, the flattening of the yield curve made adjustable-rate mortgages less attractive relative to fixed-rate mortgages, and their share of originations reached the lowest point in recent years. Net borrowing can be boosted by refinancings if households "cash out" some housing equity, but the magnitude of this effect is unclear. In any event, continued expansion of bank real estate lending and a high level of mortgage applications for home purchases suggest a further solid gain in mortgage debt in the second quarter. Home equity credit at banks increased only 2 percent at an annual rate from the fourth quarter of 1997 through June 1998 after having posted a 15-1/2 percent gain last year; this slowdown may reflect a diminished substitution of mortgage debt for consumer debt or simply the increase in mortgage refinancings, which allowed households to pay down more expensive home equity debt or to convert housing equity into cash in a more advantageous manner.
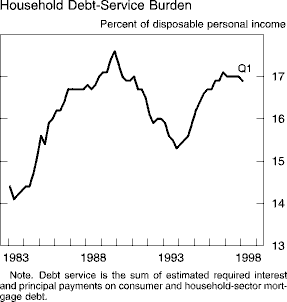
Despite the further buildup of household indebtedness, financial stress among households appears to have stabilized after several years of deterioration. In the aggregate, estimated required payments of loan principal and interest have held about steady relative to disposable personal income--albeit at a high level--since 1996. Over this period, the effect on debt burdens of faster growth of debt than income has been roughly offset by declining interest rates and the associated refinancing of higher interest-rate debt, as well as by a shift toward mortgage debt (which has a longer repayment period). Various measures of delinquency rates on consumer loans leveled off or declined in 1997, and delinquency rates on mortgages have been at very low levels for several years. Personal bankruptcy filings reached a new record high in the first quarter of 1998, but this represented only 6 percent more filings than four quarters earlier, which is the smallest such change in three years.
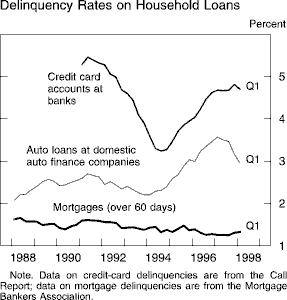
These developments have apparently suggested to banks that they have sufficiently tightened terms and standards on consumer loans. In the Federal Reserve's May Senior Loan Officer Opinion Survey on Bank Lending Practices, relatively few banks, on net, reported tightening standards on credit card or other consumer loans. Little change was reported in the terms of consumer loans.
The Business Sector
Fixed Investment. Real business fixed investment appears to have posted another hefty gain over the first half of 1998 as spending continued to be boosted by positive sales expectations in many industries; favorable financial conditions; and a perceived opportunity, if not a necessity, for firms to install new technology in order to remain competitive. The exceptional growth of investment since the early 1990s has been facilitated in part by the increase in national saving associated with the elimination of the federal budget deficit. It has resulted in considerable modernization and expansion of the nation's capital stock, which have been important in the improved performance of labor productivity over the past few years and which should continue to lift productivity in the future. Moreover, rapid investment in the manufacturing sector in recent years has resulted in large additions to productive capacity, which have helped keep factory operating rates from rising much above average historical levels in the face of appreciable increases in output.
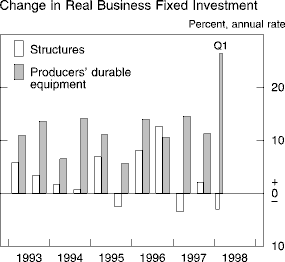
Real outlays for producers' durable equipment, which have been rising more than 10 percent per year, on average, since the early 1990s, moved sharply higher in the first half of 1998. All major categories of equipment spending recorded sizable gains in the first quarter; but as has been true throughout the expansion, outlays for computers rose especially rapidly. Real computer outlays received particular impetus in early 1998 from extensive price-cutting. Purchases of communications equipment have also soared in recent quarters; the rise reflects intense pressures to add capacity to accommodate the growth of networking; the rapid pace of technological advance, especially in wireless communications; and regulatory changes. As for the second quarter, data on shipments, coupled with another steep decline in computer prices, point to a further substantial increase in real computer outlays. Spending on motor vehicles apparently continued to advance as well while demand for other types of capital equipment appears to have remained brisk.
In total, real outlays on nonresidential construction flattened out in 1997 after four years of gains, and they remained sluggish in early 1998. Construction of office buildings remained robust in the first half of this year, after having risen at double-digit rates in 1996 and 1997, and outlays for institutional buildings continued to trend up. However, expenditures for other types of structures were lackluster. Nonetheless, the economic fundamentals for the sector as a whole remain quite favorable: Vacancy rates for office and retail space have continued to fall; real estate prices, though still well below the levels of the mid-1980s in real terms, have risen appreciably in recent quarters; and funding for new projects remains abundant.
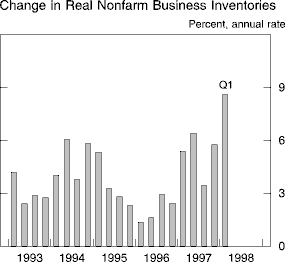
Inventory Investment. The pace of stockbuilding by nonfarm businesses picked up markedly in 1997 and is estimated to have approached $100 billion (annual rate) in the first quarter of 1998--equal to an annual rate increase of 8-1/2 percent in the level of inventories and accounting for more than 1-1/2 percentage points of that quarter's growth in real GDP. The first-quarter accumulation was heavy almost across the board. Among other things, it included a large increase in stocks of petroleum as the unusually warm weather reduced demand for refined products and low prices provided an incentive for refiners and distributors to accumulate stocks. However, overall sales were also very strong, and with only a few exceptions--notably, semiconductors, chemicals, and textiles--stocks did not seem out of line with sales. In any event, fragmentary data for the second quarter point to a considerable slowing in inventory investment that is especially evident in the motor vehicle sector, where stocks were depleted by the combination of strong sales and GM production shortfalls. In addition, petroleum stocks appear to have grown less rapidly than they did in the first quarter, and stockbuilding elsewhere slowed sharply in April and May.
Corporate Profits and Business Finance. Businesses have financed a good part of their investment this year through continued strong cash flow, but they have also increased their reliance on financial markets. Economic profits (book profits after inventory valuation and capital consumption adjustments) have run at 12 percent of national income over the past year, well above the 1980s peak of roughly 9 percent. However, the strength in profits has resulted partly from the low level of net interest payments, leaving total capital income at roughly the same share of national income as at the 1980s peak. Overall, a major portion of the increase in profits between the 1980s and the 1990s represents a realignment of returns from debt-holders to equity-holders.
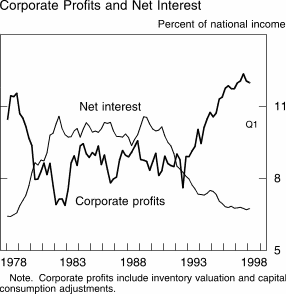
Although their level remains high, the growth of profits has slowed: Economic profits rose 4-3/4 percent at an annual rate in the first quarter compared with 9-1/2 percent between the fourth quarter of 1996 and the fourth quarter of 1997. This slowdown may have resulted from various causes, including rising employee compensation and the Asian financial crisis. Quantifying the effect of the Asian turmoil is difficult: Although only a small share of the profits of U.S. companies is earned in the directly affected Asian countries, the crisis has reduced the prices of U.S. imports and thereby put downward pressure on domestic prices.
Nonfinancial businesses realized annualized economic profit growth of only 1-1/4 percent in the first quarter. Because capital expenditures (including inventory investment) grew much faster, the financing gap--the excess of capital expenditures over retained earnings--widened. As a result, these businesses used less of their cash flow to retire outstanding equity and continued to borrow at the rapid pace of the fourth quarter of 1997, with debt expanding at an annual rate of 9 percent in the first quarter of 1998. Outstanding amounts of both bonds and commercial paper rose especially sharply. The decline in long-term interest rates around year-end encouraged companies to lock in those yields, and gross bond issuance reached a record high in the first quarter of 1998. Borrowing by nonfinancial businesses increased at a slightly slower but still rapid clip in the second quarter, with little change in outstanding commercial paper but very strong net bond issuance and some rebound in bank loans.
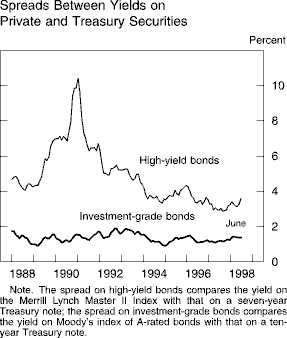
Despite persistent high borrowing, external funding for businesses remained readily available on favorable terms. The spreads between yields on investment-grade bonds and yields on Treasury bonds widened a little from low levels, with investors favoring Treasury securities over corporate securities as a haven from Asian turmoil and, perhaps, with disappointing profits leading to some minor reassessment of the underlying risk of private obligations. The spreads on high-yield bonds also increased, in part because of heavy issuance of these bonds this spring, but they remain narrow by historical standards. In the Federal Reserve's May survey on bank lending practices, banks reported negligible change in business loan standards; moreover, yield spreads on bank loans remained low for both large and small firms. Surveys by the National Federation of Independent Business suggest that small firms have been facing little difficulty in obtaining credit.
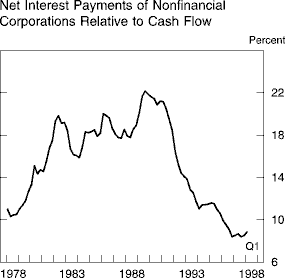
The ready availability of credit has stemmed importantly from the healthy financial condition of many businesses, which have enjoyed an extended period of economic expansion and robust profits. The aggregate debt-service burden for nonfinancial corporations, measured as the ratio of net interest payments to cash flow, dropped substantially between 1990 and 1996 and remains modest, despite edging up in the first quarter of this year. In addition, most measures of financial distress have shown favorable readings. The delinquency rate on commercial and industrial bank loans has stayed very low since 1995, preserving the dramatic decline that occurred in the first half of the decade. After moving up a little in 1996 and 1997, business failures decreased in the first five months of 1998; the liabilities of failed businesses as a share of total liabilities was less than one-quarter the value reached in the early 1990s. At the same time, Moody's upgraded significantly more debt than it downgraded, and the rate of junk bond defaults stayed close to its low 1997 level.
Net equity issuance was less negative in the first quarter of this year than in the fourth quarter of last year, but nonfinancial corporations still retired, on net, about $100 billion of equity at an annual rate. The wave of merger announcements this spring will likely generate strong share retirements over the remainder of the year. Gross equity issuance in the first half of 1998 was close to its pace of the past several years, although investors seemed somewhat cautious about initial public offerings.
The Government Sector
Federal Government. The incoming news on the federal budget continues to be very positive. Over the twelve months ending in May 1998, the unified budget registered a surplus of $60 billion, compared with a deficit of $65 billion during the twelve months ending in May 1997. Soaring receipts continued to be the main force driving the improvement in the budget, but subdued growth in outlays also played a key role. If the latest projections from OMB and CBO are realized, the unified budget for fiscal year 1998 as a whole will show a surplus of roughly $40 billion to $65 billion.
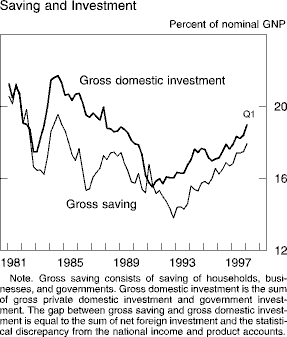
With the federal budget having shifted into surplus, the federal government is now augmenting, rather than drawing on, the pool of national saving. In fact, the improvement in the government's budget position over the past several years has been large enough to generate a considerable rise in gross domestic saving despite a decline in the private saving rate; all told, gross saving by households, businesses, and governments increased from about 14-1/2 percent of gross national product in the early 1990s, when federal saving was at a cyclical low, to more than 17 percent of GNP in recent quarters. This increase in domestic saving, along with increased borrowing from abroad, has financed the surge in domestic investment in this expansion. Moreover, this year's budgetary surplus will continue to pay benefits in future years because it allows the government to reduce its outstanding debt, which implies smaller future interest payments and, all else equal, makes it easier to keep the budget in surplus. If, in fact, the budget outcome over the next several years is as favorable as OMB and CBO now anticipate under current policies, the reduction in the outstanding debt could be substantial.
Federal receipts in the twelve months ending in May 1998 were 10 percent higher than in the same period a year earlier--roughly twice the percentage increase for nominal GDP over the past year. Individual income tax receipts, which have been rising at double-digit rates since the mid-1990s, continued to do so over the past year as the surge in capital gains realizations likely persisted and sizable gains in real income raised the average tax rates on many households (the individual income tax structure being indexed for inflation but not for growth in real incomes). In contrast to the ongoing strength in individual taxes, corporate tax payments increased only moderately over the past year, echoing the deceleration in corporate profits.
Federal expenditures in the twelve months ending in May 1998 were only 1-1/2 percent higher in nominal terms than during the twelve months ending in May 1997, with restraint evident in most categories. Outlays for defense were about unchanged, as were those for income security programs. In the latter category, outlays for low-income support fell as economic activity remained robust, welfare reform capped outlays for family assistance, and enrollment rates in other programs dropped. In the health area, spending on Medicaid picked up somewhat after a period of extraordinarily small increases, whereas growth in spending for Medicare slowed, in part because of the programmatic changes that were legislated in 1997. And, with interest rates little changed and the stock of outstanding federal debt no longer rising, net interest payments stabilized.
Real federal outlays for consumption and gross investment, the part of federal spending that is counted in GDP, fell about 2 percent between the first quarters of 1997 and 1998. The decrease was concentrated in real defense spending, which fell about 2-3/4 percent, roughly the same as over the preceding four quarters; real nondefense spending was unchanged, on balance. In the first quarter, real federal outlays fell at a 10 percent annual rate; the drop reflected a plunge in defense spending, which appears to have been reversed in the second quarter.
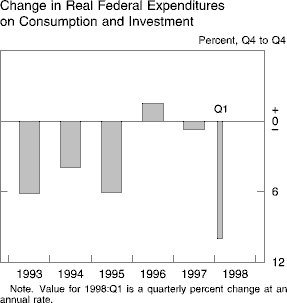
With debt held by the public close to $4 trillion, the government will continue to undertake substantial gross borrowing in order to redeem maturing securities. The government will also continue to adjust its issuance of short-term debt to accommodate seasonal swings in receipts and spending. The surplus during the first half of calendar year 1998--boosted by the huge inflow of individual income tax receipts--enabled the Treasury to reduce its outstanding debt $57 billion while augmenting its cash balance $40 billion. The reduction in debt included net paydowns of coupon securities and bills.
Looking ahead to projected surpluses for coming years, the Treasury announced that it will no longer issue three-year notes and will auction five-year notes quarterly rather than monthly. Over the past several years, the Treasury has accommodated the surprising improvement in federal finances by substantially reducing both bill and coupon issuance. The Treasury hopes that concentrating future coupon offerings in larger, less-frequent auctions will maintain the liquidity of these securities while still allowing for sufficient issuance of bills to maintain their liquidity as well. These changes are also intended to prevent further upcreep in the average maturity of the outstanding debt held by private investors, now standing at sixty-five months. The Treasury continues to work on encouraging the market for inflation-indexed securities, issuing a thirty-year indexed bond in April to complement the existing five-year and ten-year indexed notes.
State and Local Governments. The fiscal position of state and local governments in the aggregate has also remained quite favorable. Strong growth of household income and consumer spending has continued to lift revenues, despite numerous small tax cuts, and governments have continued to hold the line on expenditures. As a result, the consolidated current account of the sector, as measured by the surplus (net of social insurance funds) of receipts over current expenditures in the national income and product accounts, held steady in the first quarter at around $35 billion (annual rate), roughly where it has been since 1995. State governments, which have reaped the main benefits of rising income taxes, have fared especially well: Indeed, all of the forty-seven states whose fiscal years ended by June 30 appear to have achieved balance or to have run surpluses in their general funds budgets in fiscal year 1998.
Real expenditures for consumption and gross investment by states and localities have been rising about 2 percent per year, on average, since the early 1990s, and the increase in spending for the first half of 1998 appears to have been a bit below that trend. These governments added jobs over the first half of the year at about the same rate as they did over 1997 as a whole. However, real construction outlays, which have been drifting down since early 1997, posted a sizable decline in the first quarter, and monthly data suggest that spending dropped further in the spring. The weakness in construction spending over the past year has cut across the major categories of construction and is puzzling in light of the sector's ongoing infrastructure needs and the good financial shape of most governments.
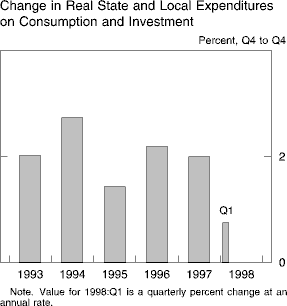
State and local governments responded to the low interest rates during the first half of the year by borrowing at a rapid rate, both to refinance outstanding debt and to fund new capital projects. Because debt retirements eased in the first quarter relative to the fourth quarter of 1997, net issuance increased substantially. Meanwhile, credit quality of state and local debt continued to improve, with much more debt upgraded than downgraded in the first half of the year.
External Sector
Trade and the Current Account. The nominal trade deficit on goods and services widened to $140 billion at an annual rate in the first quarter from $114 billion in the fourth quarter of last year. The current account deficit for the first quarter reached $189 billion (annual rate), 2-1/4 percent of GDP, compared with $155 billion for the year 1997. A larger deficit on net investment income as well as the widening of the deficit on trade in goods and services contributed to the deterioration in the first quarter of the current account balance. In April and May, the trade deficit increased further.
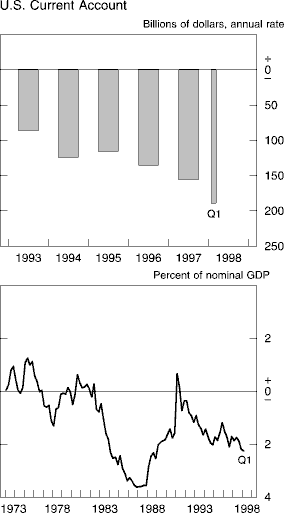
The quantity of imports of goods and services again grew vigorously in the first quarter. The annual rate of expansion at 17 percent exceeded that for 1997 and reflected the continued strength of U.S. economic activity and the effects of past dollar appreciation. Imports of consumer goods, automotive products, and machinery were particularly robust. Preliminary data for April and May suggest that real import growth remained strong. Non-oil import prices fell sharply through the second quarter, reflecting the rise in the exchange value of the dollar over the past year.
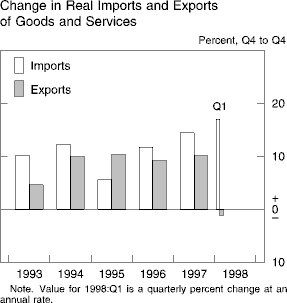
The quantity of exports of goods and services declined at an annual rate of 1 percent in the first quarter, the first such absolute drop since the first quarter of 1994. The weakness of economic activity in a number of our trading partners, with absolute declines in several economies in Asia, and the strength of the dollar, which also partly resulted from the Asian financial crises, largely account for the abrupt halt in the growth of real exports after a 10 percent rise last year. Declines were recorded for machinery, industrial supplies, and agricultural products. Exports to the emerging market economies in Asia, particularly Korea, as well as exports to Japan were down sharply while exports to western Europe and Canada rose moderately. Preliminary data for April and May suggest that real exports declined further.
The Capital Account. Foreign direct investment in the United States and U.S. direct investment abroad continued at near record levels in the first quarter of 1998, spurred by strong merger and acquisition activity across national borders.
In the first quarter, the booming U.S. stock market continued to attract large foreign interest. Net purchases by private foreigners were $29 billion, following record net purchases of $66 billion in the year 1997. Foreign net purchases of U.S. corporate bonds remained substantial, and net purchases of U.S. government agency bonds reached a record $21 billion. In contrast, net sales of U.S. Treasury securities by private foreigners, particularly large net sales booked at a Caribbean financial center, were recorded in the first quarter. U.S. net purchases of foreign stocks and bonds were modest.
Foreign official assets in the United States increased $10 billion in the first quarter. However, the net increase in the second quarter was limited by large dollar sales by Japan.
The Labor Market
Employment and Labor Supply. Labor demand remained robust during the first half of 1998. Growth in payroll employment averaged 243,000 per month, only a little less than in 1997 and well above the rate consistent with the growth in the working-age population. The unemployment rate held steady in the first quarter at 4-3/4 percent but dropped to the range of 4-1/4 percent to 4-1/2 percent in the second quarter.
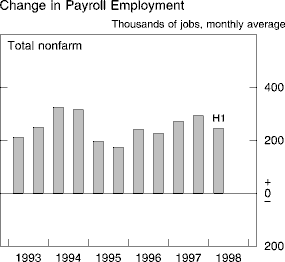
The services industry, which accounts for about 30 percent of nonfarm employment, continued to be the mainstay of employment growth over the first half of 1998, posting increases of 115,000 per month, on average. Within services, hiring remained brisk at computer and data-processing firms and at firms providing engineering and managerial services, but payrolls at temporary help agencies rose much less rapidly than they had over the preceding few years--apparently in part reflecting difficulties in finding workers, especially for highly skilled and technical positions. Sizable increases were also posted at wholesale and retail trade establishments and in the finance, insurance, and real estate category. Construction payrolls were bounced around by unusual winter weather but, on average, rose a brisk 21,000 per month--about the same as in 1997.
In contrast to the robust gains elsewhere, manufacturing firms curbed their hiring in the first half of 1998 in the face of slower growth in factory output. After having risen a torrid 6-1/4 percent in 1997, factory output increased at an annual rate of about 2-1/2 percent between the fourth quarter of last year and May 1998; the deceleration reflected the effects of the Asian crisis as well as a downshift in motor vehicle assemblies and the completion of the 1996-97 ramp-up in aircraft production. In June, factory output is estimated to have fallen 1/2 percent; the GM strike accounted for the decline.
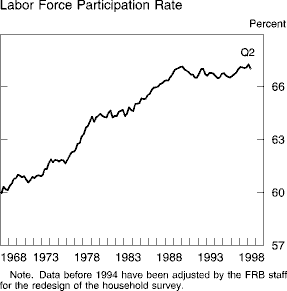
The labor force participation rate--which measures the percentage of the working-age population that is either employed or looking for work--trended up mildly over the past couple of years and stood at 67.1 percent, on average, in the first half of 1998, slightly above the previous cyclical highs achieved in late 1989 and early 1990. Participation among adult women has picked up noticeably in recent years, after having risen only slowly in the first half of the 1990s, and participation among adult men, which had been on a gradual downtrend through mid-decade, appears to have leveled out. In contrast, participation rates for teenagers, for whom school enrollment rates have risen, have continued to sag after having dropped sharply in the early 1990s. Strong labor demand clearly contributed importantly to the rise in overall participation over the past several years, but the expansion of the earned income tax credit and changes in the welfare system probably provided added stimulus.
Labor Costs and Productivity. Firms no doubt are continuing to rely heavily on targeted pay increases and incentives like stock options and bonuses to attract and retain workers. But the tightness of the labor market also appears to be exerting some upward pressure on traditional measures of hourly compensation, which have exhibited a somewhat more pronounced uptrend of late. Indeed, the twelve-month change in the employment cost index (ECI) for private industry workers picked up to 3-1/2 percent in March, compared with 3 percent for the twelve months ending in March 1997 and 2-3/4 percent for the twelve months ending in March 1996. Hourly compensation accelerated especially rapidly for employees of finance, insurance, and real estate firms, some of whom received sizable bonuses and commissions. However, the acceleration was fairly widespread across industries and occupations and, given the relatively small rise in consumer prices over the past year, implies a solid increase in real pay for many workers.
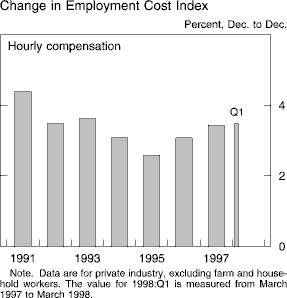
The acceleration in hourly compensation costs over the past year resulted mainly from faster growth of wages and salaries, which rose 4 percent over the twelve months ending in March; this increase was about 1/2 percentage point larger than the one recorded over the preceding twelve months. Separate data on average hourly earnings of production or nonsupervisory workers also show an ongoing acceleration of wages: The twelve-month change in this series was 4.1 percent in June, 1/2 percentage point above the reading for the preceding twelve months.
Benefits costs have generally remained subdued, with the increase over the year ending in March amounting to only about 2-1/4 percent. According to the ECI, employer payments for health insurance have picked up moderately in recent quarters after having been essentially flat over the previous couple of years, and indications are that further increases may be in the offing. Insurers whose profit margins had been squeezed in recent years by pricing strategies designed to gain market share reportedly are raising premiums, and many managed care plans are adding innovations that, while offering greater flexibility and protections to consumers, may boost costs. Additional upward pressure on premiums apparently has come from higher spending on prescription drugs. Among other major components of benefits, rising equity prices have reduced the need for firms to pay into defined benefit plans, and costs for state unemployment insurance and workers' compensation have fallen sharply.
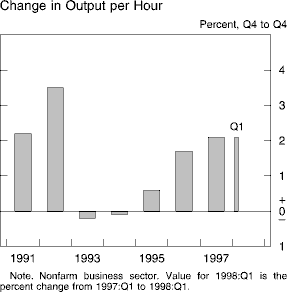
Labor productivity in the nonfarm business sector posted another sizable advance in the first quarter of 1998, bringing the increase over the year ending in the first quarter to an impressive 2 percent. 1 Taking a slightly longer perspective, productivity has risen a bit more than 1-1/2 percent per year, on average, over the past three years, after having risen less than 1 percent per year, on average, over the first half of the decade. At least in part, the recent strong productivity growth has likely been a cyclical response to the marked acceleration of output. But it is also possible that the high levels of business investment over the past several years--and the associated rise in the amount of capital per worker--are translating into a stronger underlying productivity trend. In addition, productivity apparently is being buoyed by the assimilation of new technologies into the workplace. In any event, the faster productivity growth of late is helping to offset the effects of higher hourly compensation on unit labor costs and prices, thereby allowing wages to rise in real terms.
Prices
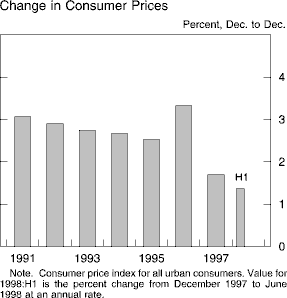
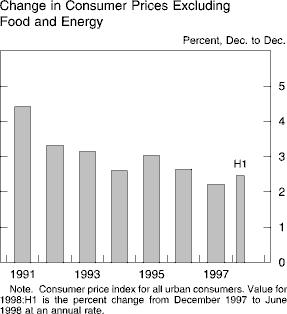
Price inflation remained quiescent in the first half of this year. After having increased 1-3/4 percent in 1997, the consumer price index (CPI) slowed to a crawl in early 1998 as energy prices plummeted, and it recorded a rise of only about 1-1/2 percent at an annual rate over the first six months of the year. The increase in the CPI excluding food and energy--the so-called "core CPI"--picked up to 2-1/2 percent (annual rate) over the first half of the year. However, this pickup follows some unusually small increases in the second half of 1997, and the twelve-month change has held fairly steady at about 2-1/4 percent since late last summer. The chain price index for personal consumption expenditures on items other than food and energy rose only 1-1/2 percent over the year ending in the first quarter of 1998--the most recent information available; this measure typically rises less rapidly than does the core CPI, in part because it is less affected by so-called "substitution bias."
Alternative Measures
of Price Change
Percent
|
Note. Changes are
based on quarterly averages.
The relatively favorable price performance in the first half of 1998 reflected a number of factors that, taken together, continued to exert enough restraint to offset the upward pressures from strong aggregate demand and high levels of labor utilization. One was the drop in oil prices. In addition, non-oil import prices continued to fall, thus further lowering input costs for many domestic industries and limiting the ability of firms facing foreign competition to raise prices for fear of losing sales to producers abroad. Prices of manufactured goods were also held in check by the sizable increase in domestic industrial capacity in recent years and by developments in Asia, which, among other things, led to a considerable softening of commodity prices. Moreover, the various surveys of consumers and forecasters suggest that inflation expectations stayed low--even declined in some measures. For example, according to the Michigan survey, median one-year inflation expectations dropped a bit further this year, after having held fairly steady over 1996 and 1997, and inflation expectations for the next five to ten years edged down from about 3 percent, on average, in 1996 and 1997 to 2-3/4 percent in the second quarter of 1998.
The CPI for goods other than food and energy rose at an annual rate of 1 percent over the first six months of 1998, only a bit above the meager 1/2 percent rise over 1997 as a whole. In the main, the step-up reflected a turnaround in prices of used cars and trucks, and prices of tobacco products and prescription drugs also rose considerably faster than they had in 1997. More generally, prices continued to be restrained by the effect of the strong dollar on prices of import-sensitive goods. For example, prices of new vehicles fell slightly over the first half of the year while prices of other import-sensitive goods--such as apparel and audio-video equipment--were flat or down. In the producer price index, prices of capital equipment were little changed, on balance, over the first half of 1998; they, too, were damped by the competitive effects of falling import prices.
The CPI for non-energy services increased 3 percent over the first six months of 1998, about the same as last year's pace. After having fallen somewhat last year, airfares picked up in the first half of the year, and owner's equivalent rent seems to be rising a bit faster than it did in 1997. In addition, increases in prices of medical services, which had slowed to about 3 percent per year in 1996-97, have been running somewhat higher so far this year. Price changes for most other major categories of services were similar to or smaller than those recorded in 1997.
Energy prices fell sharply in early 1998 as the price of crude oil came under severe downward pressure from weak demand in Asia, a decision by key OPEC producers to increase output, and a relatively warm winter in the Northern Hemisphere. After averaging about $20 per barrel in the fourth quarter of 1997, the spot price of West Texas intermediate dropped to a monthly average of $15 per barrel in March, where it more or less remained through the spring. Crude prices dropped sharply in June following reports of high levels of inventories and revised estimates of oil consumption in Asia but have since firmed in response to an agreement by major oil producers to restrict supply in the months ahead; they now stand at $14-1/2 per barrel. Reflecting the decline in crude prices, retail energy prices fell at an annual rate of 12 percent over the first half of the year, led by a steep drop in gasoline prices.
Developments in the agricultural sector also helped to restrain overall inflation in the first half of this year. Excluding the prices of fruits and vegetables--which tend to be bounced around by short-term swings in the weather--food prices have been rising a scant 0.1 percent per month, on average, since late 1997. Although farmers in some regions of the country are experiencing more prolonged weather problems, conditions in the major crop-producing areas of the Midwest still look relatively favorable, and it appears that aggregate farm production will be sufficient to maintain ample supplies over the coming year, especially in the context of sluggish export demand.
Credit and the Monetary Aggregates
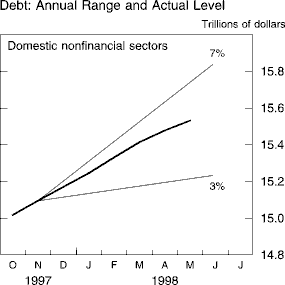
Credit and Depository Intermediation. The total debt of U.S. households, governments, and nonfinancial businesses increased at an annual rate of 5-3/4 percent from the fourth quarter of 1997 through May of this year. Domestic nonfinancial debt now stands a little above the midpoint of the 3 percent to 7 percent range established by the FOMC for 1998. Debt growth has picked up since 1997, as an acceleration of private credit associated with strong domestic demand and readily available supply has more than offset reduced federal borrowing. Indeed, federal debt declined 1-1/4 percent at an annual rate between the fourth quarter of 1997 and May 1998, whereas nonfederal debt increased 8-1/4 percent annualized over the same period. The growth of nonfederal debt has slowed only slightly over the past several months.
Credit on the books of depository institutions rose at roughly the same pace as total credit in the first half of the year. Commercial bank credit advanced rapidly in the first quarter and at a more subdued rate in the second. This slowdown was especially acute in securities holdings, which had surged in both the fourth quarter of 1997 and the first quarter of this year. Responses to the Federal Reserve's May survey on bank lending practices suggest that the earlier runup in securities reflected the efforts of banks to boost returns on equity by increasing leverage; much of the rise in securities holdings was concentrated at banks that were constrained by recent mergers from using their profits to repurchase shares. Loan growth also slowed in the second quarter, although the various loan categories behaved quite differently: Real estate lending expanded most slowly in May and June, whereas business lending rebounded in those months after stalling out in March and April. Outstanding loans at branches and agencies of foreign banks declined in the second quarter, and survey responses identified an actual or expected weakening in the capital position of the parent banks as the primary impetus for a tightening of loan terms and standards.
The Report of Condition and Income (the Call Report) showed that banks' return on equity was about unchanged in the first quarter, staying in the elevated range it has occupied since 1993. Call Report data also indicated that delinquency and charge-off rates on commercial and industrial loans and on real estate loans remain quite low, while delinquency and charge-off rates on consumer loans have leveled off after their previous rise. Indeed, bank profits have benefited importantly in recent years from a low level of provisioning for loan losses. Nevertheless, bank supervisors have been concerned that intense competition and favorable economic conditions might be leading banks to ease standards excessively. They reminded depositories that credit assessments should take account of the possibility of less positive economic circumstances in the future.
The trend toward consolidation in the banking industry continued in the first half of the year. Some of the announced mergers involve combinations of banks and nonbank financial institutions, such as thrifts and insurance companies. Many of the mergers were designed to capitalize on the economies of scale and diversification of risk in nationwide banking; other mergers were undertaken to expand the range of services offered to customers. Although some observers are concerned that consolidation might raise banks' market power, greater national concentration in banking over the past several years has not increased banking concentration in most local markets.
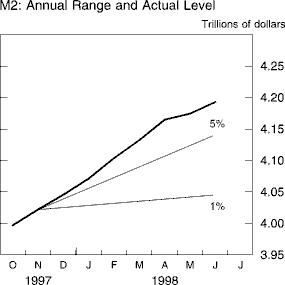
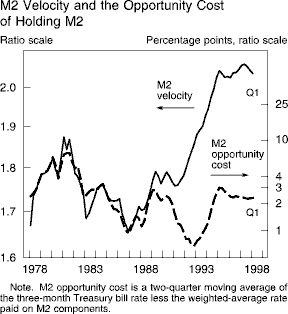
The Monetary Aggregates. The broad monetary aggregates grew more rapidly in the first half of 1998 than they did in 1997, although the pace of their expansion has slowed noticeably in recent months. M2 grew 7-1/4 percent at an annual rate between the fourth quarter of last year and June of this year, placing it well above the top of its 1 percent to 5 percent growth range. When the FOMC established this range in February, it noted that annual ranges represented benchmarks for money growth under conditions of stable prices and velocity behavior in accordance with its pre-1990 historical experience. In fact, nominal spending and income have grown more rapidly than is consistent with price stability and sustainable real growth, and the velocity of M2 (defined as the ratio of nominal GDP to M2) has fallen relative to the behavior predicted by the pre-1990 experience.
Growth of Money and
Debt
Percent
|
1. From average for fourth
quarter of preceding year to
average for fourth quarter
of year indicated.
2. From average for preceding quarter to
average
for quarter indicated.
3. From average for fourth quarter
of 1997 to
average for June (May in the case
of
domestic nonfinancial debt).
For several decades before 1990, M2 velocity showed little overall trend but varied positively from year-to-year with changes in M2 opportunity cost, which is generally defined as the interest forgone by holding M2 assets rather than short-term market instruments such as Treasury bills. The relationship was disturbed in the early 1990s by a sharp increase in velocity; however, since mid-1994, M2 velocity and opportunity cost have again been moving roughly together, though not in lockstep. Indeed, velocity has declined recently despite almost no change in the standard measure of opportunity cost. The dip in velocity may be partly attributable to the flatter yield curve, which has reduced the return on longer-term investments relative to M2 assets--bank deposits and money market mutual funds. Money demand may also be bolstered by the efforts of households to rebalance their portfolios in the face of a booming stock market. By the end of 1997, households' monetary assets had ebbed to the smallest share of their total financial assets in many years, and households may want to reduce the concentration of their assets in relatively risky equities and increase their holdings of less volatile M2 assets. However, in spite of both the flatter yield curve and the rebalancing motive, flows into both bond mutual funds and stock mutual funds have been quite heavy this year.
M2 increased 7-1/4 percent at an annual rate in the second quarter, compared with 8 percent in the first quarter. A buildup in household liquid accounts in preparation for individual income tax payments substantially boosted money growth in April; the clearing of these payments depressed May growth by a roughly equal amount. At an annual rate, M2 increased about 6 percent on average over April and May and about 5 percent in June, suggesting a larger deceleration than is shown by the quarterly average figures.
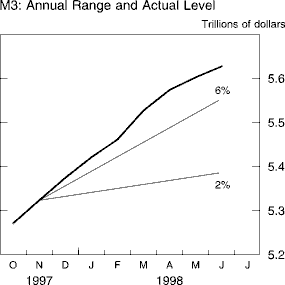
M3 grew 9-3/4 percent at an annual rate between the fourth quarter of last year and June, placing it far above the top of its 2 percent to 6 percent growth range. As with M2, the FOMC chose the growth range for M3 as a benchmark for growth under conditions of price stability and historical velocity behavior. The components of M3 not included in M2 increased 17-1/2 percent at an annual rate over the first half of the year, following an even faster runup in 1997. Rapid expansion of large time deposits in the first quarter was driven importantly by strong credit growth at depository institutions. More recently, gains in this category have diminished as bank credit growth has slowed. Holdings of institutional money market mutual funds climbed more than 20 percent in each of the past three years, and that strength has mounted in 1998 as businesses' interest in outsourcing their cash management evidently has intensified. Because in-house management often involves short-term assets that are not included in M3, the shift to mutual funds boosts M3 growth.
M1 rose 1 percent at an annual rate between the fourth quarter of 1997 and June of this year. Currency expanded 6-1/2 percent annualized over that period, a bit below its increase last year. Foreign demand for U.S. currency apparently weakened substantially in the first five months of the year, with an especially large decline in shipments to Russia. Deposits in M1 declined in the first half of the year owing to the continued introduction of "sweep" programs. M1 growth has been depressed for several years by the spread of these programs, which sweep balances out of transactions accounts, which are subject to reserve requirements, and into savings accounts, which are not. Depositors are unaffected by this arrangement because the funds are swept back when needed; banks benefit because they can reduce their holdings of reserves, which earn no interest. New sweeps of other checkable deposits have slowed sharply, but sweeps of demand deposits into savings deposits--an activity that has become popular more recently--continue to spread. Because many banks have already reduced their required reserves to minimal levels, the total flow of new sweep programs is tapering off, although it remains considerable.
The drop in transactions accounts in the first half of the year caused required reserves to fall 3-3/4 percent at an annual rate, a much slower decline than in 1997. The monetary base grew 5-1/2 percent over the same period, as the runoff in required reserves was more than offset by the increased demand for currency.
The substantial decline in required reserves over the past several years has raised concern that the federal funds rate might become more volatile. Required reserves are fairly predictable and must be maintained on only a two-week average basis. As a result, the Federal Reserve has generally been able to supply a quantity of reserves that is close to the quantity demanded at the federal funds rate intended by the FOMC, and banks have accommodated many unanticipated imbalances in reserve supply by varying the quantity demanded across days. Banks also hold reserve balances to avoid overdrafts after making payments to other banks. But this precautionary demand is more variable and difficult to predict than requirement-related demand, and it cannot be substituted across days. As required reserves drop, more banks will hold deposits at the Federal Reserve only to meet these day-to-day demands, reducing the potential for rate-smoothing behavior.
So far, however, the federal funds rate has not become noticeably more volatile on a maintenance-period average basis. This outcome has occurred partly because the Federal Reserve has responded to the changing nature of reserve demand by conducting open market operations on more days than had been customary and by arranging more operations with overnight maturity, thereby bringing the daily reserve supply more closely in line with demand. At the same time, banks have borrowed more reserves at the discount window and have improved the management of their accounts at Reserve Banks. Between 1995 and 1997, banks also significantly increased their required clearing balances, which they precommit to hold and which earn credits that can be applied to Federal Reserve priced services. Like required reserve balances, required clearing balances are predictable by the Federal Reserve and can be substituted across days within the two-week maintenance period. Going forward, the Federal Reserve's recent decision to use lagged reserve accounting rather than contemporaneous reserve accounting will increase somewhat the predictability of reserve demand by both banks and the Federal Reserve. Still, further declines in required reserves might increase funds-rate volatility. Moreover, one-third of the banks responding to the Federal Reserve's recent Senior Financial Officer Survey report that reserve management is more difficult today than in the past. One way to diminish these problems would be to pay interest on reserve balances, which would reduce banks' incentives to minimize those balances.
Financial Markets
Interest Rates. Yields on intermediate- and long-term Treasury securities moved in a fairly narrow band during the first half of 1998, centered a little below the levels that prevailed in the latter part of 1997. The thirty-year bond yield touched its lowest value since the bond was introduced to the regular auction calendar in 1977; it was also lower than any sustained yield on the twenty-year bond (the longest maturity Treasury security before the issuance of the thirty-year bond) since 1968. Meanwhile, the average yield on five-year notes in the first half of the year was the lowest since early 1994.
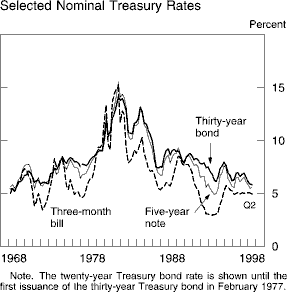
Several factors have contributed to the decline in intermediate- and long-term interest rates over the past year. For one, developments in the U.S. economy and overseas reduced expected inflation and, perhaps, uncertainty about future inflation. Between the second quarter of 1997 and the second quarter of 1998, the median long-term inflation expectation in the Michigan SRC survey of households dropped 1/4 percentage point, and the average expectation in the Philadelphia Federal Reserve's Survey of Professional Forecasters fell almost 1/2 percentage point. Over the same period, the variance of long-term inflation expectations in the Michigan survey was halved. This greater consensus of expectations suggests that people may now place less weight on the possibility of a sharp acceleration in prices; a reduction in perceived inflation risk would tend to reduce term premiums and thereby cut long-term interest rates. A damping of expected growth in real demand here and abroad, triggered importantly by the Asian financial crisis, also has probably pulled rates lower, as has an apparent shift in desired portfolios away from Asia and, to some extent, from other emerging market economies. Lastly, diminished borrowing by the federal government has restrained interest rates by reducing the competition for private domestic saving and for borrowed funds from abroad.
Assessing the relative importance of some of these factors might be aided, in principle, by comparing yields on nominal and inflation-indexed Treasury notes. Between the second quarters of 1997 and 1998, the nominal ten-year yield fell more than 1 percentage point, whereas the inflation-indexed ten-year yield increased a bit. Unfortunately, the relatively recent introduction of inflation-indexed securities and the thinness of trading makes interpreting their yield levels and movements difficult. In particular, light trading may lead investors to view these new securities as providing less liquidity than traditional Treasury notes, and investors may value liquidity especially highly now in the face of uncertainty about developments in Asia.
The yield curve for Treasury securities has recently been flatter than at any point since the beginning of the decade. For example, the difference between the ten-year-note yield and the three-month-bill yield was smaller in the first half of 1998 than in any other half-year period since early 1990. In that earlier episode, the yield curve had been flattened by a sharp runup in short-term interest rates as the Federal Reserve tried to check an upcreep in inflation. In the current episode, short rates have held fairly steady, while long-term rates have declined significantly. Some of the current flatness of the term structure probably stems from the apparent reduction in term premiums noted above. But the flat yield curve may also reflect the expectation that short-term real interest rates, which have been boosted by the decline in inflation over the past year, will drop in the future. Supporting that notion, the yield curve for inflation-indexed debt has become inverted this year, as the return on the five-year indexed note has risen above the return on the ten-year indexed note, which exceeds the return on the new thirty-year indexed bond.
Equity Prices. Equity markets have remained ebullient this year. The S&P 500 composite index rose sharply in the first several months of 1998; it then fell back a little before moving up to a new record in July. The NASDAQ composite, NYSE composite, and Dow Jones Industrial Average followed roughly similar patterns, and these indexes now stand about 17 to 28 percent above their year-end marks. Small capitalization stocks have not fared so well this year, with the Russell 2000 index up about a third as much on net.
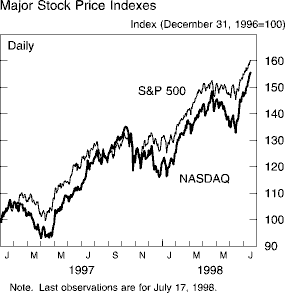
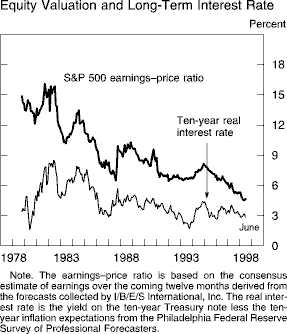
The increase in equity prices combined with the recent slowdown in earnings growth has kept many valuation measures well above their historical ranges. The ratio of prices in the S&P 500 to consensus estimates of earnings over the coming twelve months reached a new high in April and has retreated only slightly from that point. At the same time, the real long-term bond yield--measured either by the ten-year indexed yield or by the difference between the ten-year nominal Treasury yield and inflation expectations in the Philadelphia Federal Reserve's survey--is little changed since year-end. As a result, the forward-earnings yield on stocks exceeds the real yield on bonds by one of the smallest amounts in many years. Apparently, investors share analysts' expectations of robust long-term earnings growth, or they are content with a much smaller equity premium than the historical average.
International Developments
Events in Asia, including in Japan, have continued to dominate developments in global asset markets so far in 1998. During the first months of the year, many financial markets in Asia appeared to stabilize, and progress in implementing economic and financial reform programs was made in most of the countries seriously affected by the crises. In early April, the agreement between Korean banks and their external bank creditors to stretch out short-term obligations was implemented, ending an interval of rollovers by creditors that was endorsed by the authorities in countries that had pledged to support the Korean program. Indonesia reached a second revised agreement with the International Monetary Fund (IMF) in April on a reform program, which was subsequently derailed by political strife and the resignation of the president in late May; the change in political regime was followed by calm, and a new agreement was reached with the IMF management in late June and approved by the IMF Executive Board on July 15.
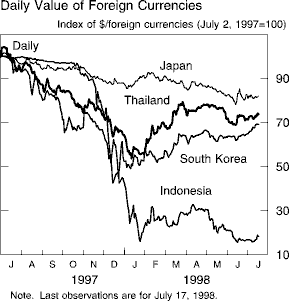
After rising sharply during the final months of 1997 through mid-January of 1998, the exchange value of the dollar in terms of the currencies of Korea, Indonesia, Thailand, and other ASEAN countries partly retraced those gains during February, March, and April. Since then, however, market pressures have again led to further sharp increases in the exchange value of the dollar in terms of the Indonesian rupiah while the dollar has changed little against most of the other Asian emerging-market currencies. Since the end of December, the dollar has declined, on balance, 24 percent against the Korean won and nearly 14 percent against the Thai baht and has risen moderately in terms of the Taiwan dollar and increased about 130 percent in terms of the Indonesian rupiah.
During the first weeks of the year, the dollar depreciated in terms of the Japanese yen as improved prospects elsewhere in Asia and market uncertainty regarding potential intervention by the Japanese monetary authorities lent support to the yen. Indications that significant measures for economic stimulus might be announced also put upward pressure on the yen. In February, the dollar resumed its appreciation with respect to the yen. The rise in the dollar was only temporarily interrupted by sizable intervention purchases of dollars by Japanese authorities in April. Upward pressure on the dollar relative to the yen intensified in late May and June. Renewed signs of cyclical weakness in the Japanese economy and lack of market confidence in the announced programs for addressing the chronic problems within the financial sector contributed to pessimism toward the yen. Persistent weakness in the Japanese economy and the yen, in turn, heightened concerns about prospects elsewhere in Asia; the lower yen adversely affected the competitiveness of goods produced in the Asian emerging-market economies and raised questions about the sustainability of current exchange rate policies in China and Hong Kong.
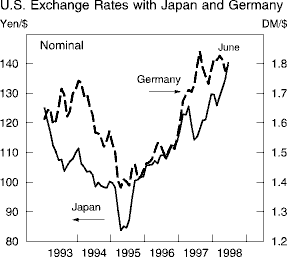
On June 17, the monetary authorities in the United States and Japan cooperated in foreign exchange intervention purchases of yen for dollars. This intervention operation was the first by U.S. authorities since August 1995. In announcing the market intervention, Treasury Secretary Rubin cited Japanese government plans to restore the health of their financial system and to strengthen Japanese domestic demand. He pointed to the stake of Asia and the international community as a whole in Japan's success. The yen rose somewhat following the exchange market intervention and has since partially given back that gain. In the wake of the recent election, which cost the LDP numerous seats in the upper house of the Diet and precipitated the resignation of Prime Minister Hashimoto, the yen changed little. On balance, the dollar has appreciated about 7 percent in terms of the yen since the end of December.
Equity prices in the Asian emerging-market economies have been volatile so far this year as well. These prices recovered somewhat in the first weeks of the year in response to the market perception that the crisis was easing; after fluctuating narrowly, they began moving back down in March and April, reaching new lows in June in Korea, Thailand, and Hong Kong. On balance, these equity prices have moved down about 25 percent (Singapore and Malaysia) to up about 20 percent (Indonesia) since the end of last year. Equity prices in Japan also rose early in the year on improved optimism but then gave back those gains over time with the release of indicators suggesting additional weakness in the Japanese economy. Since the middle of June, Japanese equity prices have rebounded on the perception that significant fiscal stimulus is now more likely. On balance, Japanese equity prices are up about 9 percent from their level at the end of last year. Japanese long-term interest rates continued through May on their downward trend that began in mid-1997, declining an additional 50 basis points during the first five months. Since then, long-term interest rates have retraced more than half of that decline, in part in response to the announcement of the plan for financial restructuring and in part in response to the outcome of the recent election, which heightened expectations of additional fiscal stimulus.
The Asian financial crises have resulted in a sharp drop in the pace of economic activity in the region. Output declined precipitously in the first quarter in those countries most affected, such as Korea, Indonesia, and Malaysia, and slowed in other Asian economies, such as China and Taiwan, that have suffered a loss of competitiveness and reduced external demand as a consequence of the crises. Data for recent months suggest that additional slowing has occurred and that the risk of further spread and deepening of cyclical weakness throughout the region cannot be ruled out. Depreciation of their respective currencies has led to acceleration of domestic prices in several of these economies, particularly in Indonesia and Thailand.
Real GDP in Japan also fell sharply in the first quarter, and output indicators suggest a further decline in the second quarter. Consumer price inflation remains very low. Japanese authorities have announced a series of fiscal measures that are expected to boost domestic demand during the second half of this year. In addition, officials have announced a package of steps directed at restoring the soundness of the financial sector, including (1) introduction of a bridge bank mechanism to facilitate the resolution of failed banks while permitting some of their borrowers to continue to receive credit, (2) measures to improve the disposal of bad bank loans, (3) enhanced transparency and disclosure by banks, and (4) strengthened bank supervision. These actions are intended to restore confidence in Japanese financial institutions and in the prospects for the economy more broadly.
In the other major industrial countries, economic developments so far this year have generally been favorable. The exchange value of the dollar in terms of the German mark has fluctuated narrowly and, on balance, is little changed since the end of December. Market perceptions that progress toward the start of the final stage of European Monetary Union (EMU) is going smoothly and signs of momentum in the U.S. and German economies resulted in little pressure in either direction on the exchange rate. The dollar also fluctuated narrowly against the U.K. pound with little net change so far this year. Moves to tighten monetary conditions in the United Kingdom lent support to the pound, countering some tendency for weak external demand to depress the currency. The Canadian dollar rebounded following a tightening of monetary conditions by the Bank of Canada on January 30. Since early March, however, it has tended to move down as market participants have come to believe that further upward shifts of official interest rates are unlikely and as weakness in global commodity markets, partly the result of reduced economic activity in Asia, have weighed on the currency. The exchange value of the U.S. dollar in terms of the Canadian dollar reached new highs in July and, on balance so far this year, has risen about 4 percent.
Long-term interest rates have declined and equity prices have generally risen strongly in European and Canadian markets this year. Despite signs of strengthening activity in Germany and other continental European countries and continued healthy expansion in the United Kingdom and Canada, long-term rates have moved down since December; long rates are about 60 basis points lower in Germany and less than half that amount lower in Canada. Shifts of international portfolios away from Asian assets and toward those perceived to be safer have probably contributed to rate declines in Continental Europe and in the United States. Stock prices have also continued to rise in Europe and Canada. Since December, the gains have ranged from about 40 percent in Germany and France to about 10 percent in Canada.
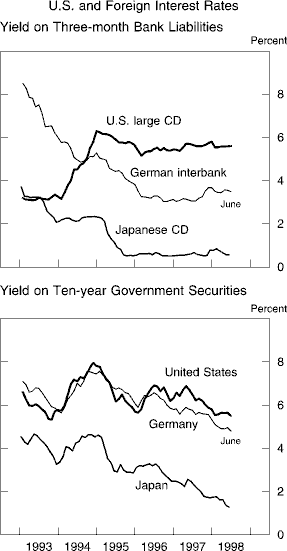
The pace of real economic activity improved somewhat in the first quarter in Germany and on average in the eleven countries slated to proceed with currency union on January 1, 1999. 2 Production and employment data for more recent months suggest continued expansion. Business confidence has firmed as progress toward EMU has continued. Domestic demand is becoming more buoyant in several of these countries, offsetting weakening of external demand arising from events in Asia. On average, inflation remains subdued within the euro area. In the United Kingdom and Canada, real output continues to expand at a relatively rapid rate. U.K. inflation threatens to exceed the government's target of 2-1/2 percent, and the Bank of England raised its official lending rate 25 basis points in June in order to lessen price pressures. Consumer price inflation in Canada remains very low.
Events in Asia have spilled over to affect developments in Latin American countries. Declines in global oil prices have contributed to downward pressure on the exchange value of the Mexican peso. The peso declined sharply in terms of the dollar at the start of the year but then stabilized in February through May as Asian markets partially recovered. It depreciated further in May and June, resulting in a net decline of about 9 percent in terms of the dollar so far this year. The Brazilian exchange rate regime of a controlled crawl and the Argentine regime of pegging the peso to the dollar remain in place, and Brazilian short-term interest rates have been lowered from the very high levels to which they were raised when the Asian crisis intensified in late 1997. Equity prices in these three Latin American countries have been volatile, rising early in the year and giving back those gains since April. On balance this year, equity prices have declined about 10 percent in Mexico and Argentina and have risen about 8 percent in Brazil.
Real output growth remains strong in Mexico and Argentina, but the rate has slowed somewhat from last year's vigorous pace. In Brazil, economic activity has weakened more sharply, in part in response to the tightening of monetary conditions that followed the outbreak of the Asian crisis.
Lower global oil prices have combined with a poorly functioning domestic tax system to trigger a financial crisis in Russia. Russian officials have reached agreement with IMF management on a revised program that includes proposed increased funds from the IMF and other sources. To help finance this program, the General Arrangements to Borrow are being activated in light of the inadequacy of IMF resources to meet actual or expected requests for financing and a need to forestall impairment of the international monetary system. The General Arrangements to Borrow provide the IMF with supplementary lines of credit from the G-10 countries.
1. According to the published data, productivity rose 1.1 percent at an annual rate in the first quarter. However, these data are distorted by inconsistencies in the measurement of hours associated with varying lengths of pay periods across months. Although the Bureau of Labor Statistics has already revised the monthly hours and earnings data to account for these inconsistencies, it will not update the productivity statistics until August. All else being equal, adjusting the productivity data to reflect the Bureau's revisions to hours would substantially raise productivity growth in the first quarter, but it would have little effect on the change over the four quarters ending in the first quarter.
2. Those countries are Austria, Belgium, Finland, France,
Ireland, Italy, Germany, Luxembourg, the Netherlands, Portugal, and
Spain.
Home | News and events | Monetary policy | July 1998 report
Accessibility | Contact Us
Last update: July 21, 1998, 10:15 AM