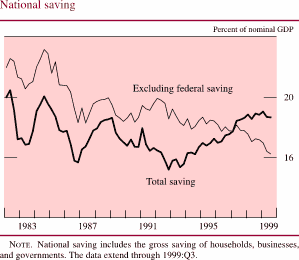
FRB: Humphrey-Hawkins Report, February 17, 2000
The Federal Reserve Board eagle logo links to home page
Monetary Policy Report submitted to the Congress on February 17, 2000, pursuant to the Full Employment and Balanced Growth Act of 1978


Section 2

ECONOMIC AND FINANCIAL DEVELOPMENTS IN 1999 AND EARLY 2000

The U.S. economy retained considerable strength in 1999. According to the Commerce Department's advance estimate, the rise in real gross domestic product over the four quarters of the year exceeded 4 percent for the fourth consecutive year. The growth of household expenditures was bolstered by further substantial gains in real income, favorable borrowing terms, and a soaring stock market. Businesses seeking to maintain their competitiveness and profitability continued to invest heavily in high-tech equipment; external financing conditions in both debt and equity markets were quite supportive. In the public sector, further strong growth of revenues was accompanied by a step-up in the growth of government consumption and investment expenditures, the part of government spending that enters directly into real GDP. The rapid growth of domestic demand gave rise to a further huge increase in real imports of goods and services in 1999. Exports picked up as foreign economies strengthened, but the gain fell short of that for imports by a large margin. Available economic indicators for January of this year show the U.S. economy continuing to expand, with labor demand robust and the unemployment rate edging down to its lowest level in thirty years.

Chart of Change in real GDP

The combination of a strong U.S. economy and improving economic conditions abroad led to firmer prices in some markets this past year. Industrial commodity prices turned up--sharply in some cases--after having dropped appreciably in 1998. Oil prices, responding both to OPEC production restraint and to the growth of world demand, more than doubled over the course of the year, and the prices of non-oil imports declined less rapidly than in previous years, when a rising dollar, as well as sluggish conditions abroad, had pulled them lower. The higher oil prices of 1999 translated into sharp increases in retail energy prices and gave a noticeable boost to consumer prices overall; the chain-type price index for personal consumption expenditures rose 2 percent, double the increase of 1998. Outside the energy sector, however, consumer prices increased at about the same low rate as in the previous year, even as the unemployment rate continued to edge down. Rapid gains in productivity enabled businesses to offset a substantial portion of the increases in nominal compensation, thereby holding the rise of unit labor costs in check, and business pricing policies continued to be driven to a large extent by the desire to maintain or increase market share at the expense of some slippage in unit profits, albeit from a high level.

Chart of Change in PCE chain-type price index

The Household Sector

Personal consumption expenditures increased about 5-1/2 percent in real terms in 1999, a second year of exceptionally rapid advance. As in other recent years, the strength of consumption in 1999 reflected sustained increases in employment and real hourly pay, which bolstered the growth of real disposable personal income. Added impetus came from another year of rapid growth in net worth, which, coming on top of the big gains of previous years, led households in the aggregate to spend a larger portion of their current income than they would have otherwise. The personal saving rate, as measured in the national income and product accounts, dropped further, to an average of about 2 percent in the final quarter of 1999; it has fallen about 4-1/2 percentage points over the past five years, a period during which yearly gains in household net worth have averaged more than 10 percent in nominal terms and the ratio of household wealth to disposable personal income has moved up sharply.

Chart of Change in real income and consumption

Chart of Wealth and saving

The strength of consumer spending this past year extended across a broad front. Appreciable gains were reported for most types of durable goods. Spending on motor vehicles, which had surged about 13-1/2 percent in 1998, moved up another 5-1/2 percent in 1999. The inflation-adjusted increases for furniture, appliances, electronic equipment, and other household durables also were quite large, supported in part by a strong housing market. Spending on services advanced about 4-1/2 percent in real terms, led by sizable increases for recreation and personal business services. Outlays for nondurables, such as food and clothing, also rose rapidly. Exceptional strength in the purchases of some nondurables toward the end of the year may have reflected precautionary buying by consumers in anticipation of the century date change; it is notable in this regard that grocery store sales were up sharply in December and then fell back in January, according to the latest report on retail sales.

Households also continued to boost their expenditures on residential structures. After having surged 11 percent in 1998, residential investment rose about 3-1/4 percent over the four quarters of 1999, according to the advance estimate from the Commerce Department. Moderate declines in investment in the second half of the year offset only part of the increases recorded in the first half. As with consumption expenditures, investment in housing was supported by the sizable advances in real income and household net worth, but this spending category was also tempered a little by a rise in mortgage interest rates, which likely was an important factor in the second-half downturn.

Chart of Change in real residential investment

Nearly all the indicators of housing activity showed upbeat results for the year. Annual sales of new and existing homes reached new peaks in 1999, surpassing the previous highs set in 1998. Although sales dropped back a touch in the second half of the year, their level through year-end remained quite high by historical standards. Builders' backlogs also were at high levels and helped support new construction activity even as sales eased. Late in the year, reports that shortages of skilled workers were delaying construction became less frequent as building activity wound down seasonally, but builders also continued to express concern about potential worker shortages in 2000. For 1999 in total, construction began on more than 1.3 million single-family dwellings, the most since the late 1970s; approximately 330,000 multifamily units also were started, about the same number as in each of the two previous years. House prices rose appreciably and, together with the new investment, further boosted household net worth in residential real estate.

The increases in consumption and residential investment in 1999 were, in part, financed by an expansion of household debt estimated at 9-1/2 percent, the largest increase in more than a decade. Mortgage debt, which includes the borrowing against owner equity that may be used for purposes other than residential investment, grew a whopping 10-1/4 percent. Higher interest rates led to a sharp drop in refinancing activity and prompted a shift toward the use of adjustable-rate mortgages, which over the year rose from 10 percent to 30 percent of originations. Consumer credit advanced 7-1/4 percent, boosted by heavy demand for consumer durables and other big-ticket purchases. Credit supply conditions were also favorable; commercial banks reported in Federal Reserve surveys that they were more willing than in the previous year or two to make consumer installment loans and that they remained quite willing to make mortgage loans.

Chart of Delinquency rates on household loans

The household sector's debt-service burden edged up to its highest level since the late 1980s; however, with employment rising rapidly and asset values escalating, measures of credit quality for household debt generally improved in 1999. Delinquency rates on home mortgages and credit cards declined a bit, and those on auto loans fell more noticeably. Personal bankruptcy filings fell sharply after having risen for several years to 1997 and remaining elevated in 1998.

The Business Sector

Private nonresidential fixed investment increased 7 percent during 1999, extending by another year a long run of rapid growth in real investment outlays. Strength in capital investment has been underpinned in recent years by the vigor of the business expansion, by the advance and spread of computer technologies, and by the ability of most businesses to readily obtain funding through the credit and equity markets.

Chart of Change in real nonresidential fixed investment

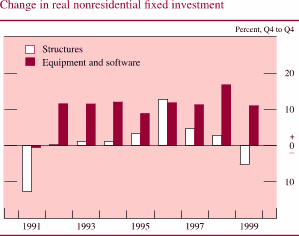
Investment in high-tech equipment continued to soar in 1999. Outlays for communications equipment rose about 25 percent over the course of the year, boosted by a number of factors, including the expansion of wireless communications, competition in telephone markets, the continued spread of the Internet, and the demand of Internet users for faster access to it. Computer outlays rose nearly 40 percent in real terms, and the purchases of computer software, which in the national accounts are now counted as part of private fixed investment, rose about 13 percent; for both computers and software the increases were roughly in line with the annual average gains during previous years of the expansion.

The timing of investment in high-tech equipment over the past couple of years was likely affected to some degree by business preparations for the century date change. Many large businesses reportedly invested most heavily in new computer equipment before the start of 1999 to leave sufficient time for their systems to be tested well before the start of 2000; a very steep rise in computer investment in 1998--roughly 60 percent in real terms--is consistent with those reports. Some of the purchases in preparation for Y2K most likely spilled over into 1999, but the past year also brought numerous reports of businesses wanting to stand pat with existing systems until after the turn of the year. Growth in computer investment in the final quarter of 1999, just before the century rollover, was the smallest in several quarters.

Spending on other types of equipment rose moderately, on balance, in 1999. Outlays for transportation equipment increased substantially, led by advances in business purchases of motor vehicles and aircraft. By contrast, a sharp decline in spending on industrial machinery early in the year held the yearly gain for that category to about 2 percent; over the final three quarters of the year, however, outlays picked up sharply as industrial production strengthened.

Private investment in nonresidential structures fell 5 percent in 1999 according to the advance estimate from the Commerce Department. Spending on structures had increased in each of the previous seven years, rather briskly at times, and the level of investment, though down this past year, remained relatively high and likely raised the real stock of capital invested in structures appreciably further. Real expenditures on office buildings, which have been climbing rapidly for several years, moved up further in 1999, to the highest level since the peak of the building boom of the 1980s. In contrast, investment in other types of commercial structures, which had already regained its earlier peak, slipped back a little, on net, this past year. Spending on industrial structures, which accounts for roughly 10 percent of total real outlays on structures, fell for a third consecutive year. Outlays for the main types of institutional structures also were down, according to the initial estimates. Revisions to the data on nonresidential structures often are sizable, and the estimates for each of the three years preceding 1999 have eventually shown a good bit more strength than was initially reported.

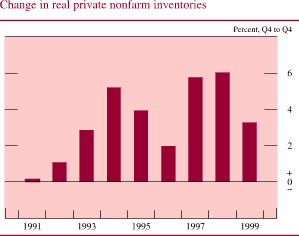
After increasing for two years at a rate of about 6 percent, nonfarm business inventories expanded more slowly this past year--about 3-1/4 percent according to the advance GDP report. During the year, some businesses indicated that they planned to carry heavier stocks toward year-end to protect themselves against possible Y2K disruptions, and the rate of accumulation did in fact pick up appreciably in the fall. But business final sales remained strong, and the ratio of nonfarm stocks to final sales changed little, holding toward the lower end of the range of the past decade. With the ratio so low, businesses likely did not enter the new year with excess stocks.

Chart of Change in real private nonfarm inventories

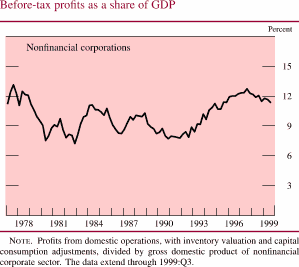
After slowing to a 1 percent rise in 1998, the economic profits of U.S. corporations--that is, book profits with inventory valuation and capital consumption adjustments--picked up in 1999. Economic profits over the first three quarters of the year averaged about 3-1/2 percent above the level of a year earlier. The earnings of corporations from their operations outside the United States rebounded in 1999 from a brief but steep decline in the second half of 1998, when financial market disruptions were affecting the world economy. The profits earned by financial corporations on their domestic operations also picked up after having been slowed in 1998 by the financial turmoil; growth of these profits in 1999 would have been greater but for a large payout by insurance companies to cover damage from Hurricane Floyd. The profits that nonfinancial corporations earned on their domestic operations in the first three quarters of 1999 were about 2-1/2 percent above the level of a year earlier; growth of these earnings, which account for about two-thirds of all economic profits, had slowed to just over 2 percent in 1998 after averaging 13 percent at a compound annual rate in the previous six years. Nonfinancial corporations have boosted volume substantially further over the past two years, but profits per unit of output have dropped back somewhat from their 1997 peak. As of the third quarter of last year, economic profits of nonfinancial corporations amounted to slightly less than 11-1/2 percent of the nominal output of these companies, compared with a quarterly peak of about 12-3/4 percent two years earlier.

Chart of Before-tax profits as a share of GDP

The borrowing needs of nonfinancial corporations remained sizable in 1999. Capital spending outstripped internal cash flow, and equity retirements that resulted from stock repurchases and a blockbuster pace of merger activity more than offset record volumes 
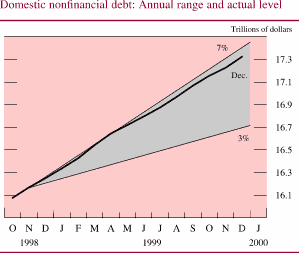
of both seasoned and initial public equity offerings. Overall, the debt of nonfinancial businesses grew 10-1/2 percent, down only a touch from its decade-high 1998 pace.

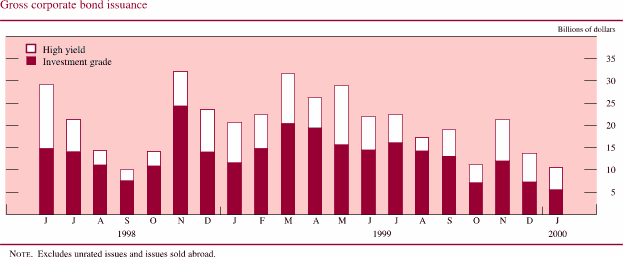
The strength in business borrowing was widespread across funding sources. Corporate bond issuance was robust, particularly in the first half of the year, though the markets' increased preference for liquidity and quality, amid an appreciable rise in defaults on junk bonds, left issuance of below-investment-grade securities down more than a quarter from their record pace in 1998. The receptiveness of the capital markets helped firms to pay down loans at banks--which had been boosted to an 11-3/4 percent gain in 1998 by the financial market turmoil that year--and growth in these loans slowed to a more moderate 5-1/4 percent pace in 1999. The commercial paper market continued to expand rapidly, with domestic nonfinancial outstandings rising 18 percent on top of the 14 percent gain in 1998.

Chart of Gross corporate bond issuance

Commercial mortgage borrowing was strong again as well, as real estate prices generally continued to rise, albeit at a slower pace than in 1998, and vacancy rates generally remained near historical lows. The mix of lending shifted back to banks and life insurance companies from commercial mortgage-backed securities, as conditions in the CMBS market, especially investor appetites for lower-rated tranches, remained less favorable than they had been before the credit market disruptions in the fall of 1998.

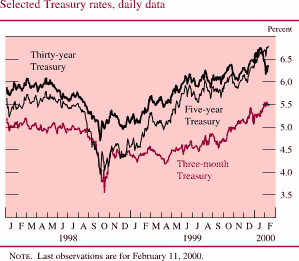
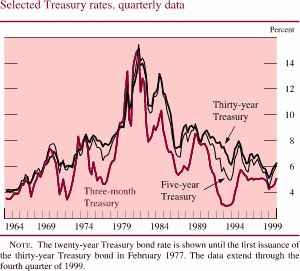
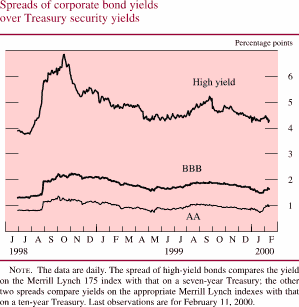
Risk spreads on corporate bonds seesawed during 1999. Over the early part of the year, spreads reversed part of the 1998 run-up as markets recovered. During the summer, they 
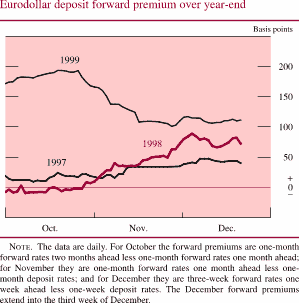
rose again in response to concerns about market liquidity, expectations of a surge in financing before the century date change, and anticipated firming of monetary policy. Swap spreads, in particular, exhibited upward pressure at this time. The likelihood of year-end difficulties seemed to diminish in the fall, and spreads again retreated, ending the year down on balance but generally above the levels that had prevailed over the several years up to mid-1998.

Chart of Spreads of corporate bond yields over Treasury security yields

Federal Reserve surveys indicated that banks firmed terms and standards for commercial and industrial loans a bit further, on balance, in 1999. In the syndicated loan market, spreads for lower-rated borrowers also ended the year higher, on balance, after rising substantially in 1998. Spreads for higher-rated borrowers were fairly steady through 1998 and early 1999, widened a bit around midyear, and then fell back to end the year about where they had started.

Chart of Net interest payments of nonfinancial corporations relative to cash flow

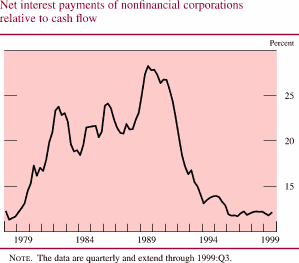
The ratio of net interest payments to cash flow for nonfinancial firms remained in the low range it has occupied for the past few years, but many measures of credit quality nonetheless deteriorated in 1999. Moody's Investors Service downgraded more nonfinancial debt issuers than it upgraded over the year, affecting a net $78 billion of debt. The problems that emerged in the bond market were concentrated mostly among borrowers in the junk sector, and partly reflected a fallout from the large volume of issuance and the generous terms available in 1997 and early 1998; default rates on junk bonds rose to levels not seen since the recession 
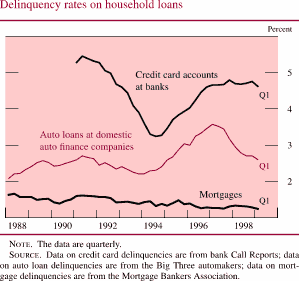
of 1990-91. Delinquency rates on C&I loans at commercial banks ticked up in 1999, albeit from very low levels, while the charge-off rate for those loans continued on its upward trend of the past several years. Business failures edged up last year but remained in a historically low range.

The Government Sector

Buoyed by rapid increases in receipts and favorable budget balances, the combined real expenditures of federal, state, and local governments on consumption and investment rose about 4-3/4 percent from the fourth quarter of 1998 to the fourth quarter of 1999. Annual data, which smooth through some of the quarterly noise that is often evident in government outlays, showed a gain in real spending of more than 3-1/2 percent this past year, the largest increase of the expansion. Federal expenditures on consumption and investment were up nearly 3 percent in annual terms; real defense expenditures, which had trended lower through most of the 1990s, rose moderately, and outlays for nondefense consumption and investment increased sharply. Meanwhile, the consumption and investment expenditures of state and local governments rose more than 4 percent in annual terms; growth of these outlays has picked up appreciably as the expansion has lengthened.

Chart of Annual change in real government expenditures on consumption and investment

At the federal level, expenditures in the unified budget rose 3 percent in fiscal 1999, just a touch less than the 3-1/4 percent rise of the preceding fiscal year. Faster growth of nominal spending on items that are included in consumption and investment was offset in the most recent fiscal year by a deceleration in other categories. Net interest outlays fell more than 5 percent--enough to trim total spending growth about 3/4 percentage point--and only small increases were recorded in expenditures for social insurance and income security, categories that together account for nearly half of total federal outlays. In contrast, federal expenditures on Medicaid, after having slowed in 1996 and 1997, picked up again in the past two fiscal years. Spending on agriculture doubled in fiscal 1999; the increase resulted both from a step-up in payments under farm safety net programs that were retained in the "freedom to farm" legislation of 1996 and from more recent emergency farm legislation.

Federal receipts grew 6 percent in fiscal 1999 after increases that averaged close to 9 percent in the two previous fiscal years. Net receipts from taxes on individuals continued to outpace the growth of personal income, but by less than in other recent years, and receipts from corporate income taxes fell moderately. Nonetheless, with total receipts growing faster than spending, the surplus in the unified budget continued to rise, moving from $69 billion in fiscal 1998 to $124 billion this past fiscal year. Excluding net interest payments--a charge resulting from past deficits--the federal government recorded a surplus of more than $350 billion in fiscal 1999.

Chart of Federal receipts and expenditures

Federal saving, a measure that results from a translation of the federal budget surplus into terms consistent with the national income and product accounts, amounted to 2-1/4 percent of nominal GDP in the first three quarters of 1999, up from 1-1/2 percent in 1998 and 1/2 percent in 1997. Before 1997, federal saving had been negative for seventeen consecutive years, by amounts exceeding 3 percent of nominal GDP in several years--most recently in 1992. The change in the federal government's saving position from 1992 to 1999 more than offset the sharp drop in the personal saving rate and helped lift national saving from less than 16 percent of nominal GDP in 1992 and 1993 to a range of about 18-1/2 percent to 19 percent over the past several quarters.

Federal debt growth has mirrored the turnabout in the government's saving position. In the 1980s and early 1990s, borrowing resulted in large additions to the volume of outstanding government debt. In contrast, with the budget in surplus the past two years, the Treasury has been paying down debt. Without the rise in federal saving and the reversal in borrowing, interest rates in recent years likely would have been higher than they have been, and private capital formation, a key element in the vigorous economic expansion, would have been lower, perhaps appreciably.

Chart of National saving

The Treasury responded to its lower borrowing requirements in 1999 primarily by reducing the number of auctions of thirty-year bonds from three to two and by trimming auction sizes for notes and Treasury inflation-indexed securities (TIIS). Weekly bill volumes were increased from 1998 levels, however, to help build up cash holdings as a Y2K precaution. For 2000, the Treasury plans major changes in debt management in an attempt to keep down the average maturity of the debt and maintain sufficient auction sizes to support the liquidity and benchmark status of its most recently issued securities, while still retiring large volumes of debt. Alternate quarterly refunding auctions of five- and ten-year notes and semiannual auctions of thirty-year bonds will now be smaller reopenings of existing issues rather than new issues. Thirty-year TIIS will now be auctioned once a year rather than twice, and the two auctions of ten-year TIIS will be modestly reduced. Auctions of one-year Treasury bills will drop from thirteen a year to four, while weekly bill volumes will rise somewhat. Finally, the Treasury plans to enter the market to buy back in "reverse auctions" as much as $30 billion of outstanding securities this year, beginning in March or April.

Chart of Federal government debt held by the public

State and local government debt expanded 4-1/4 percent in 1999, well off last year's elevated pace. Borrowing for new capital investment edged up, but the roughly full-percentage-point rise in municipal bond yields over the year led to a sharp drop in advance refundings, which in turn pulled gross issuance below last year's level. Tax revenues continued to grow at a robust rate, improving the financial condition of states and localities, as reflected in a ratio of debt rating upgrades to downgrades of more than three to one over the year. The surplus in the current account of state and local governments in the first three quarters of 1999 amounted to about 1/2 percent of nominal GDP, about the same as in 1998 but otherwise the largest of the past several years.

The External Sector

Trade and the Current Account

U.S. external balances deteriorated in 1999 largely because of continued declines in net exports of goods and services and some further weakening of net investment income. The nominal trade deficit for goods and services widened more than $100 billion in 1999, to an estimated $270 billion, as imports expanded faster than exports. For the first three quarters of the year, the current account deficit increased more than one-third, reaching $320 billion at an annual rate, or 3-1/2 percent of GDP. In 1998, the current account deficit was 2-1/2 percent of GDP.

Chart of U.S. current account

Real imports of goods and services expanded strongly in 1999--about 13 percent according to preliminary estimates--as the rapid import growth during the first half of the year was extended through the second half. The expansion of real imports was fueled by the continued strong growth of U.S. domestic expenditures. Declines in non-oil import prices through most of the year, partly reflecting previous dollar appreciation, contributed as well. All major import categories other than aircraft and oil recorded strong increases. While U.S. consumption of oil rose about 4 percent in 1999, the quantity of oil imported was about unchanged, and inventories were drawn down.

Chart of Change in real imports and exports of goods and services

Real exports of goods and services rose an estimated 4 percent in 1999, a somewhat faster pace than in 1998. Economic activity abroad picked up, particularly in Canada, Mexico, and Asian developing economies. However, the lagged effects of relative prices owing to past dollar appreciation held down exports. An upturn in U.S. exports to Canada, Mexico, and key Asian emerging markets contrasted with a much flatter pace of exports to Europe, Japan, and South America. Capital equipment composed about 45 percent of U.S. goods exports, industrial supplies were 20 percent, and agricultural, automotive, and consumer goods were each roughly 10 percent.

Capital Account

U.S. capital flows in 1999 reflected the relatively strong cyclical position of the U.S. economy and the global wave of corporate mergers. Foreign purchases of U.S. securities remained brisk--near the level of the previous two years, in which they had been elevated by the global financial unrest. The composition of foreign securities purchases in 1999 showed a continued shift away from Treasuries, in part because of the U.S. budget surplus and the decline in the supply of Treasuries relative to other securities and, perhaps, to a general increased tolerance of foreign investors for risk as markets calmed after their turmoil of late 1998. Available data indicate that private foreigners sold on net about $20 billion in Treasuries, compared with net purchases of $50 billion in 1998 and $150 billion in 1997. These sales of Treasuries were more than offset by a pickup in foreign purchases of their nearest substitute--government agency bonds--as well as corporate bonds and equities.

Foreign direct investment flows into the United States were also robust in 1999, with the pace of inflows in the first three quarters only slightly below the record inflow set in 1998. As in 1998, direct investment inflows last year were elevated by several large mergers, which left their imprint on other parts of the capital account as well. In the past two years, many of the largest mergers have been financed by a swap of equity in the foreign acquiring firm for equity in the U.S. firm being acquired. The Bureau of Economic Analysis estimates that U.S. residents acquired more than $100 billion of foreign equity through this mechanism in the first three quarters of 1999. Separate data on market transactions indicate that U.S. residents made net purchases of Japanese equities. They also sold European equities, probably in an attempt to rebalance portfolios in light of the equity acquired through stock swaps. U.S. residents on net purchased a small volume of foreign bonds in 1999. U.S. direct investment in foreign economies also reflected the global wave of merger activity in 1999 and will likely total something near its record level of 1998.

Available data indicate a return to sizable capital inflows from foreign official sources in 1999, following a modest outflow in 1998. The decline in foreign official assets in the United States in 1998 was fairly widespread, as many countries found their currencies under unwanted downward pressure during the turmoil. By contrast, the increase in foreign official reserves in the United States in 1999 was fairly concentrated in a relatively few countries that experienced unwanted upward pressure on their currencies vis-a-vis the U.S. dollar.

The Labor Market

As in other recent years, the rapid growth of aggregate output in 1999 was associated with both strong growth of productivity and brisk gains in employment. According to the initial estimate for 1999, output per hour in the nonfarm business sector rose 3-1/4 percent over the four quarters of the year, and historical data were revised this past year to show stronger gains than previously reported in the years preceding 1999. As the data stand currently, the average rate of rise in output per hour over the past four years is about 2-3/4 percent--up from an average of 1-1/2 percent from the mid-1970s to the end of 1995. Some of the step-up in productivity growth since 1995 can be traced to high levels of capital spending and an accompanying faster rate of increase in the amount of capital per worker. Beyond that, the causes are more difficult to pin down quantitatively but are apparently related to increased technological and organizational efficiencies. Firms are not only expanding the stock of capital but are also discovering many new uses for the technologies embodied in that capital, and workers are becoming more skilled at employing the new technologies.

Chart of Change in output per hour

The number of jobs on nonfarm payrolls rose slightly more than 2 percent from the end of 1998 to the end of 1999, a net increase of 2.7 million. Annual job gains had ranged between 2-1/4 percent and 2-3/4 percent over the 1996-98 period. Once again in 1999, the private service-producing sector accounted for most of the total rise in payroll employment, led by many of the same categories that had been strong in previous years--transportation and communications, computer services, engineering and management, recreation, and personnel supply. In the construction sector, employment growth remained quite brisk--more than 4 percent from the final quarter of 1998 to the final quarter of 1999. Manufacturing employment, influenced by spillover from the disruptions in foreign economies, continued to decline sharply in the first half of the year, but losses thereafter were small as factory production strengthened. Since the start of the expansion in 1991, the job count in manufacturing has changed little, on net, but with factory productivity rising rapidly, manufacturing output has trended up at a brisk pace.

Chart of Change in payroll employment

In 1999, employers continued to face a tight labor market. Some increase in the workforce came from the pool of the unemployed, and the jobless rate declined to an average of 4.1 percent in the fourth quarter. In January 2000, the rate edged down to 4.0 percent, the lowest monthly reading since the start of the 1970s. Because the unemployment rate is a reflection only of the number of persons who are available for work and actively looking, it does not capture potential labor supply that is one step removed--namely those individuals who are interested in working but are not actively seeking work at the current time. However, like the unemployment rate itself, an augmented rate that includes these interested nonparticipants also has declined to a low level, as more individuals have taken advantage of expanding opportunities to work.

Chart of Measures of labor utilization

Although the supply-demand balance in the labor market tightened further in 1999, the added pressure did not translate into bigger increases in nominal hourly compensation. The employment cost index for hourly compensation of workers in private nonfarm industries rose 3.4 percent in nominal terms during 1999, little changed from the increase of the previous year, and an alternative measure of hourly compensation from the nonfarm productivity and cost data slowed from a 5-1/4 percent increase in 1998 to a 4-1/2 percent rise this past year. Compensation gains in 1999 probably were influenced, in part, by the very low inflation rate of 1998, which resulted in unexpectedly large increases in inflation-adjusted pay in that year and probably damped wage increments last year. According to the employment cost index, the hourly wages of workers in private industry rose 3-1/2 percent in nominal terms after having increased about 4 percent in each of the two previous years. The hourly cost to employers of the nonwage benefits provided to employees also rose 3-1/2 percent in 1999, but this increase was considerably larger than those of the past few years. Much of the pickup in benefit costs came from a faster rate of rise in the costs of health insurance, which were reportedly driven up by several factors: a moderate acceleration in the price of medical care, the efforts of some insurers to rebuild profit margins, and the recognition by employers that an attractive health benefits package was helpful in hiring and retaining workers in a tight labor market.

Chart of Change in employment cost index

Because the employment cost index does not capture some forms of compensation that employers have been using more extensively--for example, stock options, signing bonuses, and employee price discounts on in-store purchases--it has likely been understating the true size of workers' gains. The productivity and cost measure of hourly compensation captures at least some of the labor costs that the employment cost index omits, and this broader coverage may explain why the productivity and cost measure has been rising faster. However, it, too, is affected by problems of measurement, some of which would lead to overstatement of the rate of rise in hourly compensation.

With the rise in output per hour in the nonfarm business sector in 1999 offsetting about three-fourths of the rise in the productivity and cost measure of nominal hourly compensation, nonfarm unit labor costs were up just a shade more than 1 percent. Unit labor costs had increased slightly more than 2 percent in both 1997 and 1998 and less than 1 percent in 1996. Because labor costs are by far the most important item in total unit costs, these small increases have been crucial to keeping inflation low.

Chart of Change in unit labor costs

Prices

Rates of increase in the broader measures of aggregate prices in 1999 were somewhat larger than those of 1998. The chain-type price index for GDP--which measures inflation for goods and services produced domestically--moved up about 1-1/2 percent, a pickup of 1/2 percentage point from the increase of 1998. In comparison, acceleration in various price measures for goods and services purchased amounted to 1 percentage point or more: The chain-type price index for personal consumption expenditures increased 2 percent, twice as much as in the previous year, and the chain-type price index for gross domestic purchases, which measures prices of the aggregate purchases of consumers, businesses, and governments, moved up close to 2 percent after an increase of just 3/4 percent in 1998. The consumer price index rose more than 2-1/2 percent over the four quarters of the year after having increased 1-1/2 percent in 1998.

3. Alternative measures of price change
Percent  
table rule
Price measure
1998
1999
Chain type
   
Gross domestic product
1.1 1.6
Gross domestic purchases
0.7 1.9
Personal consumption expenditures 1.0 2.0
    Excluding food and energy
1.4 1.5
Fixed weight
   
Consumer price index
1.5 2.6
    Excluding food and energy
2.3 2.0
table rule

          Note.  Changes are based on quarterly averages and are
measured to the fourth quarter of the year indicated from the
fourth quarter of the preceding year.
 

Chart of Change in consumer prices

The acceleration in the prices of goods and services purchased was driven in part by a reversal in import prices. In 1998, the chain-type price index for imports of goods and services had fallen 5 percent, but it rose 3 percent in 1999. A big swing in oil prices--down in 1998 but up sharply in 1999--accounted for a large part of this turnaround. Excluding oil, the prices of imported goods continued to fall in 1999 but, according to the initial estimate, less rapidly than over the three previous years, when downward pressure from appreciation of the dollar had been considerable. The prices of imported materials and supplies rebounded, but the prices of imported capital goods fell sharply further. Meanwhile, the chain-type price index for exports increased 1 percent in the latest year, reversing a portion of the 2-1/2 percent drop of 1998, when the sluggishness of foreign economies and the strength of the dollar had pressured U.S. producers to mark down the prices charged to foreign buyers.

Prices of domestically produced primary materials, which tend to be especially sensitive to developments in world markets, rebounded sharply in 1999. The producer price index for crude materials excluding food and energy advanced about 10 percent after having fallen about 15 percent in 1998, and the PPI for intermediate materials excluding food and energy increased about 1-1/2 percent, reversing a 1998 decline of about that same size. But further along in the chain of processing and distribution, the effects of these increases were not very visible. The producer price index for finished goods excluding food and energy rose slightly less rapidly in 1999 than in 1998, and the consumer price index for goods excluding food and energy rose at about the same low rate that it had in 1998. Large gains in productivity and a margin of excess capacity in the industrial sector helped keep prices of goods in check, even as growth of domestic demand remained exceptionally strong.

"Core" inflation at the consumer level--which takes account of the prices of services as well as the prices of goods and excludes food and energy prices--changed little in 1999. The increase in the core index for personal consumption expenditures, 1-1/2 percent over the four quarters of the year, was about the same as the increase in 1998. As measured by the CPI, core inflation was 2 percent this past year, about 1/4 percentage point lower than in 1998, but the deceleration was a reflection of a change in CPI methodology that had taken place at the start of last year; on a methodologically consistent basis, the rise in the core CPI was about the same in both years.

Chart of Change in consumer prices excluding food and energy

In the national accounts, the chain-type price index for private fixed investment edged up 1/4 percent in 1999 after having fallen about 3/4 percent in 1998. With construction costs rising, the index for residential investment increased 3-3/4 percent, its largest advance in several years. By contrast, the price index for nonresidential investment declined moderately, as a result of another drop in the index for equipment and software. Falling equipment prices are one channel through which faster productivity gains have been reshaping the economy in recent years; the drop in prices has contributed to high levels of investment, rapid expansion of the capital stock, and a step-up in the growth of potential output.

U.S. Financial Markets

Financial markets were somewhat unsettled as 1999 began, with the disruptions of the previous autumn still unwinding and the devaluation of the Brazilian real causing some jitters around mid-January. However, market conditions improved into the spring, evidenced in part by increased trading volumes and narrowed bid-asked and credit spreads, as it became increasingly evident that strong growth was continuing in the United States, and that economies abroad were rebounding. In this environment, market participants began to anticipate that the Federal Reserve would reverse the policy easings of the preceding fall, and interest rates rose. Nevertheless, improved profit expectations apparently more than offset the interest rate increases, and equity prices continued to climb until late spring. From May into the fall, both equity prices and longer-term interest rates moved in a choppy fashion, while short-term interest rates moved up with monetary policy tightenings in June, August, and November. Worries about Y2K became pronounced after midyear, and expectations of an acceleration of borrowing ahead of the fourth quarter prompted a resurgence in liquidity and credit premiums. In the closing months of the year, however, the likelihood of outsized demands for credit and liquidity over the year-end subsided, causing spreads to narrow, and stock prices surged once again. After the century date change passed without disruptions, liquidity improved and trading volumes grew, although both bond and equity prices have remained quite volatile so far this year.

Chart of Selected Treasury rates, daily data

Interest Rates

Over the first few months of 1999, short-term Treasury rates moved in a narrow range, anchored by an unchanged stance of monetary policy. Yields on intermediate- and long-term Treasury securities rose, however, as the flight to quality and liquidity of the preceding fall unwound, and incoming data pointed to continued robust economic growth and likely Federal Reserve tightening. Over most of the rest of the year, short-term Treasury rates moved broadly in line with the three quarter-point increases in the target federal funds rate; longer-term yields rose less, as markets had already anticipated some of those policy actions.

Chart of Selected Treasury rates, quarterly data

Bond and note yields moved sharply higher from early November 1999 to mid-January 2000, as Y2K fears diminished, incoming data indicated surprising economic vitality, and the century date change was negotiated without significant technical problems. In recent weeks, long-term Treasury yields have retraced a good portion of that rise on expectations of reduced supply stemming from the Treasury's new buyback program and reductions in the amount of bonds to be auctioned. This rally has been mostly confined to the long end of the Treasury market; long-term corporate bond yields have fallen only slightly, and yields are largely unchanged or have risen a little further at maturities of ten years or less, where most private borrowing is concentrated.

Concerns about liquidity and credit risk around the century date change led to large premiums in private money market rates in the second half of 1999. During the summer, this "safe haven" demand held down rates on Treasury bills maturing early in the new year, until the announcement in August that the Treasury was targeting an unusually large year-end cash balance, implying that it would issue a substantial volume of January-dated cash management bills. Year-end premiums in eurodollar, commercial paper, term federal funds, and other money markets--measured as the implied forward rate for a monthlong period spanning the turn relative to the rate for a neighboring period--rose earlier and reached much higher levels than in recent years.

Chart of Eurodollar deposit forward premium over year-end

Those year-end premiums peaked in late October and then declined substantially, as markets reflected increased confidence in technical readiness and special assurances from central banks that sufficient liquidity would be available around the century date change. Important among these assurances were several of the Federal Reserve initiatives described in the first section of this report. Securities dealers took particular advantage of the widened pools of acceptable collateral for open market operations and used large volumes of federal agency debt and mortgage-backed securities in repurchase agreements with the Open Market Desk in the closing weeks of the year, which helped to relieve a potential scarcity of Treasury collateral over the turn. Market participants also purchased options on nearly $500 billion worth of repurchase agreements under the standby financing facility and pledged more than $650 billion of collateral for borrowing at the discount window. With the smooth rollover, however, none of the RP options were exercised, and borrowing at the discount window turned out to be fairly light.

Equity Prices

Nearly all major stock indexes ended 1999 in record territory. The Nasdaq composite index paced the advance by soaring 86 percent over the year, and the S&P 500 and Dow Jones Industrial Average posted still-impressive gains of 20 percent and 25 percent. Last year was the fifth consecutive year that all three indexes posted double-digit returns. Most stock indexes moved up sharply over the first few months of the year and were about flat on net from May through August; they then declined into October before surging in the final months of the year. The Nasdaq index, in particular, achieved most of its annual gains in November and December. Stock price advances in 1999 were not very broad-based, however: More than half of the S&P 500 issues lost value over the year. So far in 2000, stock prices have been volatile and mixed; major indexes currently span a range from the Dow's nearly 10 percent drop to the Nasdaq's 8 percent advance.

Chart of Major stock price indexes

Almost all key industry groups performed well. One exception was shares of financial firms, which were flat, on balance. Investor perceptions that rising interest rates would hurt earnings and, possibly, concern over loan quality apparently offset the boost resulting from passage in the fall of legislation reforming the depression-era Glass-Steagall constraints on combining commercial banking with insurance and investment banking. Small-cap stocks, which had lagged in 1998, also performed well; the Russell 2000 index climbed 20 percent over the year and finally surpassed its April 1998 peak in late December.

Chart of  Equity valuation and long-term interest rate

At large firms, stock price gains about kept pace with expected earnings growth in 1999, and the S&P 500 one-year-ahead earnings-price ratio fluctuated around the historically low level of 4 percent even as real interest rates rose. Meanwhile, the Nasdaq composite index's earnings-price ratio (using actual twelve-month trailing earnings) plummeted from an already-slim 1-1/4 percent to 1/2 percent, suggesting that investors are pricing in expectations of tremendous earnings growth at technology firms relative to historical norms.

Debt and the Monetary Aggregates

Debt and Depository Intermediation

The debt of domestic nonfinancial sectors is estimated to have grown 6-1/2 percent in 1999 on a fourth-quarter-to-fourth-quarter basis, near the upper end of the FOMC's 3 percent to 7 percent range and about a percentage point faster than nominal GDP. As was the case in 1998, robust outlays on consumer durable goods, housing, and business investment, as well as substantial net equity retirements, helped sustain nonfederal sector debt growth at rates above 9 percent. Meanwhile, the dramatically increased federal budget surplus allowed the Treasury to reduce its outstanding debt about 2 percent. These movements follow the pattern of recent years whereby increases in the debt of households, businesses, and state and local governments relative to GDP have come close to matching declines in the federal government share, consistent with reduced pressure on available savings from the federal sector facilitating private borrowing.

Chart of Domestic nonfinancial debt: Annual range and actual level

Chart of Domestic nonfinancial debt as a percentage of nominal GDP

After increasing for several years, the share of total credit accounted for by depository institutions leveled out in 1999. Growth in credit extended by those institutions edged down to 6-1/2 percent from 6-3/4 percent in 1998. Adjusted for mark-to-market accounting rules, bank credit growth retreated from 10-1/4 percent in 1998 to 5-1/2 percent last year, with a considerable portion of the slowdown attributable to an unwinding of the surge in holdings of non-U.S. government securities, business loans, and security loans that had been built up during the market disruptions in the fall of 1998. Real estate loans constituted one of the few categories of bank credit that accelerated in 1999. By contrast, thrift credit swelled 9 percent, up from a 4-1/2 percent gain in 1998, as rising mortgage interest rates led borrowers to opt more frequently for adjustable-rate mortgages, which thrifts tend to keep on their books. The trend toward securitization of consumer loans continued in 1999: Bank originations of consumer loans were up about 5 percent, while holdings ran off at a 1-3/4 percent pace.

The Monetary Aggregates

Growth of the broad monetary aggregates moderated significantly last year. Nevertheless, as was expected by the FOMC last February and July, both M2 and M3 finished the year above their annual price-stability ranges. M3 rose 7-1/2 percent in 1999, somewhat outside the Committee's range of 2 percent to 6 percent but far below the nearly 11 percent pace of 1998. M3 growth retreated early in 1999, as the surge in depository credit in the final quarter of 1998 unwound and depository institutions curbed their issuance of the managed liabilities included in that aggregate. At that time, the expansion of institution-only money funds also slowed with the ebbing of heightened preferences for liquid assets. However, M3 bulged again in the fourth quarter of 1999, as loan growth picked up and banks funded the increase mainly with large time deposits and other managed liabilities in M3. U.S. branches and agencies of foreign banks stepped up issuance of large certificates of deposit, in part to augment the liquidity of their head offices over the century date change, apparently because it was cheaper to fund in U.S. markets. Domestic banks needed the additional funding because of strong loan growth and a buildup in vault cash for Y2K contingencies. Corporations apparently built up year-end precautionary liquidity in institution-only money funds, which provided a further boost to M3 late in the year. Early in 2000, these effects began to unwind.

4. Growth of money and debt
Percent  
Chart of table rule
Period
M1
M2
M3
Domestic
nonfinancial
debt
Annual 1     
  1989   0.6   5.2   4.1   7.4
      
  1990   4.2   4.2   1.9   6.7
  1991   7.9   3.1   1.1   4.5
  1992 14.4   1.8   0.6   4.5
  1993 10.6   1.4   1.0   4.9
  1994   2.5   0.6   1.7   4.9
      
  1995 -1.5   3.9   6.1   5.5
  1996 -4.5   4.5   6.8  5.4
  1997 -1.2   5.6   8.9   5.2
  1998   2.2   8.5 10.9   6.7
  1999   1.9   6.2   7.5   6.6
      
Quarterly
(annual rate)
 2
    
  1999    Q1   1.9   7.5   8.2   6.7
              Q2   2.2   6.0   6.0   6.9
              Q3 -2.0   5.5   5.1   6.0
              Q4   5.3   5.4 10.0   6.2
Chart of table rule

          Note.  M1 consists of currency, travelers checks,
demand deposits, and other checkable deposits. M2 consists
of M1 plus savings deposits (including money market deposit
accounts), small-denomination time deposits, and balances
in retail money market funds. M3 consists of M2 plus
large-denomination time deposits, balances in institutional
money market funds, RP liabilities (overnight and term),
and eurodollars (overnight and term). Debt consists of the
outstanding credit market debt of the U.S. government,
state and local governments, households and nonprofit
organizations, nonfinancial businesses, and farms.
          1.  From average for fourth quarter of preceding
year to average for fourth quarter of year indicated.
          2.  From average for preceding quarter to average
for quarter indicated.


Chart of M3: Annual range and actual level

M2 increased 6-1/4 percent in 1999, somewhat above the FOMC's range of 1 percent to 5 percent. Both the easing of elevated demands for liquid assets that had boosted M2 in the fourth quarter of 1998 and a rise in its opportunity cost (the difference between interest rates on short-term market instruments and the rates available on M2 assets) tended to bring down M2 growth in 1999. That rise in opportunity cost also helped to halt the decline in M2 velocity that had begun in mid-1997, although the 1-3/4 percent (annual rate) rise in velocity over the second half of 1999 was not enough to offset the drop in the first half of the year. Within M2, currency demand grew briskly over the year as a whole, reflecting booming retail sales and, late in the year, some precautionary buildup for Y2K. Money stock currency grew at an annualized rate of 28 percent in December and then ran off in the weeks after the turn of the year.

In anticipation of a surge in the public's demand for currency, depository institutions vastly expanded their holdings of vault cash, beginning in the fall to avoid potential constraints in the ability of the armored car industry to accommodate large currency shipments late in the year. Depositories' cash drawings reduced their Federal Reserve balances and drained substantial volumes of reserves, and, in mid-December, large precautionary increases in the Treasury's cash balance and in foreign central banks' liquid investments at the Federal Reserve did as well. The magnitude of these flows was largely anticipated by the System, and, to replace the lost reserves, during the fourth quarter the Desk entered into a number of longer-maturity repurchase agreements timed to mature early in 2000. The Desk also executed a large number of short-term repurchase transactions for over the turn of the year, including some in the forward market, to provide sufficient reserves and support market liquidity.

Chart of M2: Annual range and actual level

Chart of M2 velocity and the opportunity cost of holding M2

The public's demand for currency through year-end, though appreciable, remained well below the level for which the banking system was prepared, and vault cash at the beginning of January stood about $38 billion above its year-ago level. This excess vault cash, and other century date change effects in money and reserve markets, unwound quickly after the smooth transition into the new year.

International Developments

Global economic conditions improved in 1999 after a year of depressed growth and heightened financial market instability. Financial markets in developing countries, which had been hit hard by crises in Asia and Russia in recent years, recovered last year. The pace of activity in developing countries increased, with Asian emerging-market economies in particular bouncing back strongly from the output declines of the preceding year. Real growth improved in almost all the major industrial economies as well. This strengthening of activity contributed to a general rise in equity prices and a widespread increase in interest rates. Despite stronger activity and higher prices for oil and other commodities, average foreign inflation was lower in 1999 than in 1998, as output remained below potential in most countries.

Although the general theme in emerging financial markets in 1999 was a return to stability, the year began with heightened tension as a result of a financial crisis in Brazil. With the effects of the August 1998 collapse of the ruble and the default on Russian government debt still reverberating, Brazil was forced to abandon its exchange-rate-based stabilization program in January 1999. The real, allowed to float, soon fell nearly 50 percent against the dollar, generating fears of a depreciation-inflation spiral that could return Brazil to its high-inflation past. In addition, there were concerns that the government might default on its domestic-currency and dollar-indexed debt, the latter totaling more than $50 billion. In the event, these fears proved unfounded. The turning point appears to have come in March when a new central bank governor announced that fighting inflation was a top priority and interest rates were substantially raised to support the real. Over the remainder of the year, Brazilian financial markets stabilized on balance, despite continuing concerns about the government's ability to reduce the fiscal deficit. Inflation, although accelerating from the previous year, remained under 10 percent. Brazilian economic activity also recovered somewhat in 1999, after declining in 1998, as the return of confidence allowed officials to lower short-term interest rates substantially from their crisis-related peak levels of early in the year.

The Brazilian crisis triggered some renewed financial stress in other Latin American economies, and domestic interest rates and Brady bond yield spreads increased sharply from levels already elevated by the Russian crisis. However, as the situation in Brazil improved, financial conditions in the rest of the region stabilized relatively rapidly. Even so, the combination of elevated risk premiums and diminished access to international credit markets tended to depress activity in much of the region in the first half of 1999. Probably the most strongly affected was Argentina, where the exchange rate peg to the dollar was maintained only at the cost of continued high real interest rates that contributed to the decline in real GDP in 1999. In contrast, real GDP in Mexico rose an estimated 6 percent in 1999, aided by higher oil prices and strong export growth to the United States. The peso appreciated against the dollar for the year as a whole, despite a Mexican inflation rate about 10 percentage points higher than in the United States.

The recovery of activity last year in Asian developing countries was earlier, more widespread, and sharper than in Latin America, just as the downturn had been the previous year. After a steep drop in activity in the immediate wake of the financial crises that hit several Asian emerging-market economies in late 1997, the preconditions for a revival in activity were set by measures initiated to stabilize shaky financial markets and banking sectors, often in conjunction with International Monetary Fund programs that provided financial support. Once financial conditions had been stabilized, monetary policies turned accommodative in 1998, and this stimulus, along with the shift toward fiscal deficits and an ongoing boost to net exports provided by the sharp depreciations of their currencies, laid the foundation for last year's strong revival in activity. Korea's recovery was the most robust, with real GDP estimated to have increased more than 10 percent in 1999 after falling 5 percent the previous year. The government continued to make progress toward needed financial and corporate sector reform. However, significant weaknesses remained, as evidenced by the near collapse of Daewoo, Korea's second largest conglomerate. Other Asian developing countries that experienced financial difficulties in late 1997 (Thailand, Malaysia, Indonesia, and the Philippines) also recorded increases in real GDP in 1999 after declines the previous year. Indonesian financial markets were buffeted severely at times during 1999 by concerns about political instability, but the rupiah ended the year with a modest net appreciation against the dollar. The other former crisis countries also saw their currencies stabilize or slightly appreciate against the dollar. Inflation rates in these countries generally declined, despite the pickup in activity and higher prices for oil and other commodities. Inflation was held down by the elevated, if diminishing, levels of excess capacity and unemployment and by a waning of the inflationary impact of previous exchange rate depreciations.

In China, real growth slowed moderately in 1999. Given China's exchange rate peg to the dollar, the sizable depreciations elsewhere in Asia in 1997 and 1998 led to a sharp appreciation of China's real effective exchange rate, and there was speculation last year that the renminbi might be devalued. However, with China's trade balance continuing in substantial, though reduced, surplus, Chinese officials maintained the exchange rate peg to the dollar last year and stated their intention of extending it through at least this year. After the onset of the Asian financial crisis, continuance of Hong Kong's currency-board-maintained peg to the U.S. dollar was also questioned. In the event, the tie to the dollar was sustained, but only at the cost of high real interest rates, which contributed to a decrease in output in Hong Kong in 1998 and early 1999 and a decline of consumer prices over this period. However, real GDP started to move up again later in the year, reflecting in part the strong revival of activity in the rest of Asia.

In Russia, economic activity increased last year despite persistent and severe structural problems. Real GDP, which had dropped nearly 10 percent in 1998 as a result of the domestic financial crisis, recovered about half the loss last year. Net exports rose strongly, boosted by the lagged effect of the substantial real depreciation of the ruble in late 1998 and by higher oil prices. The inflation rate moderated to about 50 percent, somewhat greater than the depreciation of the ruble over the course of the year.

The dollar's average foreign exchange value, measured on a trade-weighted basis against the currencies of a broad group of important U.S. trading partners, ended 1999 little changed from its level at the beginning of the year. There appeared to be two main, roughly offsetting, pressures on the dollar last year. On the one hand, the continued very strong growth of the U.S. economy relative to foreign economies tended to support the dollar. On the other hand, the further rise in U.S. external deficits--with the U.S. current account deficit moving up toward 4 percent of GDP by the end of the year--may have tended to hold down the dollar because of investor concerns that the associated strong net demand for dollar assets might prove unsustainable. So far this year, the dollar's average exchange value has increased slightly, boosted by new evidence of strong U.S. growth. Against the currencies of the major foreign industrial countries, the dollar's most notable movements in 1999 were a substantial depreciation against the Japanese yen and a significant appreciation relative to the euro.

Chart of Nominal dollar exchange rate indexes

The dollar depreciated 10 percent on balance against the yen over the course of 1999. In the first half of the year, the dollar strengthened slightly relative to the yen, as growth in Japan appeared to remain sluggish and Japanese monetary authorities reduced short-term interest rates to near zero in an effort to jumpstart the economy. However, around mid-year, several signs of a revival of activity--particularly the announcement of unanticipated strong growth in real GDP in the first quarter--triggered a depreciation of the dollar relative to the yen amid reports of large inflows of foreign capital into the Japanese stock market. Data releases showing that the U.S. current account deficit had reached record levels in both the second and third quarters of the year also appeared to be associated with depreciations of the dollar against the yen. Concerned that a stronger yen could harm the fledgling recovery, Japanese monetary authorities intervened heavily to weaken the yen on numerous occasions. So far this year, the dollar has firmed about 7 percent against the yen. Japanese real GDP increased somewhat in 1999, following two consecutive years of decline. Growth was concentrated in the first half of the year, when domestic demand surged, led by fiscal stimulus. Later in the year, domestic demand slumped, as the pace of fiscal expansion flagged. Net exports made virtually no contribution to growth for the year as a whole. Japanese consumer prices declined slightly on balance over the course of the year.

Chart of U.S. dollar exchange rate against the Japanese yen and the euro

The new European currency, the euro, came into operation at the start of 1999, marking the beginning of stage three of European economic and monetary union. The rates of exchange between the euro and the currencies of the eleven countries adopting the new currency were set at the end of 1998; based on these rates, the value of the euro at its creation was just under $1.17. From a technical perspective, the introduction of the euro went smoothly, and on its first day of trading its value moved higher. However, the euro soon started to weaken against the dollar, influenced by indications that euro-area growth would remain very slow. After approaching parity with the dollar in early July, the euro rebounded, partly on gathering signs of European recovery. However, the currency weakened again in the fall, and in early December it reached parity with the dollar, about where it closed the year. The euro's weakness late in the year was attributed in part to concerns about the pace of market-oriented structural reforms in continental Europe and to a political wrangle over the proposed imposition of a withholding tax on investment income. On balance, the dollar appreciated 16 percent relative to the euro over 1999. So far this year, the dollar has strengthened 2 percent further against the euro. Although the euro's foreign exchange value weakened in its first year of operation, the volume of euro-denominated transactions--particularly the issuance of debt securities--expanded rapidly.

In the eleven European countries that now fix their currencies to the euro, real GDP growth remained weak early in 1999 but strengthened subsequently and averaged an estimated 3 percent rate for the year as a whole. Net exports made a significant positive contribution to growth, supported by a revival of demand in Asia and Eastern Europe and by the effects of the euro's depreciation. The areawide unemployment rate declined, albeit to a still-high rate of nearly 10 percent. In the spring, the European central bank lowered its policy rate 50 basis points, to 2-1/2 percent. This decline was reversed later in the year in reaction to accumulating evidence of a pickup in activity, and the rate was raised an additional 25 basis points earlier this month. The euro-area inflation rate edged up in 1999, boosted by higher oil prices, but still remained below the 2 percent target ceiling.

Growth in the United Kingdom also moved higher on balance in 1999, with growth picking up over the course of the year. Along with the strengthening of global demand, the recovery was stimulated by a series of official interest rate reductions, totaling 250 basis points, undertaken by the Bank of England over the last half of 1998 and the first half of 1999. Later in 1999 and early this year, the policy rate was raised four times for a total of 100 basis points, with officials citing the need to keep inflation below its 2-1/2 percent target level in light of the strength of consumption and the housing market and continuing tight conditions in the labor market. On balance, the dollar appreciated slightly against the pound over the course of 1999.

In Canada, real growth recovered in 1999 after slumping the previous year in response to the global slowdown and the related drop in the prices of Canadian commodity exports. Last year, strong demand from the United States spurred Canadian exports while rising consumer and business confidence supported domestic demand. In the spring, the Bank of Canada lowered its official interest rate twice for a total of 50 basis points in an effort to stimulate activity in the context of a rising Canadian dollar. This decline was reversed by 25-basis-point increases near the end of the year and earlier this month, as Canadian inflation moved above the midpoint of its target range, the pace of output growth increased, and U.S. interest rates moved higher. Over the course of 1999, the U.S. dollar depreciated 6 percent on balance against the Canadian dollar.

Concerns about liquidity and credit risk related to the century date change generated a temporary bulge in year-end premiums in money market rates in the second half of the year in some countries. For the euro, borrowing costs for short-term interbank funding over the year changeover--as measured by the interest rate implied by the forward market for a one-month loan spanning the year-end relative to the rates for neighboring months--started to rise in late summer but then reversed nearly all of this increase in late October and early November before moving up more moderately in December. The sharp October-November decline in the year-changeover funding premium came in response to a series of announcements by major central banks that outlined and clarified the measures these institutions were prepared to undertake to alleviate potential liquidity problems related to the century date change. For yen funding, the century date change premium moved in a different pattern, fluctuating around a relatively low level before spiking sharply for several days just before the year-end. The late-December jump in the yen funding premium was partly in response to date change-related illiquidity in the Japanese government bond repo market that emerged in early December and persisted into early January. To counter these conditions, toward the end of the year the Bank of Japan infused huge amounts of liquidity into its domestic banking system, which soon brought short-term yen funding costs back down to near zero.

Chart of Forward premium for deposits over year-end

Bond yields in the major foreign industrial countries generally moved higher on balance in 1999. Long-term interest rates were boosted by mounting evidence that economic recovery was taking hold abroad and by rising expectations of monetary tightening in the United States and, later, in other industrial countries. Over the course of the year, long-term interest rates increased on balance by more than 100 basis points in nearly all the major industrial countries. The notable exception was Japan, where long-term rates were little changed.

Chart of Foreign long-term interest rates

Equity prices showed strong and widespread increases in 1999, as the pace of global activity quickened and the threat from emerging-market financial crises appeared to recede. In the industrial countries equity prices on average rose sharply, extending the general upward trend of recent years. The average percentage increase of equity prices in developing countries was even larger, as prices recovered from their crisis-related declines of the previous year. The fact that emerging Latin American and Asian equity markets outperformed those in industrial countries lends some support to the view that global investors increased their risk tolerance, especially during the last months of the year.

Chart of Foreign equity indexes

Oil prices increased dramatically during 1999, fully reversing the declines in the previous two years. The average spot price for West Texas intermediate, the U.S. benchmark crude, more than doubled, from around $12 per barrel at the beginning of the year to more than $26 per barrel in December. This rebound in oil prices was driven by a combination of strengthening world demand and constrained world supply. The strong U.S. economy, combined with a recovery of economic activity abroad and a somewhat more normal weather pattern, led to a 2 percent increase in world oil consumption. Oil production, on the other hand, declined 2 percent, primarily because of reduced supplies from OPEC and other key producers. Starting last spring, OPEC consistently held production near targeted levels, in marked contrast to the widespread lack of compliance that characterized earlier agreements. So far this year, oil prices have risen further on speculation over a possible extension of current OPEC production targets and the onset of unexpectedly cold weather in key consuming regions.

The price of gold fluctuated substantially in 1999. The price declined to near a twenty-year low of about $250 per ounce at mid-year as several central banks, including the Bank of England and the Swiss National Bank, announced plans to sell a sizable portion of their reserves. The September announcement that fifteen European central banks, including the two just mentioned, would limit their aggregate sales of bullion and curtail leasing activities, saw the price of gold briefly rise above $320 per ounce before turning down later in the year. Recently, the price has moved back up, to above $300 per ounce.


Section 1


Home | News and events | Monetary policy | February 2000 report
Accessibility | Contact Us
Last update: February 17, 2000, 10:00 AM