FRB: Monetary Policy Report to the Congress, July 18, 2001
The Federal Reserve Board eagle logo links to home page
Monetary Policy Report submitted to the Congress on July 18, 2001, pursuant to section 2B of the Federal Reserve Act


Section 2

ECONOMIC AND FINANCIAL DEVELOPMENTS IN 2001

Economic growth remained very slow in the first half of 2001 after having downshifted in the second half of 2000. Real gross domestic product rose at an annual rate of just 1-1/4 percent in the first quarter, about the same as in the fourth quarter, and appears to have posted at best a meager gain in the second quarter. Businesses have been working to correct the inventory imbalances that emerged in the second half of last year, which has led to sizable declines in manufacturing output, and capital spending has weakened appreciably. In contrast, household spending--especially for motor vehicles and houses--has held up well. Employment increased only modestly over the first three months of the year and turned down in the spring; the unemployment rate in June stood at 4-1/2 percent, 1/2 percentage point higher than in the fourth quarter of last year.

Change in real GDP. By percent, annual rate. Bar chart. Date range is 1995 to 2001:Q1. Change in real GDP begins at about 1 percent in the first half of 1995. It increases to about 5 percent in the first half of 1997, then decreases to about 3 percent in the first half of 1999. It increases to over 6 percent in the second half of 1999 before decreasing to about 1.5 percent in 2001:Q1. Note: Here and in the subsequent charts, except as noted, change is measured to the final quarter of the indicated period from the final quarter of the preceding period.

The inflation news early this year was not very favorable, as energy prices continued to soar and as measures of core inflation--which exclude food and energy--registered some pickup. More recently, however, energy prices have moved lower, and the monthly readings on core inflation have returned to more moderate rates. Moreover, apart from energy, prices at earlier stages of processing have been quiescent this year.

Change in PCE chain-type price index. By percent, annual rate. Bar chart with two series (total and excluding food and energy). Date range is 1995 to 2001:Q1. Both series generally move together. They start at about 2 percent in 1995, with total being slightly lower. They then decrease until 1998, when total is about 1 percent and excluding food and energy is about 1.5 percent. At this point, total increases to about 3 percent in 2001:Q1. Excluding food and energy remains at about 1.5 percent through 2000, but increases to about 2.5 percent in 2001:Q1. Note: Data are for personal consumption expenditures (PCE).

The Household Sector

Growth in household spending has slowed noticeably from the rapid pace of the past few years. Still, it was fairly well maintained in the first half of 2001 despite the weaker tenor of income, wealth, and consumer confidence, and the personal saving rate declined a bit further. A greater number of households encountered problems servicing debt, but widespread difficulties or restrictions on the availability of credit did not emerge.

Consumer Spending

Real consumer spending grew at an annual rate of 3-1/2 percent in the first quarter. Some of the increase reflected a rebound in purchases of light motor vehicles, which were boosted by a substantial expansion of incentives and rose to just a tad below the record pace of 2000 as a whole. In addition, outlays for non-auto goods posted a solid gain, and spending on services rose modestly despite a weather-related drop in outlays for energy services. In the second quarter, however, the rise in consumer spending seems to have lessened as sales of light motor vehicles dropped a bit, on average, and purchases of other goods apparently did not grow as fast in real terms as they had in the first quarter.

Change in real income and consumption. By percent, annual rate. Bar chart with two series (disposable personal income and personal consumption expenditures). Date range is 1995 to 2001:Q1. Both series generally move together. Disposable personal income starts at about 1 percent and personal consumption expenditures starts at about 3 percent. They then increase until early 1998 to about 6 percent. Disposable personal income decreases from 1998  to 2001 and ends at about 2 percent in 2001. Personal consumption expenditures starts to decrease by the second half of 1999 and ends at about 3 percent in 2001.

The rise in real consumption so far this year has been considerably smaller than the outsized gains in the second half of the 1990s and into 2000. But the increase in spending still outstripped the growth in real disposable personal income (DPI), which has been restrained this year by further big increases in consumer energy prices and by the deterioration in the job market; between the fourth quarter of 2000 and May, real DPI increased just about 2 percent at an annual rate, well below the average pace of the preceding few years. In addition, the net worth of households fell again in the first quarter, to a level 8 percent below the high reached in the first quarter of 2000. On net, the ratio of household net worth to DPI has returned to about the level reached in 1997, significantly below the recent peak but still high by historical standards. In addition, consumer sentiment indexes, which had risen to extraordinary levels in the late 1990s and remained there through last fall, fell sharply around the turn of the year. However, these indexes have not deteriorated further, on net, since the winter and are still at reasonably favorable levels when compared with the readings for the pre-1997 period.

Rising household wealth almost certainly was a key factor behind the surge in consumer spending between the mid-1990s and last year, and thus helps to explain the sharp fall in the personal saving rate over that period. The saving rate has continued to fall this year--from -0.7 percent in the fourth quarter of 2000 to -1.1 percent in May--even though the boost to spending growth from the earlier run-up in stock prices has likely run its course and the effects of lower wealth should be starting to feed through to spending. The apparent decline in the saving rate may simply reflect noisiness in the data or a slower response of spending to wealth than average historical experience might suggest. In addition, consumers probably base their spending decisions on income prospects over a longer time span than just a few quarters. Thus, to the extent that consumers do not expect the current sluggishness in real income growth to persist, the tendency to maintain spending for a time by dipping into savings or by borrowing may have offset the effect of the decline in wealth on the saving rate.

Wealth and saving. Two line charts, both covering the date range of 1978 to 2001. The first chart is wealth-to-income ratio. It starts at a ratio of about 4.25 in 1978, increases to a little over 6 in 2000, then decreases to about 5.5 percent in 2001. The second chart is personal saving rate, measured by percent. It starts at about 9 percent in 1978, fluctuating between about 6 and 12 percent until 1992 when it begins to decrease, ending at about negative 1 percent in 2001. Note: The data extend through 2001:Q1. The wealth-to-income ratio is the ratio of household net worth to disposable personal income.

Residential Investment

Housing activity remained buoyant in the first half of this year as lower mortgage interest rates appear to have offset the restraint from smaller gains in employment and income and from lower levels of wealth. In the single-family sector, starts averaged an annual rate of 1.28 million units over the first five months of the year--4 percent greater than the hefty pace for 2000 as a whole. Sales of new and existing homes strengthened noticeably around the turn of the year and were near record levels in March; they fell back in April but reversed some of that drop in May. Inventories of new homes for sale are exceptionally low; builders' backlogs are sizable; and, according to the Michigan survey, consumers' assessments of homebuying conditions remain favorable, mainly because of perceptions that mortgage rates are low.

Private Housing starts. In millions of units, annual rate. Line chart with two series (single-family and multifamily). Date range is 1988 to 2001. Single-family starts at about 1.1 million in 1988. It decreases to about .7 million in early 1991. It then increases to about 1.3 million in the middle of 2001. Multifamily starts at about .4 million in 1988. It decreases to about .1 million in early 1993, and then rises to about .35 million in 2001. Note: The data extend through 2001:Q2; the data for that quarter are the averages for April and May.

Likely because of the sustained strength of housing demand, home prices have continued to rise faster than overall inflation, although the various measures that attempt to control for shifts in the regional composition of sales and in the characteristics of houses sold provide differing signals on the magnitude of the price increases. Notably, over the year ending in the first quarter, the constant-quality price index for new homes rose 4 percent, while the repeat-sales price index for existing homes was up nearly 9 percent. Despite the higher prices, the share of income required to finance a home purchase--one measure of affordability--has fallen in recent quarters as mortgage rates have dropped back after last year's bulge, and that share currently is about as low as it has been at any time in the past decade. Rates on thirty-year conventional fixed-rate loans now stand around 7-1/4 percent, and ARM rates are at their lowest levels in a couple of years.

Mortgage rates. In percent. Line chart with two series (fixed rate and adjustable rate). Date range is 1999 to June 2001. Fixed rate starts in 1999 at about 6.7 percent. It increases to about 8.5 percent by the middle of 2000. Fixed rate ends at about 7.2 percent in June 2001. Adjustable rate starts at about 5.5 percent in early 1999 and increases to about 7.2 percent by mid-2000. In the beginning of 2001 it starts to decrease and ends at about 5.5 percent in June. Note: The data, which are monthly and extend through June 2001, are contract rates on thirty-year mortgages from the Federal Home Loan Mortgage Corporation.

In the multifamily sector, housing starts averaged 343,000 units at an annual rate over the first five months of the year, matching the robust pace that has been evident since 1997. Moreover, conditions in the market for multifamily housing continue to be conducive to new construction. The vacancy rate for multifamily rental units in the first quarter held near its low year-earlier level, and rents and property values continued to rise rapidly.

Household Finance

The growth of household debt is estimated to have slowed somewhat in the first half of this year to a still fairly hefty 7-1/2 percent annual rate--about a percentage point below its average pace over the previous two years. Households have increased both their home mortgage debt and their consumer credit (debt not secured by real estate) substantially this year, although in both cases the growth has moderated a bit recently. The relatively low mortgage interest rates have boosted mortgage borrowing both by stimulating home purchases and by making it attractive to refinance existing mortgages and extract some of the buildup in home equity. The rapid growth in consumer credit has been concentrated in credit card debt, perhaps reflecting households' efforts to sustain their consumption in the face of weaker income growth.

The household debt service burden--the ratio of minimum scheduled payments on mortgage and consumer debt to disposable personal income--rose to more than 14 percent at the end of the first quarter, a twenty-year high, and available data suggest a similar reading for the second quarter. In part because of the elevated debt burden, some measures of household loan performance have deteriorated a bit in recent quarters. The delinquency rate on home mortgage loans has edged up but remains low, while the delinquency rate on credit card loans has risen noticeably and is in the middle part of its range over the past decade. Personal bankruptcies jumped to record levels in the spring, but some of the spurt was probably the result of a rush to file before Congress passed bankruptcy reform legislation.

Household debt service burden. By percent. Date range is 1985 to 2001. As shown in the figure, the series begins at about 13.35 percent in the beginning of 1985. It increases to about 14.3 percent by the second half of 1986. From 1987 to 1993 it decreases to about 11.8 percent. Then it increases and ends at about 14.3 percent in 2001. Note: The data are quarterly and extend through 2001:Q1. Debt burden is an estimate of the ratio of debt payments to disposable income; debt payments consist of the estimated required payments on outstanding mortgage and consumer debt.

Delinquency rates on household loans. In percent. Line chart with three series (credit card accounts at banks, auto loans at domestic auto finance companies, and mortgages). Date range is 1988 to 2000. As shown in the figure, credit card accounts at banks begins at about 5.1 percent in early 1991, generally decreases to about 3.25 percent in 1994, then generally increases to about 4.5 percent by 1997, and ends at about 4.75 percent by late 2000. Auto loans at domestic auto finance companies begins at about 2.1 percent, fluctuates between 2 and 2.5 percent through 1994, generally increases to about 3.5 percent by 1997, and then decreases to end at about 2.2 percent by late 2000. Mortgages begins at about 1.75 percent in early 1988, fluctuates between 1 and 1.75 percent, and ends at about 1.4 percent by late 2000.
Note: The data are quarterly and extend through 2001:Q1. Data on credit card delinquencies are from bank Call Reports; data on auto loan delinquencies are from the Big Three automakers; data on mortgage delinquencies are from the Mortgage Bankers Association.

Lenders have tightened up somewhat in response to the deterioration of household financial conditions. In the May Senior Loan Officer Opinion Survey on Bank Lending Practices, about a fifth of the banks indicated that they had tightened the standards for approving applications for consumer loans over the preceding three months, and about a fourth said that they had tightened the terms on loans they are willing to make, substantial increases from the November survey. Of those that had tightened, most cited actual or anticipated increases in delinquency rates as a reason.

Net percentage of large commercial banks tightening standards for consumer loans. By percent.  There are two series (credit cards and other consumer loans). Date range is 1996 to 2001. Credit cards starts at about 25 percent and increases to about 49 percent by the middle of 1996.. It then decreases to about negative 2 percent by mid-2000 and starts to increase in the middle of 2000 to end at about 20 percent. Other consumer loans starts at about 16 percent. In the middle of 1996 it increases to about 24 percent. From 1997 to 2000 credit cards fluctuates between about 24 percent and 4 percent. It starts to increase in the middle of 2000 and ends at about 19 percent. Note: The data extend through May 2001 and are based on the Federal Reserve's Senior Loan Officer Opinion Survey on Bank Lending Practices, which is generally conducted four times per year. Net percentage is percentage reporting a tightening less percentage reporting an easing.

The Business Sector

The boom in capital spending that has helped fuel the economic expansion came to a halt late last year. After having risen at double-digit rates over the preceding five years, real business fixed investment flattened out in the fourth quarter of 2000 and rose only a little in the first quarter of 2001. Demand for capital equipment has slackened appreciably, reflecting the sluggish economy, sharply lower corporate profits and cash flow, earlier overinvestment in some sectors, and tight financing conditions facing some firms. In addition, inventory investment fell substantially in the first quarter as businesses moved to address the overhangs that began to develop late last year. With investment spending weakening, businesses have cut back on new borrowing. Following the drop in longer-term interest rates in the last few months of 2000, credit demands have been concentrated in longer-term markets, though cautious investors have required high spreads from marginal borrowers.

Fixed Investment

Real spending on equipment and software (E&S) began to soften in the second half of last year, and it posted small declines in both the fourth quarter of 2000 and the first quarter of 2001. Much of the weakness in the first quarter was in spending on high-tech equipment and software; such spending, which now accounts for about half of E&S outlays when measured in nominal terms, declined at an annual rate of about 12 percent in real terms--the first real quarterly drop since the 1990 recession. An especially sharp decrease in outlays for communications equipment reflected the excess capacity that had emerged as a result of the earlier surge in spending, the subsequent re-evaluation of profitability, and the accompanying financing difficulties faced by some firms. In addition, real spending on computers and peripheral equipment, which rose more than 40 percent per year in the second half of the 1990s, showed little growth, on net, between the third quarter of 2000 and the first quarter of 2001. The leveling in real computer spending reportedly reflects some stretching out of businesses' replacement cycles for personal computers as well as a reduced demand for servers. Outside the high-tech area, spending rose in the first quarter as purchases of motor vehicles reversed some of the decline recorded over the second half of 2000 and as outlays for industrial equipment picked up after having been flat in the fourth quarter.

Change in real business fixed investment. By percent, annual rate. Bar chart with two series (structures and equipment and software). Date range is 1995 to 2001:Q1. Structures starts at about 8 percent in the first half of 1995. It generally fluctuates within the range of 8 to 15 percent, except for the following. In the second half of 1995, it is about 0 percent. In the first half of 1997, it is about 2 percent. From the second half of 1998 to the second half of 1999, it fluctuates between about negative 5 and 2 percent. It ends in 2001:Q1 at about 16 percent. Equipment and software starts at about 10 percent. It generally increases to about 20 percent in the first half of 1998. It decreases to about 12 percent in the second half of 1998, then increases to about 20 percent by the first half of 2000. It then decreases to end at about negative 3 percent in 2001:Q1.

Real E&S spending likely dropped further in the second quarter. In addition to the ongoing contraction in outlays on high-tech equipment, the incoming data for orders and shipments point to a decline in investment in non-high-tech equipment, largely reflecting the weakness in the manufacturing sector this year.

Outlays on nonresidential construction posted another sizable advance in early 2001 after having expanded nearly 13 percent in real terms in 2000, but the incoming monthly construction data imply a sharp retrenchment in the second quarter. The downturn in spending comes on the heels of an increase in vacancy rates for office and industrial space in many cities. Moreover, while financing generally remains available for projects with viable tenants, lenders are now showing greater caution. Not surprisingly, one bright spot is the energy sector, where expenditures for drilling and mining have been on a steep uptrend since early 1999 (mainly because of increased exploration for natural gas) and the construction of facilities for electric power generation remains very strong.

Inventory Investment

A sharp reduction in the pace of inventory investment was a major damping influence on real GDP growth in the first quarter of 2001. The swing in real nonfarm inventory investment from an accumulation of $51 billion at an annual rate in the fourth quarter of 2000 to a liquidation of $25 billion in the first quarter of 2001 subtracted 3 percentage points from the growth in real GDP in the first quarter. Nearly half of the negative contribution to GDP growth came from the motor vehicle sector, where a sizable cut in assemblies (added to the reduction already in place in the fourth quarter) brought the overall days' supply down to comfortable levels by the end of the first quarter. A rise in truck assemblies early in the second quarter led to some backup of inventories in that segment of the market, but truck stocks were back in an acceptable range by June; automobile assemblies were up only a little in the second quarter, and stocks remained lean.

Change in real nonfarm business inventories. In billions of chained 1996 dollars, annual rate. Bar chart. Date range is 1995 to 2001:Q1. Change in real nonfarm business inventories begins at about 40 in 1995. It decreases to about 20 in 1996, then increases to about 75 in 1998. Then decreases and ends at about negative 25 in 2001:Q1.

Firms outside the motor vehicles industry also moved aggressively to address inventory imbalances in the first half of the year, and this showed through to manufacturing output, which, excluding motor vehicles, fell at an annual rate of 7-1/2 percent over this period. These production adjustments--along with a sharp reduction in the flow of imports--contributed to a small decline in real non-auto stocks in the first quarter, and book-value data for the manufacturing and trade sector point to a further decrease, on net, in April and May. As of May, stocks generally seemed in line with sales at retail trade establishments, but there were still some notable overhangs in wholesale trade and especially in manufacturing, where inventory-shipments ratios for producers of computers and electronic products, primary and fabricated metals, and chemicals remained very high.

Business Finance

The economic profits of U.S. corporations fell at a 19 percent annual rate in the first quarter after a similar decline in the fourth quarter of 2000. As a result, the ratio of profits to GDP declined 1 percentage point over the two quarters, to 8.5 percent; the ratio of the profits of nonfinancial corporations to sector output fell 2 percentage points over the interval, to 10 percent. Investment spending has declined by more than profits, however, reducing somewhat the still-elevated need of nonfinancial corporations for external funds to finance capital expenditures. Corporations have husbanded their increasingly scarce internal funds by cutting back on cash-financed mergers and equity repurchases. While equity retirements have therefore fallen, so has gross equity issuance, though by less. Inflows of venture equity capital, in particular, have been reduced substantially. Businesses have met their financing needs by borrowing heavily in the bond market while paying down both commercial and industrial (C&I) loans at banks and commercial paper. In total, after having increased 9-1/2 percent last year, the debt of nonfinancial businesses rose at a 5 percent annual rate in the first quarter of this year and is estimated to have risen at about the same pace in the second quarter.

Before-tax profits of nonfinancial corporations as a percent of sector GDP. By percent. Date range is 1977 to 2001. As shown in the figure, the series begins at about 12 percent in the beginning of 1977. It increases to about 13 percent in early 1978. From 1978 to 1980 it decreases to about 7 percent. It then increases to about 11 percent in 1984, and then generally decreases to about 8 percent in 1992. It then increases to about 13 percent in 1997 and decreases to end at about 10 percent. Note: Data extend through 2001:Q1. Profits are from domestic operations of nonfinancial corporations, with inventory valuation and capital consumption adjustments, divided by gross domestic product of nonfinancial corporate sector.

Financing gap and net equity retirement at nonfarm nonfinancial corporations. In billions of dollars. Line chart with two series (net equity retirement and financing gap). Date range is 1990 to 2001. Net equity retirement and financing gap start in the middle of 1990 at about 65 percent. Net equity retirement decreases to about negative 25 in the middle of 1993. Then it increases to about 260 by mid-1998. It then decreases to end at about 30. Financing gap increases to about $260 billion by the middle of 2000. Then it decreases to end at about 215. Note: The data through 2000 are annual; the final observation is for 2001:Q1 and is at an annual rate. The financing gap is the difference between capital expenditures and internally generated funds. Net equity retirement is the difference between equity retired through share repurchases, domestic cash-financed mergers, or foreign takeovers of U.S. firms and equity issued in public or private markets, including funds invested by venture capital partnerships.

The decline in C&I loans and commercial paper owes, in part, to less hospitable conditions in shorter-term funding markets. The commercial paper market was rattled in mid-January by the defaults of two large California utilities. Commercial paper is issued only by highly rated corporations, and default is extremely rare. The defaults, along with some downgrades, led investors in commercial paper to pull back and reevaluate the riskiness of issuers. For a while, issuance by all but top-rated names became very difficult and quality spreads widened significantly, pushing some issuers into the shortest maturities and inducing others to exit the market entirely. As a consequence, the amount of commercial paper outstanding plummeted. In the second quarter, risk spreads returned to more typical levels and the runoff moderated. By the end of June, the amount of nonfinancial commercial paper outstanding was nearly 30 percent below its level at the end of 2000, with many firms still not having returned to the market.

Major components of net business financing. In billions of dollars. Stacked bar chart with three series (commercial paper, bonds, and bank loans). Date range is 1999 to 2001:Q2. Bank loans are about $200 billion in 1999. They decrease to about negative $100 billion in 2001:Q2. Bonds are about $75 billion in 2001. They increase to about $400 billion in 2001:Q2. Commercial paper is about $25 billion in 1999. It increases in the first half of 2000 before decreasing to about negative 200 billion in Q1 2001, then increasing to about negative 100 billion in Q2 2001. Note: Seasonally adjusted annual rate for nonfarm nonfinancial corporate businesses. The data for 2001:Q2 are estimated.

Spread of low-tier CP rate over high-tier CP rate. In basis points. Line chart. Date range is 1997 to 2001 As shown in the figure, it starts in the beginning of 1997 at about 20 basis points. It fluctuates between 20 and 40 basis points from 1997 to 2001. Three times it increases and then quickly decreases: at the end of 1998 (to about 90), in 1999 (to about 100), and in 2000 (to about 140). It ends in the middle of 2001 at about 25 basis points. Note: The data are daily and extend through July 12, 2001. The series shown is the difference between the rate on A2/P2 nonfinancial commercial paper and the AA rate.

Even though banks' C&I loans were boosted in January and February by borrowers substituting away from the commercial paper market, loans declined, on net, over the first half of the year, in part because borrowers paid down their bank loans with proceeds from bond issues. Many banks reported on the Federal Reserve's Bank Lending Practices surveys this year that they had tightened standards and terms--including the premiums charged on riskier loans, the cost of credit lines, and loan covenants--on C&I loans. Loan officers cited a worsened economic outlook, industry-specific problems, and a reduced tolerance for risk as the reasons for having tightened. Despite these adjustments to banks' lending stance, credit appears to remain amply available for sound borrowers, and recent surveys of small businesses indicate that they have not found credit significantly more difficult to obtain.

Net percentage of domestic banks tightening standards for commercial and industrial loans, by size of borrower. By percent. Two line charts (“large and medium and Small), both covering the date range of 1990 to 2001. They generally move together. They start at about 60 percent and decrease to about negative 15 percent in 1994. Large and medium increases to about 39 percent by the end of 1998, small to about 10 percent. Small continues to increase to end at about 39 percent. Large and medium decreases to about 10 percent in early 1999, then increases to end at about 50 percent. Note: The data are based on the Federal Reserve's Senior Loan Officer Opinion Survey on Bank Lending Practices, which is generally conducted four times per year. The data extend through May 2001. Small firms are those with annual sales of less than $50 million.

Meanwhile, the issuance of corporate bonds this year has proceeded at about double the pace of the preceding two years. With the yields on high-grade bonds back down to their levels in the first half of 1999 and with futures quotes suggesting interest rates will be rising next year, corporations apparently judged it to be a relatively opportune time to issue. Although investors remain somewhat selective, they have been willing to absorb the large volume of issuance as they have become more confident that the economy would recover and a prolonged disruption to earnings would be avoided. The heavy pace of issuance has been supported, in part, by inflows into bond mutual funds, which may have come at the expense of equity funds.

The flows are forthcoming at relatively high risk spreads, however. Spreads of most grades of corporate debt relative to rates on swaps have fallen a little this year, but spreads remain unusually high for lower investment-grade and speculative-grade credits. The elevated spreads reflect the deterioration in business credit quality that has occurred as the economy has slowed. While declines in interest rates have held aggregate interest expense at a relatively low percentage of cash flow, many individual firms are feeling the pinch of decreases in earnings. Over the twelve months ending in May, 11 percent of speculative-grade bonds, by dollar volume, have defaulted--the highest percentage since 1991 and a substantial jump from 1998, when less than 2 percent defaulted. This deterioration reflects not only the unusually large defaults by the California utilities, but also stress in the telecommunications sector and elsewhere. However, some other measures of credit performance have shown a more moderate worsening. The ratio of the liabilities of failed businesses to those of all nonfinancial businesses and the delinquency rate on C&I loans at banks have risen noticeably from their lows in 1998, but both remain well below levels posted in the early 1990s.

Net interest payments of nonfinancial corporations relative to cash flow. By percent. Line chart. Date range is 1977 to 2001. It starts in early 1977 at about 10 percent and increases to about 22 percent in 1989. In early 1989 it decreases and ends at about 12.5 percent. Note: The data are quarterly and extend through 2001:Q1.

Liabilities of failed businesses as a proportion of total liabilities. By percent. Bar chart. Date range is 1990 to 2001. Nonfinancial firms starts in 1990 at about 0.7 percent. It increases to about 0.9 percent in 1991. From 1992 to 1995 it decreases to about 0.3 percent. It fluctuates between about 0.2 to 0.5 percent between 1995 and 2000. It ends in June 2001 at about 0.5 percent.
Note: Annual average. Value for June 2001 is a twelve-month trailing average. Source: Dun & Bradstreet.

Commercial mortgage debt increased at about an 8-3/4 percent annual rate in the first half of this year, and the issuance of commercial-mortgage-backed securities (CMBS) maintained its robust pace of the past several years. While spreads of the yields on investment- and speculative-grade CMBS over swap rates have changed little this year, significant fractions of banks reported on the Bank Lending Practices survey that they have tightened terms and standards on commercial real estate loans. Although the delinquency rates on CMBS and commercial real estate loans at banks edged up in the first quarter, they remained near record lows. Nevertheless, those commercial banks that reported taking a more cautious approach toward commercial real estate lending stated that they are doing so, in part, because of a less favorable economic outlook in general and a worsening of the outlook for commercial real estate.

The Government Sector

The fiscal 2001 surplus in the federal unified budget is likely to be smaller than the surplus in fiscal 2000 because of the slower growth in the economy and the recently enacted tax legislation. Nonetheless, the unified surplus will remain large, and the paydown of the federal debt is continuing at a rapid clip. As a consequence, the Treasury has taken a number of steps to preserve liquidity in a shrinking market. The weaker economy is also reducing revenues at the state and local level, but these governments remain in reasonably good fiscal shape overall and are taking advantage of historically low interest rates to refund existing debt and to issue new debt.

Federal Government

The fiscal 2001 surplus in the federal government's unified budget is likely to come in below the fiscal 2000 surplus of $236 billion. Over the first eight months of the fiscal year--October to May--the unified budget recorded a surplus of $137 billion, $16 billion higher than during the comparable period last year. But over the balance of the fiscal year, receipts will continue to be restrained by this year's slow pace of economic growth and the associated decline in corporate profits. Receipts will also be reduced significantly over the next few months by the payout of tax rebates and the shift of some corporate payments into fiscal 2002, provisions included in the Economic Growth and Tax Relief Reconciliation Act of 2001.

Federal saving, which is basically the unified budget surplus adjusted to conform to the accounting practices followed in the national income and product accounts (NIPA), has risen dramatically since hitting a low of -3-1/2 percent of GDP in 1992 and stood at 3-3/4 percent of GDP in the first quarter--a swing of more than 7 percentage points. Reflecting the high level of federal saving, national saving, which comprises saving by households, businesses, and governments, has been running at a higher rate since the late 1990s than it did over most of the preceding decade, even as the personal saving rate has plummeted. The deeper pool of national saving, along with large inflows of foreign capital, has provided resources for the technology-driven boom in domestic investment in recent years.

National saving as a percent of nominal GDP. By percent. Two line charts (excluding federal saving and total), both covering the date range of 1984 to 2001. Total starts at about 19 percent. Excluding federal saving starts at about 22 percent. They increase by 1 percent during 1985, then in 1986 excluding federal saving decreases to about 18 percent and total decreases to about 16.5 percent. Excluding federal saving decreases from about 19 to about 12 percent between 1989 and 2002 and ends at about 12 percent. Total fluctuates between about 17 and 15.5 percent between 1989 and 2001 and ends at about 17.5 percent. Note: The data extend through 2001:Q1. National saving comprises the gross saving of households, businesses, and governments.

Federal receipts in the first eight months of the current fiscal year were just 4-1/2 percent higher than during the first eight months of fiscal 2000--a much smaller gain than those posted, on average, over the preceding several years. Much of the slowing was in corporate receipts, which dropped below year-earlier levels, reflecting the recent deterioration in profits. In addition, individual income tax payments rose less rapidly than over the preceding few years, mainly because of slower growth in withheld tax payments. This spring's nonwithheld payments of individual taxes, which are largely payments on the previous year's liability, were relatively strong. Indeed, although there was no appreciable "April surprise" this year--that is, these payments were about in line with expectations--liabilities again appear to have risen faster than the NIPA tax base in 2000. One factor that has lifted liabilities relative to income in recent years is that rising levels of income and a changing distribution have shifted more taxpayers into higher tax brackets. Higher capital gains realizations also have helped raise liabilities relative to the NIPA tax base over this period. (Capital gains are not included in the NIPA income measure, which, by design, includes only income from current production.)

The faster growth in outlays that emerged in fiscal 2000 has extended into fiscal 2001. Smoothing through some timing anomalies at the start of the fiscal year, nominal spending during the first eight months of fiscal 2001 was more than 4 percent higher than during the same period last year; excluding the sizable drop in net interest outlays that has accompanied the paydown of the federal debt, the increase in spending so far this year was nearly 6 percent. Spending in the past couple of years has been boosted by sizable increases in discretionary appropriations as well as by faster growth in outlays for the major health programs. The especially rapid increase in Medicaid outlays reflects the higher cost and utilization of medical care (including prescription drugs), growing enrollments, and a rise in the share of expenses picked up by the federal government. Outlays for Medicare have been lifted, in part, by the higher reimbursements to providers that were enacted last year.

Real federal expenditures for consumption and gross investment, the part of government spending that is included in GDP, rose at a 5 percent annual rate in the first quarter. Over the past couple of years, real nondefense purchases have remained on the moderate uptrend that has been evident since the mid-1990s, while real defense purchases have started to rise slowly after having bottomed out in the late 1990s.

The Treasury has used the substantial federal budget surpluses to pay down its debt further. At the end of June, the outstanding Treasury debt held by the public had fallen nearly $600 billion, or 15 percent, from its peak in 1997. Relative to nominal GDP, publicly held debt has dropped from nearly 50 percent in the mid-1990s to below 33 percent in the first quarter, the lowest it has been since 1984.

Declines in outstanding federal debt and the associated reductions in the sizes and frequency of auctions of new issues have diminished the liquidity of the Treasury market over the past few years. Bid-asked spreads are somewhat wider, quote sizes are smaller, and the difference between yields on seasoned versus most-recently issued securities has increased. In part, however, these developments may also reflect a more cautious attitude among securities dealers following the market turmoil in the fall of 1998.

The Treasury has taken a number of steps to limit the deterioration in the liquidity of its securities. In recent years, it has concentrated its issuance into fewer securities, so that the auction sizes of the remaining securities are larger. Last year, in order to enable issuance of a larger volume of new securities, the Treasury began buying back less-liquid older securities, and it also made every second auction of its 5- and 10-year notes and 30-year bond a reopening of the previously issued security. In February, the Treasury put limits on the noncompetitive bids that foreign central banks and governmental monetary entities may make, so as to leave a larger and more predictable pool of securities available for competitive bidding, helping to maintain the liquidity and efficiency of the market. In May, the Treasury announced that it would begin issuing Treasury bills with a four-week maturity to provide it with greater flexibility and cost efficiency in managing its cash balances, which, in part because new securities are now issued less frequently, have become more volatile. Finally, also in May, the Treasury announced it would in the next few months seek public comment on a plan to ease the "35 percent rule," which limits the bidding at auctions by those holding claims on large amounts of an issue. With reopenings increasingly being used to maintain liquidity in individual issues, this rule was constraining many potential bidders. As discussed below, the reduced issuance of Treasury securities has also led the Federal Reserve to modify its procedures for acquiring such securities and to study possible future steps for its portfolio.

In early 2000, as investors focused on the possibility that Treasury securities were going to become increasingly scarce, they became willing to pay a premium for longer-dated securities, pushing down their yields. However, these premiums appear to have largely unwound later in the year as market participants made adjustments to the new environment. These adjustments include the substitution of alternative instruments for hedging and pricing, such as interest rate swaps, prominent high-grade corporate bonds, and securities issued by government-sponsored enterprises (GSEs). To benefit from adjustments by market participants, in 1998, Fannie Mae and Freddie Mac initiated programs to issue securities that share some characteristics with Treasury securities, such as regular issuance calendars and large issue sizes; in the first half of this year they issued $88 billion of coupon securities and $502 billion of bills under these programs. The GSEs have also this year begun buying back older securities to boost the size of their new issues. Nevertheless, the market for Treasury securities remains considerably more liquid than markets for GSE and other fixed-income securities.

State and Local Governments

State and local governments saw an enormous improvement in their budget positions between the mid-1990s and last year as revenues soared and spending generally was held in check; accordingly, these governments were able both to lower taxes and to make substantial allocations to reserve funds. More recently, however, revenue growth has slowed in many states, and reports of fiscal strains have increased. Nonetheless, the sector remains in relatively good fiscal shape overall, and most governments facing revenue shortfalls have managed to adopt balanced budgets for fiscal 2002 with only minor adjustments to taxes and spending.

Real consumption and investment spending by state and local governments rose at nearly a 5 percent annual rate in the first quarter and apparently posted a sizable increase in the second quarter as well. Much of the strength this year has been in construction spending, which has rebounded sharply after a reported decline in 2000 that was hard to reconcile with the sector's ongoing infrastructure needs and the good financial condition of most governments. Hiring also remained fairly brisk during the first half of the year; on average, employment rose 30,000 per month, about the same as the average monthly increase over the preceding three years.

Although interest rates on municipal debt have edged up this year, they remain low by historical standards. State and local governments have taken advantage of the low interest rates to refund existing debt and to raise new capital. Credit quality has remained quite high in the municipal sector even as tax receipts have softened, with credit upgrades outpacing downgrades in the first half of this year. Most notable among the downgrades was that of California's general obligation bonds. Standard and Poor's lowered California's debt two notches from AA to A+, citing the financial pressures from the electricity crisis and the likely adverse effects of the crisis on the state's economy.

The External Sector

The deficits in U.S. external balances narrowed sharply in the first quarter of this year, largely because of a smaller deficit in trade in goods and services. Most of the financial flows into the United States continued to come from private foreign sources.

Trade and Current Account

After widening continuously during the past four years, the deficits in U.S. external balances narrowed in the first quarter of 2001. The current account deficit in the first quarter was $438 billion at an annual rate, or 4.3 percent of GDP, compared with $465 billion in the fourth quarter of 2000. Most of the reduction of the current account deficit can be traced to changes in U.S. trade in goods and services; the trade deficit narrowed from an annual rate of $401 billion in the fourth quarter of 2000 to $380 billion in the first quarter of this year. The trade deficit in April continued at about the same pace. Net investment income payments were a bit less in the first quarter than the average for last year primarily because of a sizable decrease in earnings by U.S. affiliates of foreign firms.

U.S. current account. Billions of dollars, annual rate. Bar chart. Date range is 1995 to 2001:Q1. U.S. current account begins at about negative 120 in 1995. It generally decreases from 1995:Q1 to 2001:Q1 and ends at about  negative $400 billion in the beginning of 2001.

As U.S. economic growth slowed in the second half of last year and early this year, real imports of goods and services, which had grown very rapidly in the first three quarters of 2000, expanded more slowly in the fourth quarter and then contracted 5 percent at an annual rate in the first quarter. The largest declines were in high-tech products (computers, semiconductors, and telecommunications equipment) and automotive products. In contrast, imports of petroleum and petroleum products increased moderately. A temporary surge in the price of imported natural gas pushed the increase of the average price of non-oil imports above an annual rate of 1 percent in the first quarter, slightly higher than the rate of increase recorded in 2000.

Change in real imports and exports of goods and services. By percent, annual rate. Bar chart with two series (imports and exports). Date range is 1995 to 2001:Q1. They start in the beginning of 1995. Exports starts at about 6 percent and increases to about 15 percent by the end of 1996.Then it decreases to about negative 1 percent in early 1998. In early 2000 it increases to about 11 percent and ends at about negative 1 percent. Imports starts at about 7.5 percent and increases to 17 percent in early 1997. It decreases from 1997 to late 1998 to about 8 percent. It then increases to about 15 percent by early 2000. It then decreases through 2001 and ends at about negative 6 percent. Note: Change for the half-year indicated is measured from the preceding half-year, and the change for 2001:Q1 is from 2000:Q4. Imports and exports for each half-year are the average of the levels for component quarters.

U.S. real exports were hit by slower growth abroad, the strength of the dollar, and plunging global demand for high-tech products. Real exports of goods and services, which had grown strongly in the first three quarters of 2000, fell 6-1/2 percent at an annual rate in the fourth quarter of last year and declined another 1 percent in the first quarter of this year. The largest declines in both quarters were in high-tech capital goods and automotive products (primarily in intra-firm trade with Canada). By market destination, the largest increases in U.S. goods exports during the first three quarters of 2000 had been to Mexico and countries in Asia; the recent declines were mainly in exports to Asia and Latin America. In contrast, goods exports to Western Europe increased steadily throughout the entire period. About 45 percent of U.S. goods exports in the first quarter of 2001 were capital equipment; 20 percent were industrial supplies; and 5 to 10 percent each were agricultural, automotive, consumer, and other goods.

After increasing through much of 2000, the spot price of West Texas intermediate (WTI) crude oil reached a peak above $37 per barrel in September, the highest level since the Gulf War. As world economic growth slowed in the latter part of 2000, oil price declines reversed much of the year's price gain. In response, OPEC reduced its official production targets in January of this year and again in March. As a result, oil prices have remained relatively high in 2001 despite weaker global economic growth and a substantial increase in U.S. oil inventories. Oil prices have also been elevated by the volatility of Iraqi oil exports arising from tense relations between Iraq and the United Nations. During the first six months of this year, the spot price of WTI has fluctuated, with only brief exceptions, between $27 and $30 per barrel.

Financial Account

In the first quarter of 2001, as was the case in 2000 as a whole, nearly all of the net financial flows into the United States came from private foreign sources. Foreign official inflows were less than $5 billion and were composed primarily of the reinvestment of accumulated interest earnings. Reported foreign exchange intervention purchases of dollars were modest.

U.S. international securities transactions. Private foreign purchases of U.S. securities. In billions of dollars. Bar chart with two series (net foreign purchases of U.S. bonds and net foreign purchases of U.S. equities). Date range is 1999 to 2001. They start in the first quarter of 1999. Net foreign purchases of U.S. bonds at about 60. It then increases to about 65 in the first quarter of 2000 and ends at about 105. Net foreign purchases of U.S. equities starts at about 10. It then increases to about 70 by early 2000 and ends at about $40 billion.
U.S. international securities transactions. Private U.S. purchases of foreign securities. In billions of dollars. Bar chart with two series (net foreign purchases of U.S. bonds and Net foreign purchases of U.S. equities). Date range is 1999 to 2001. Net foreign purchases of U.S. equities starts in the first quarter of 1999 at about negative 1. It increases to about 74 in the second quarter of 1999. It decreases to about 20 in early 2000 and it increases to about 50 in the second quarter of 2000. It ends at about $25 billion. 
Net foreign purchases of U.S. bonds starts in the second quarter of 1999 at about negative 5. It increases to about 44 in the third quarter of 1999. It then decreases to negative 10 in the second quarter of 2000. It ends at about $20 billion in 2000:Q1.

Inflows arising from private foreign purchases of U.S. securities accelerated further in the first quarter and are on a pace to exceed last year's record. All of the pickup is attributable to larger net foreign purchases of U.S. bonds, as foreign purchases of both corporate and agency bonds accelerated and private foreign sales of Treasuries paused. Foreign purchases of U.S. equities are only slightly below their 2000 pace despite the apparent decline in expected returns to holding U.S. equities.

The pace at which U.S. residents acquired foreign securities changed little between the second half of last year and the first quarter of this year. As in previous years, most of the foreign securities acquired were equities.

Net financial inflows associated with direct investment slowed a good bit in the first quarter, as there were significantly fewer large foreign takeovers of U.S. firms and U.S. direct investment abroad remained robust.

The Labor Market

Labor demand weakened in the first half of 2001, especially in manufacturing, and the unemployment rate rose. Increases in hourly compensation have continued to trend up in recent quarters, while measured labor productivity has been depressed by the slower growth of output.

Employment and Unemployment

After having risen an average of 149,000 per month in 2000, private payroll employment increased an average of only 63,000 per month in the first quarter of 2001, and it declined an average of 117,000 per month in the second quarter. The unemployment rate moved up over the first half of the year and in June stood at 4-1/2 percent, 1/2 percentage point higher than in the fourth quarter of last year.

Net change in private nonfarm payroll employment. Thousands of jobs, monthly average. Bar chart. Date range is 1991 to 2001:Q2. Net change in private nonfarm payroll employment starts at about negative 90 and generally increases to about 300 by 1994. Then it fluctuates at about 200 between 1995 and 2000, and then generally decreases and ends at about negative 120.

Measures of labor utilization. By percent. Line chart with two series (augmented unemployment rate and Civilian unemployment rate). Date range is 1970 to 2000. The two series track closely. As shown in the figure, augmented unemployment rate begins at about 8 percent in early 1970, it generally increases to about 11 percent in 1971, from 1971 through 1983 it fluctuates between about 10 and 16 percent. In 1983 it begins to decrease, ending at about 7.5 percent. Civilian unemployment rate is between 4 and 6 percent lower than augmented unemployment rate” at all times during this period. 
Note: The data extend through June 2001. The augmented unemployment rate is the number of unemployed plus those who are not in the labor force and want a job, divided by the civilian labor force plus those who are not in the labor force and want a job. In January 1994, a redesigned survey was introduced; data from that point on are not directly comparable with those of earlier periods.

Much of the weakness in employment in the first half of the year was in the manufacturing sector, where job losses averaged 78,000 per month in the first quarter and 116,000 per month in the second quarter. Since last July, manufacturing employment has fallen nearly 800,000. Factory job losses were widespread in the first half of the year, with some of the biggest cutbacks at industries struggling with sizable inventory overhangs, including metals and industrial and electronic equipment. The weakness in manufacturing also cut into employment at help-supply firms and at wholesale trade establishments.

Apart from manufacturing and the closely related help-supply and wholesale trade industries, employment growth held up fairly well in the first quarter but began to slip noticeably in the second quarter. Some of the slowing in the second quarter reflected a drop in construction employment after a strong first quarter that likely absorbed a portion of the hiring that normally takes place in the spring; on average, construction employment rose a fairly brisk 15,000 per month over the first half, about the same as in 2000. Hiring in the services industry (other than help-supply firms) also slowed markedly in the second quarter. Employment in retail trade remained on a moderate uptrend over the first half of the year, and employment in finance, insurance, and real estate increased modestly after having been unchanged, on net, last year.

Labor Costs and Productivity

Through the first quarter, compensation growth remained quite strong--indeed, trending higher by some measures. These gains likely reflected the influence of earlier tight labor markets, higher consumer price inflation--largely due to soaring energy prices--and the greater real wage gains made possible by faster structural productivity growth. The upward pressures on labor costs could abate in coming quarters if pressures in labor markets ease and energy prices fall back.

Hourly compensation, as measured by the employment cost index (ECI) for private nonfarm businesses, moved up in the first quarter to a level about 4-1/4 percent above its level of a year earlier; this compares with increases of about 4-1/2 percent over the preceding year and 3 percent over the year before that. The slight deceleration in the most recent twelve-month change in the ECI is accounted for by a slowdown in the growth of compensation for sales workers relative to the elevated rates that had prevailed in early 2000; these workers' pay includes a substantial commission component and thus is especially sensitive to cyclical developments. Compensation per hour in the nonfarm business sector--a measure that picks up some forms of compensation that the ECI omits but that sometimes has been revised substantially once the data go through the annual revision process--shows a steady uptrend over the past couple of years; it rose 6 percent over the year ending in the first quarter after having risen 4-1/2 percent over the preceding year.

Measures of change in hourly compensation. By percent. Line chart with  two series (nonfarm compensation per hour and employment cost index). Date range is 1992 to 2001. Nonfarm compensation per hour starts at about 6 percent in 1992. Then it generally decreases to about 1.3 percent by 1993. From 1993 through 1995 it fluctuates between about 1.3 to 2.3 percent. It starts to increase in early 1995 and ends at about 6 percent. Employment cost index begins at about 4.3 percent in early 1992. Then it fluctuates between about 2.9 to 4.9 percent from 1992 through 2001 and ends at about 4.2 percent. Note: The data extend through 2001:Q1. The ECI is for private industry excluding farm and household workers. Nonfarm compensation per hour is for the nonfarm business sector.

According to the ECI, wages and salaries rose at an annual rate of about 4-1/2 percent in the first quarter. Excluding sales workers, wages rose 5 percent (annual rate) in the first quarter and 4-1/4 percent over the year ending in March; this compares with an increase of 3-3/4 percent over the year ending in March 2000. Separate data on average hourly earnings of production or nonsupervisory workers also show a discernible acceleration of wages: The twelve-month change in this series was 4-1/4 percent in June, 1/2 percentage point above the reading for the preceding twelve months.

Benefit costs as measured in the ECI have risen faster than wages over the past year, with the increase over the twelve months ending in March totaling 5 percent. Much of the pressure on benefits is coming from health insurance, where employer payments have accelerated steadily since bottoming out in the mid-1990s and are now going up about 8 percent per year. The surge in spending on prescription drugs accounts for some of the rise in health insurance costs, but demand for other types of medical care is increasing rapidly as well. Moreover, although there has been some revamping of drug coverage to counter the pressures of soaring demand, many employers have been reluctant to adjust other features of the health benefits package in view of the need to retain workers in a labor market that has been very tight in recent years.

Measured labor productivity in the nonfarm business sector has been bounced around in recent quarters by erratic swings in hours worked by self-employed individuals, but on balance, it has barely risen since the third quarter of last year after having increased about 3 percent per year, on average, over the preceding three years. This deceleration coincides with a marked slowing in output growth and seems broadly in line with the experience of past business cycles; these readings remain consistent with a noticeable acceleration in structural productivity having occurred in the second half of the 1990s. Reflecting the movements in hourly compensation and in actual productivity, unit labor costs in the nonfarm business sector jumped in the first quarter and have risen 3-1/2 percent over the past year.

Change in output per hour, nonfarm businesses. By percent. Bar chart. Date range is 1992 to 2001:Q1. As shown in the figure, change in output per hour, nonfarm businesses starts at about 4.2 percent in 1992. Then it generally decreases to about negative 0.3 percent by 1993. From 1994 through 1999 it increases to about 3.9 percent. In 2000 it begins to decrease and ends at about 2.5 percent.

Change in unit labor costs, nonfarm businesses. By percent. Bar chart. Date range is 1992 to 2001:Q1. As shown in the figure, change in unit labor costs, nonfarm businesses starts at about 0.7 percent in 1992. In 1993 it's at about 1.7 percent, in 1994 it's at about 2.0 percent. In 1995 it's at about 1.5 percent and then it increases to about 2.4 percent in 1998. In 1999 it's at about 0.5 percent. It ends at about 3.5 percent.

Looking ahead, prospects for favorable productivity performance will hinge on a continuation of the rapid technological advances of recent years and on the willingness of businesses to expand and update their capital stocks to take advantage of the new efficiency-enhancing capital that is becoming available at declining cost in many cases. To be sure, the current weakness in business investment will likely damp the growth of the capital stock relative to the pace of the past couple of years. But once the cyclical weakness in the economy dissipates, continued advances in technology should provide impetus to renewed capital spending and a return to solid increases in productivity.

Prices

Inflation moved higher in early 2001 but has moderated some in recent months. After having risen 2-1/4 percent in 2000, the chain price index for personal consumption expenditures (PCE) increased about 3-1/4 percent in the first quarter of 2001 as energy prices soared and as core consumer prices--which exclude food and energy--picked up. Energy prices continued to rise rapidly in April and May but eased in June and early July. In addition, core PCE price inflation has dropped back after the first-quarter spurt, and the twelve-month change in this series, which is a useful indicator of the underlying inflation trend, stood at 1-1/2 percent in May, about the same as the change over the preceding twelve months. The core consumer price index (CPI) continued to move up at a faster pace than the core PCE measure over the past year, rising 2-1/2 percent over the twelve months ending in May, also the same rate as over the preceding year.

Change in consumer prices. By percent, annual rate. Bar chart with two series (chain-type price index for PCE and CPI). Date range is 1992 to 2001:Q1. Both series generally move together. They start at about 3 percent in 1994, with chain-type price index for PCE being slightly lower. They then decrease until 1995, when chain-type price index for PCE is at about 2.3 percent and CPI is at about 2.7 percent. In 1998 chain-type price index for PCE is at about 1.2 percent and CPI is at about 1.5 percent. Then they start to increase and end in 2001:Q1 with chain-type price index for PCE at about 3.2 percent and CPI at about 4.2 percent. Note: The CPI is for all urban consumers (CPI-U).

PCE energy prices rose at an annual rate of about 11 percent in the first quarter and, given the big increases in April and May, apparently posted another sizable advance in the second quarter. Unlike the surges in energy prices in 1999 and 2000, the increases in the first half of 2001 were not driven by developments in crude oil markets. Indeed, natural gas prices were the major factor boosting overall energy prices early this year as tight inventories and concerns about potential stock-outs pushed spot prices to extremely high levels; natural gas prices have since receded as additional supplies have come on line and inventories have been rebuilt. In the spring, gasoline prices soared in response to strong demand, refinery disruptions, and concerns about lean inventories; with refineries back on line, imports up, and inventories restored, gasoline prices have since fallen noticeably below their mid-May peaks. Electricity prices also rose substantially in the first half of the year, reflecting higher natural gas prices as well as the problems in California. Capacity problems in California and the hydropower shortages in the Northwest persist, though California's electricity consumption has declined recently and wholesale prices have dropped. In contrast, capacity in the rest of the country has expanded appreciably over the past year and, on the whole, appears adequate to meet the normal seasonal rise in demand.

Core PCE prices rose at a 2-1/2 percent annual rate in the first quarter--a hefty increase by the standards of recent years. But the data are volatile, and the first-quarter increase, no doubt, exaggerates any pickup. Based on monthly data for April and May, core PCE inflation appears to have slowed considerably in the second quarter; the slowing was concentrated in the goods categories and seems consistent with reports that retailers have been cutting prices to spur sales in an environment of soft demand.

Change in consumer prices excluding food and energy. By percent, annual rate. Bar chart with two series  (chain-type price index for PCE and CPI). Date range is 1992 to 2001:Q1. Both series generally move together with chain-type price index for PCE generally being about .5 percent lower during the entire period. They start at about 3.5 percent in 1994, with chain-type price index for PCE being slightly lower. They then decrease until 1999. Chain-type price index for PCE ends at about 2.7 percent in 2001:Q1. CPI ends at about 3.2 percent in 2001:Q1. Note: The CPI is for all urban consumers (CPI-U).

Core consumer price inflation--whether measured by the PCE index or by the CPI--in recent quarters almost certainly has been boosted by the effects of higher energy prices on the costs of producing other goods and services. Additional pressure has come from the step-up in labor costs. That said, firms appear to have absorbed much of these cost increases in lower profit margins. Meanwhile, non-oil import prices have remained subdued, thus continuing to restrain input costs for many domestic industries and to limit the ability of firms facing foreign competition to raise prices for fear of losing market share. In addition, apart from energy, price pressures at earlier stages of processing have been minimal. Indeed, excluding food and energy, the producer price index (PPI) for intermediate materials has been flat over the past year, and the PPI for crude materials has fallen 11 percent. Moreover, inflation expectations, on balance, seem to have remained quiescent: According to the Michigan survey, the median expectation for inflation over the upcoming year generally has been running about 3 percent this year, similar to the readings in 2000.

In contrast to the step-up in consumer prices, prices for private investment goods in the NIPA were up only a little in the first quarter after having risen about 2 percent last year. In large part, this pattern was driven by movements in the price index for computers, which fell at an annual rate of nearly 30 percent in the first quarter as demand for high-tech equipment plunged. This drop in computer prices was considerably greater than the average decrease of roughly 20 percent per year in the second half of the 1990s and the unusually small 11 percent decrease in 2000. Monthly PPI data suggest that computer prices were down again in the second quarter, though much less than in the first quarter.

All told, the GDP chain-type price index rose at an annual rate of 3-1/4 percent in the first quarter and has risen 2-1/4 percent over the past four quarters, an acceleration of 1/2 percentage point from the comparable year-earlier period. The price index for gross domestic purchases--which is defined as the prices paid for consumption, investment, and government purchases--also accelerated in the first quarter--to an increase of about 2-3/4 percent; the increase in this measure over the past year was 2-1/4 percent, about the same as over the preceding year. Excluding food and energy, the latest four-quarter changes in both GDP and gross domestic purchases prices were roughly the same as over the preceding year.

Alternative measures of price change
Percent, Q1 to Q1
table rule

Price measure


1998
to
1999
1999
to
2000
2000
to
2001
Chain-type
     
Gross domestic product
1.5 1.8 2.3
Gross domestic purchases
1.2 2.3 2.2
Personal consumption expenditures 1.5 2.5 2.2
    Excluding food and energy
1.8 1.6 1.7
       
Fixed-weight
     
Consumer price index
1.7 3.3 3.4
    Excluding food and energy
2.2 2.2 2.7
table rule

             Note.  A fixed-weight index uses quantity weights from a base year
to aggregate prices from each distinct item category. A chain-type index is the
geometric average of two fixed-weight indexes and allows the weights to
change each year. The consumer price indexes are for all urban consumers.
Changes are based on quarterly averages.
 

U.S. Financial Markets

Longer-term interest rates and equity prices have shown remarkably small net changes this year, given the considerable shifts in economic prospects and major changes in monetary policy. To some extent, the expectations of the economic and policy developments in 2001 had already become embedded in financial asset prices as last year came to a close; from the end of August through year-end, the broadest equity price indexes fell 15 percent and investment-grade bond yields declined 40 to 70 basis points. In addition, however, equity prices and long-term interest rates were influenced importantly by growing optimism in financial markets over the second quarter of 2001 that the economy and profits would rebound strongly toward the end of 2001 and in 2002. On net, equity prices fell 6 percent in the first half of this year as near-term corporate earnings were revised down substantially. Rates on longer-term Treasury issues rose a little, but those on corporate bonds were about unchanged, with the narrowing spread reflecting greater investor confidence in the outlook. But risk spreads remained wide by historical standards for businesses whose debt was rated as marginally investment grade or below; many of these firms had been especially hard hit by the slowdown and the near-term oversupply of high-tech equipment and services, and defaults by these firms became more frequent. Nevertheless, for most borrowers the environment for long-term financing was seen to be quite favorable, and firms and households tended to tap long-term sources of credit in size to bolster their financial conditions and lock in more favorable costs.

Interest Rates

In response to the abrupt deceleration in economic growth and prospects for continued weakness in the economy, the FOMC lowered the target federal funds rate 2-3/4 percentage points in six steps in the first half of this year, an unusually steep decline relative to many past easing cycles. Through March, the policy easings combined with declining equity prices and accumulating evidence that the slowdown in economic growth was more pronounced than had been initially thought led to declines in yields on intermediate- and longer-term Treasury securities. Over the second quarter, despite the continued decrease in short-term rates and further indications of a weakening economy, yields on intermediate-term Treasury securities were about unchanged, while those on longer-term securities rose appreciably. On net, yields on intermediate-term Treasury securities fell about 3/4 percentage point in the first half of this year, while those on longer-term Treasury securities rose about 1/4 percentage point.

Rates on selected Treasury securities. By percent Line chart with three series (ten-year, two-year, and Three-month). Date range is January 1999 to July 2001. Three-month starts at about 4.5 percent, and then it increases to about 6.5 percent by November 2000. In June 2000 three-month decreases to about 5.6 percent, and then it increases to about 6.4 percent in November 2000. It then decreases to end at about 3.6 percent. Ten-year and two-year track very closely together from 1999 to early 2001. They start at about 4.6 percent, then increase to about 6.5 percent by the middle of 2000, with two-year being slightly higher. They then decrease to about 5 percent by the end of 2000. Ten-year then increases to end at about 5.4 percent and two-year decreases to end at about 4.1 percent. Note: The data are daily and extend through July 12, 2001.

The increase in longer-term Treasury yields in the second quarter appears to have been the result of a number of factors. The main influence seems to have been increased investor confidence that the economy would soon pick up. That confidence likely arose in part from the aggressive easing of monetary policy and also in part from the improving prospects for, and passage of, a sizable tax cut. The tax cut and the growing support for certain spending initiatives implied stronger aggregate demand and less federal saving than previously anticipated. The prospect that the federal debt might be paid down less rapidly may also have reduced slightly the scarcity premiums investors were willing to pay for Treasury securities. Finally, a portion of the rise may have been the result of increased inflation expectations. Inflation compensation as measured by the difference between nominal Treasury rates and the rates on inflation-indexed Treasury securities rose about 1/4 percentage point in the second quarter. Despite this increase, there is little evidence that inflation is expected to go up from its current level. At the end of last year, inflation compensation had declined to levels suggesting investors expected inflation to fall, and the rise in inflation compensation in the second quarter largely reversed those declines. Moreover, survey measures of longer-term inflation expectations have changed little since the middle of last year.

Measures of long-term inflation expectations. By percent. Line chart with three series (FRB Philadelphia survey, Michigan survey, and TIIS inflation compensation). Date range is January 1999 to July 2001. FRB Philadelphia survey starts at about 2.3 percent then increases to about 2.5 percent and stays at about 2.5 percent from April 1999 through June 2001. “Michigan survey” starts at about 3.0 percent. It fluctuates between about 2.6 to 3.3 percent and ends at about 3.0 percent in July 2001. TIIS inflation compensation starts at about 0.1 percent. It increases to about 2.6 percent from February 1999 through May 2000. It then decreases to about 1.5 percent by December 2000, then increases to about 2.4 percent by May 2001, and ends at about 2 percent. Note: The data for the Michigan survey, which are monthly and extend through June 2001, measure five-year to ten-year inflation expectations. The data for the FRB Philadelphia survey, which are quarterly and extend through 2001:Q2, measure ten-year inflation expectations. TIIS inflation compensation is the rate of inflation at which the price of the ten-year Treasury inflation-indexed security equals the value of a portfolio of zero-coupon securities that replicates its payments; data for this measure are weekly averages and extend through July 13, 2001.

Yields on longer-maturity corporate bonds were about unchanged, on net, over the first half of this year. Yields on investment-grade bonds are near their lows for the past ten years, but those on speculative-grade bonds are elevated. Spreads of corporate bond yields relative to swap rates narrowed a bit, although they still remain high. Amidst signs of deteriorating credit quality and a worsening outlook for corporate earnings, risk spreads on speculative-grade bonds had risen by about 2 percentage points late last year, reaching levels not seen since 1991. Much of this widening was reversed early in the year, as investors became more confident that corporate balance sheets would not deteriorate substantially, but speculative-grade bond spreads widened again recently in response to negative news about second-quarter earnings and declines in share prices, leaving these spreads at the end of the second quarter only slightly below where they began the year. Nonetheless, investors, while somewhat selective, appear to remain receptive to new issues with speculative-grade ratings.

Corporate bond yields. By percent. Line chart with two series (high yield and AA). Date range is 1990 to 2001. AA starts at about 9 percent in early 1990. Then it fluctuates between about 6 and 7.5 percent from 1993 through 2000 and ends at about 6.5 percent. High yield starts at about 17 percent and increases to about 21 percent in early 1991. Then it decreases to about 9 percent in early 1994. It then fluctuates between about 10 and 13.5 percent from 1994 to 2000 and ends at about 13 percent. Note: The data are monthly averages and extend through June 2001. The AA rate is calculated from bonds in the Merrill Lynch AA index with seven to ten years remaining to maturity. The high-yield rate is the yield on the Merrill Lynch 175 high-yield index.

Interest rates on commercial paper and C&I loans have fallen this year by about as much as the federal funds rate, although some risk spreads widened. The average yield spread on second-tier commercial paper over top-tier paper widened to about 100 basis points in late January, about four times its typical level, following defaults by a few prominent issuers. As the year progressed, investors became less concerned about the remaining commercial paper borrowers, and this spread has returned to a more normal level. According to preliminary data from the Federal Reserve's quarterly Survey of Terms of Business Lending, the spread over the target federal funds rate of the average interest rate on commercial bank C&I loans edged up between November and May and remains in the elevated range it shifted to in late 1998. Judging from the widening since 1998 of the average spread between rates on riskier and less-risky loans, banks have become especially cautious about lending to marginal credits.

Spread of average business loan rate over intended federal funds rate. By percentage points. Line chart. Date range is 1990 to 2001. As shown in the figure, the spread starts in the beginning of 1990 at about 1.8.Then it increases to about 2.4 in 1992. From 1992 to 1995 it decreases to about 1.5. It then generally increases to about 2.1 and ends at about 2.1. Note: The data, which are based on the Federal Reserve's Survey of Terms of Business Lending, are for loans made by domestic commercial banks. The survey is conducted in the middle month of each quarter; the final observation is for May 2001 and is preliminary.

Equity Markets

After rising in January in response to the initial easing of monetary policy, stock prices declined in February and March in reaction to profit warnings and weak economic data, with the Wilshire 5000, the broadest major stock price index, ending the first quarter down 13 percent. Stock prices retraced some of those losses in the second quarter, rising 7 percent, as first-quarter earnings releases came in a little above sharply reduced expectations and as investors became more confident that economic growth and corporate profits would soon pick up. On net, the Wilshire 5000 ended the half down 6 percent, the DJIA declined 3 percent, and the tech-heavy Nasdaq fell 13 percent. Earnings per share of the S&P 500 in the first quarter decreased 10 percent from a year earlier. A disproportionate share of the decline in S&P earnings--more than half--was attributable to a plunge in the technology sector, where first-quarter earnings were down nearly 50 percent from their peak in the third quarter of last year.

Major stock price indexes. Line chart with three series (Wilshire 5000, Nasdaq, and S&P 500). Date range is January 1999 to July 2001. January 4, 1999 = 100. Nasdaq starts at about 100. Then it increases to about 230 by May 2000 and generally decreases to about 140 by the middle of 2000. In September 2000 it increases to about 180 and then decreases to end at about 100. Wilshire 5000 and S&P 500 track very closely together. They start at about 100, then increase to about 130 in early 2000, and then decrease to end at about 100. Note: The data are daily and extend through July 12, 2001.

The decline in stock prices has left the Wilshire 5000 down by about 20 percent, and the Nasdaq down by about 60 percent, from their peaks in March 2000. Both of these indexes are near their levels at the end of 1998, having erased the sharp run-up in prices in 1999 and early 2000. But both indexes remain more than two and one-half times their levels at the end of 1994, when the bull market shifted into a higher gear. The ratio of expected one-year-ahead earnings to equity prices began to fall in 1995 when, as productivity growth picked up, investors began to build in expectations that increases in earnings would remain rapid for some time. This measure of the earnings-price ratio remains near the levels reached in 1999, suggesting that investors still anticipate robust long-term earnings growth, likely reflecting expectations for continued strong gains in productivity.

S&P 500 earnings–price ratio and the real interest rate. By percent. Line chart with  two series (S&P 500 earnings–price ratio and real interest rate). Date range is 1990 to 2001. They start in early 1990. S&P 500 earnings–price ratio starts at about 8.5 percent. It then increases to about 9.5 percent by the end 1990. From 1991 to 1994 it decreases to about 6.5 percent, then increases to about 8 percent in early 1995, and from 1995 to 2001 decreases to end at about 4.5 percent. Real interest rate starts at about 4.25 percent. It then decreases to about 2 percent in 1993 and increases to about 4.5 percent in early 1995. From 1995 to 2001 it fluctuates between about 2 and 4 percent before ending at about 2.5 percent. Note: The data are monthly and extend through June 2001. The earnings–price ratio is based on I/B/E/S consensus estimates of earnings over the coming year. The real rate is estimated as the difference between the ten-year Treasury rate and the five-year to ten-year expected inflation rate from the FRB Philadelphia survey.

Despite the substantial variation in share prices over the first half of this year, trading has been orderly, and financial institutions appear to have encountered no difficulties that could pose broader systemic concerns. Market volatility and a less ebullient outlook have led investors to buy a much smaller share of stock on margin. At the end of May, margin debt was 1.15 percent of total market capitalization, equal to its level at the beginning of 1999 and well below its high of 1.63 percent in March of last year.

Federal Reserve Open Market Operations

As noted earlier, the Federal Reserve has responded to the diminished size of the auctions of Treasury securities by modifying its procedures for acquiring such securities. To help maintain supply in private hands adequate for liquid markets, since July of last year the System has limited its holdings of individual securities to specified percentages, ranging from 15 percent to 35 percent, of outstanding amounts. To stay within these limits, the System has at times not rolled over all of its holdings of maturing securities, generally investing the difference by purchasing other Treasury securities on the open market. The Federal Reserve also has increased its holdings of longer-term repurchase agreements (RPs), including RPs backed by agency securities and mortgage-backed securities, as a substitute for outright purchases of Treasury securities. In the first half of the year, longer-term RPs, typically with maturities of twenty-eight days, averaged $13 billion.

As reported in the previous Monetary Policy Report, the FOMC also initiated a study to evaluate assets to hold on its balance sheet as alternatives to Treasury securities. That study identified several options for further consideration. In the near term, the Federal Reserve is considering purchasing and holding Ginnie Mae mortgage-backed securities, which are explicitly backed by the full faith and credit of the U.S. government, and engaging in repurchase operations against foreign sovereign debt. For possible implementation later, the Federal Reserve is studying whether to auction longer-term discount window credit, and it will over time take a closer look at a broader array of assets for repurchase and for holding outright, transactions that would require additional legal authority.

Debt and the Monetary Aggregates

The growth of domestic nonfinancial debt in the first half of 2001 is estimated to have remained moderate, slowing slightly from the pace in 2000 as a reduction in the rate of increase in nonfederal debt more than offset the effects of smaller net repayments of federal debt. In contrast, the monetary aggregates have grown rapidly so far this year, in large part because the sharp decline in short-term market interest rates has reduced the opportunity cost of holding the deposits and other assets included in the aggregates.

Debt and Depository Intermediation

The debt of the domestic nonfinancial sectors is estimated to have expanded at a 4-3/4 percent annual rate over the first half of 2001, a touch below the 5-1/4 percent growth recorded in 2000. Changes in the growth of nonfederal and federal debt this year have mostly offset each other. The growth of nonfederal debt moderated from 8-1/2 percent in 2000 to a still-robust 7-1/4 percent pace in the first half of this year. Households' borrowing slowed some but was still substantial, buoyed by continued sizable home and durable goods purchases. Similarly, business borrowing moderated even as bond issuance surged, as a good portion of the funds raised was used to pay down commercial paper and bank loans. Tending to boost debt growth was a slowing in the decline in federal debt to a 6-1/4 percent rate in the first half of this year from 6-3/4 percent last year, largely because of a decline in tax receipts on corporate profits.

Growth of domestic nonfinancial debt. By percent. Line chart with three series (total, nonfederal, and federal). Date range is 1988 to 2001. They start in early 1988. Total starts at about 9 percent. It then generally decreases to about 4.25 percent in early 1991. From 1991 to 1997 it increases to about 6.5 percent. It then decreases and ends at about 4.5 percent. Federal starts at about 8 percent. It then increases to about 11 percent in 1991 and generally decreases to end at about negative 4 percent. Nonfederal starts at about 9.5 percent. It then generally decreases to about 2.5 percent in 1991, generally increases to about 9 percent in 1998, and ends at about 7 percent in early 2001. Note: Annual growth rates are computed from fourth-quarter averages. Growth in the first half of 2001 is the June average relative to the fourth-quarter average at an annual rate and is based on partially estimated data. Domestic nonfinancial debt consists of the outstanding credit market debt of governments, households and nonprofit organizations, nonfinancial businesses, and farms.

The share of credit to nonfinancial sectors held at banks and other depository institutions edged down in the first half of the year. Bank credit, which accounts for about three-fourths of depository credit, increased at a 3-1/2 percent annual rate in the first half of the this year, well off the 9-1/2 percent growth registered in 2000. Banks' loans to businesses and households decelerated even more, in part because borrowers preferred to lock in the lower rates available from longer-term sources of funds such as bond and mortgage markets and perhaps also in part because banks firmed up their lending stance in reaction to concerns about loan performance. Loan delinquency and charge-off rates have trended up in recent quarters, and higher loan-loss provisions have weighed on profits. Nevertheless, through the first quarter, bank profits remained in the high range recorded for the past several years, and virtually all banks--98 percent by assets--were well capitalized. With banks' financial condition still quite sound, they remain well positioned to meet future increases in the demand for credit.

Percent of all U.S. commercial bank assets at well-capitalized banks. By percent. Line chart. Date range is 1990 to 2001. It starts at about 30 percent in early 1990, generally increases to about 98 percent in 1995, and ends at about 99 percent. Note: The data are quarterly and extend through 2001:Q1. Capital status is determined using the regulatory standards for the leverage, tier 1, and total capital ratios.

The Monetary Aggregates

The monetary aggregates have expanded rapidly so far this year, although growth rates have moderated somewhat recently. M2 rose 10-1/4 percent at an annual rate in the first half of this year after having grown 6-1/4 percent in 2000. The interest rates on many of the components of M2 do not adjust quickly or fully to changes in market interest rates. As a consequence, the steep declines in short-term market rates this year have left investments in M2 assets relatively more attractive, contributing importantly to the acceleration in the aggregate. M2 has also probably been buoyed by the volatility in the stock market this year, and perhaps by lower expected returns on equity investments, leading investors to seek the safety and liquidity of M2 assets.

M2 growth rate. By percent, annual rate. Bar chart. Date range is 1990 to 2001. M2 growth rate starts at about 4.25 percent. It decreases to about 0.5 percent in 1994.Then it increases to about 8.8 percent in 1998. It decreases to about 6 percent by 2000 and then increases to end at about 10 percent. Note: M2 consists of currency, travelers checks, demand deposits, other checkable deposits, savings deposits (including money market deposit accounts), small-denomination time deposits, and balances in retail money market funds. See footnote under the domestic nonfinancial debt chart for details on the computation of growth rates.

M3, the broadest monetary aggregate, rose at a 13-1/4 percent annual rate through June, following 9-1/4 percent growth in 2000. All of the increase in M3, apart from that accounted for by M2, resulted from a ballooning of institutional money market funds, which expanded by nearly a third. Yields on these funds lag market yields somewhat, and so the returns to the funds, like those on many M2 assets, became relatively attractive as interest rates on short-term market instruments declined.

M3 growth rate. By percent, annual rate. Bar chart. Date range is 1990 to 2001:H1. M3 growth rate starts at about 2.1 percent. It decreases to about 0.3 percent in 1992, then increases to about 11 percent in 1998. In 1999 it decreases to about 7.8 percent and increases to end at about 13.6 percent in 2001:H1. Note: M3 consists of M2 plus large-denomination time deposits, balances in institutional money market funds, RP liabilities (overnight and term), and Eurodollars (overnight and term). See footnote under the domestic nonfinancial debt chart for details on the computation of growth rates.

International Developments

So far this year, average foreign growth has weakened further and is well below its pace of a year ago. Activity abroad was restrained by the continued high level of oil prices, the global slump of the high-technology sector, and spillover effects from the U.S. economic slowdown, but in some countries domestic demand softened as well in reaction to local factors. High oil prices kept headline inflation rates somewhat elevated, but even though core rates of inflation have edged up in countries where economic slack has diminished, inflationary pressures appear to be well under control.

Monetary authorities in most cases reacted to signs of slowdown by lowering official rates, but by less than in the United States. Partly in response to these actions, yield curves have steepened noticeably so far in 2001. Although long-term interest rates moved down during the first quarter, they more than reversed those declines in most cases as markets reacted to a combination of the anticipation of stronger real growth and the risk of increased inflationary pressure. Foreign equity markets--especially for high-tech stocks--were buffeted early this year by many of the same factors that affected U.S. share prices: negative earnings reports, weaker economic activity, buildups of inventories of high-tech goods, and uncertainties regarding the timing and extent of policy responses. In recent months, the major foreign equity indexes moved up along with U.S. stock prices, but they have edged off lately and in most cases are down, on balance, for the year so far.

Foreign interest rates. By percent. Short-term (three-month). Line chart with four series (U.K. interbank, Euro-area interbank, Canadian finance paper and Japanese CD). Date range is 2000:Q1 to 2001:Q3. They start in early 2000:Q1. U.K. interbank starts at about 6 percent and decreases to end at about 5.3 percent. Canadian finance paper starts at about 5.5 percent and increases to about 6 percent in 2000:Q2.Then it decreases to end at about 4.5 percent. Euro-area interbank starts at about 3.5 percent and increases to about 4.8 in 2000:Q4. It then decreases to end at about 4.5 percent. Japanese CD starts at about 0 and increases to about 0.1 percent in 2000:Q3 then it ends at about 0 percent in 2001:Q3. 
Foreign interest rates. By percent. Long-term (ten-year government bonds). Line chart with four series (Canada, United Kingdom, Germany, and Japan). Date range is 2000:Q1 to 2001:Q3. They start in early 2000:Q1. Canada starts at 6.5 percent. From 2000:Q1 to 2001:Q2 it fluctuates between about 5.2 and 6.3 percent and ends at about 5.9 percent. The United Kingdom and Germany track closely together. They start at about 5.7 percent, then decrease to about 4.5 percent in 2001:Q2. Both lines end at about 5.3 percent. Japan starts at about 1.9 percent and  decreases to end at about 1.6 percent in 2001:Q3. Note: The data are weekly and extend through July 11, 2001.

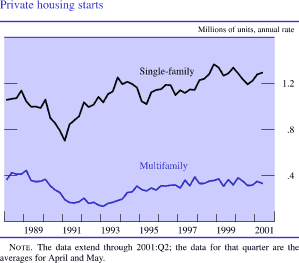
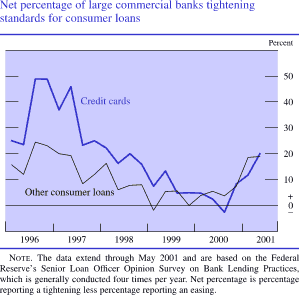
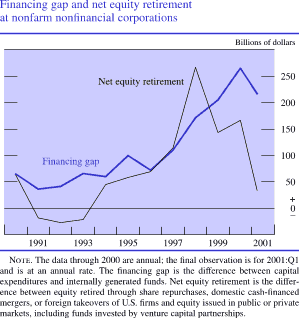
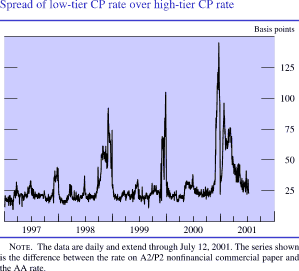
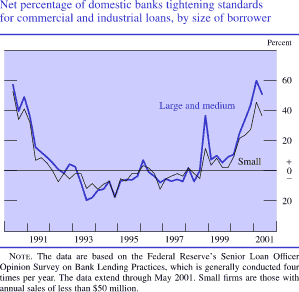
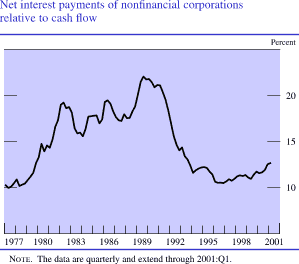
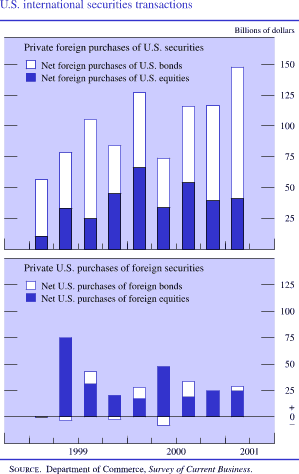
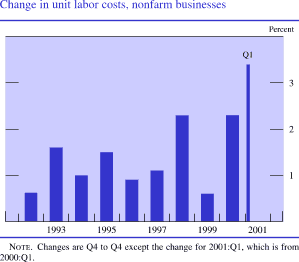
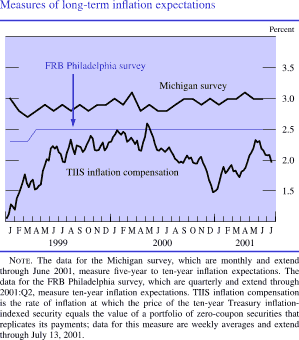
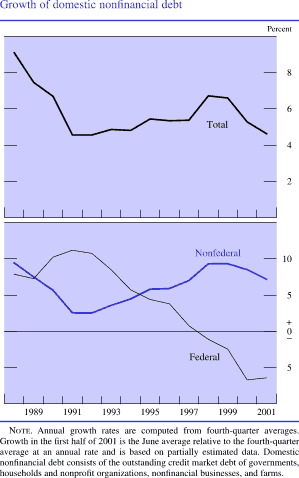
Slower U.S. growth, monetary easing by the Federal Reserve, fluctuations in U.S. stock prices, and the large U.S. external deficit have not undermined dollar strength. After the December 2000 FOMC meeting, the dollar lost ground against the major currencies; but shortly after the FOMC's surprise rate cut on January 3, the dollar reversed all of that decline as market participants evidently reassessed the prospects for recovery in the United States versus that in our major trading partners. The dollar as measured by a trade-weighted index against the currencies of major industrial countries gained in value steadily in the first three months of 2001, reaching a fifteen-year high in late March. Continued flows of foreign funds into U.S. assets appeared to be contributing importantly to the dollar's increase. Market reaction to indications that the U.S. economy might be headed toward a more prolonged slowdown undercut the dollar's strength somewhat in early April, and the dollar eased further after the unexpected April 18 rate cut by the FOMC. However, the dollar has more than made up that loss in recent months as signs of weakness abroad have emerged more clearly. On balance, the dollar is up about 7 percent against the major currencies so far this year; against a broader index that includes currencies of other important trading partners, the dollar has appreciated 5 percent.

Nominal U.S. dollar exchange rates. Exchange rate indexes. Line chart with two series (major currencies and broad). Date range is 2000:Q1 to 2001:Q3. Week ending January 5, 2000 = 100. Major currencies and broad track very closely together. They start at about 100 in early 2000 and then increase to about 104 in 2000:Q2, with major currencies being slightly higher. From 2000:Q3 to 2001:Q3 broad fluctuates between about 102.5 and 110. It then ends at about 111. Major currencies fluctuates between about 107.5 and 114 from 2000:Q3 to 2001:Q3. It then ends at about 115. 
Nominal U.S. dollar exchange rates. Selected bilateral rates. Line chart with four series (U.K. pound, Euro, Japanese yen, and Canadian dollar). Date range is 2000:Q1 to 2001:Q3. Week ending January 5, 2000 = 100. As shown in the figure, Euro starts at about 99, then generally increases to about 112.5 in 2000:Q2. In 2000:Q4 it increases to about 122 and generally decreases to about 107 in early 2001. It then increases to about 118 in 2001:Q2 and ends at about 120 in 2001:Q3. U.K. pound starts at about 100, then generally increases to about 116 in 2000:Q3. Then it decreases to about 109 in 2001:Q1 and increases to end at about 115. Canadian dollar starts at about 100, then increases to about 107.5 by the end of 2000. Then it decreases to about 103.5 in early 2001 and increases to end at about 105. Japanese yen starts at about 100, then generally increases to about 121 in 2001:Q1 and ends at about 122. Note: The data are weekly and extend through July 11, 2001. Indexes (top panel) are trade-weighted averages of the exchange value of the dollar against major currencies and against the currencies of a broad group of important U.S. trading partners. Bilateral rates (bottom panel) are in foreign currency units per dollar.

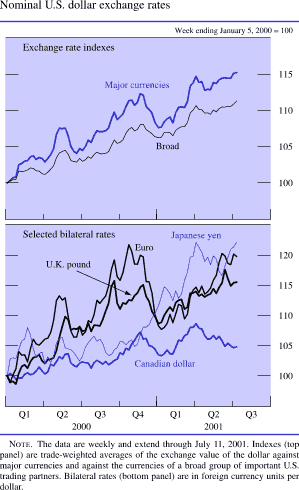
The dollar has gained about 9 percent against the yen, on balance, as the Japanese economy has remained troubled by structural problems, stagnant growth, and continuing deflation. Industrial production has been falling, and real GDP declined slightly in the first quarter, with both private consumption and investment contracting. Japanese exports also have sagged because of slower demand from many key trading partners. Early in the year, under increasing pressure to respond to signs that their economy was weakening further, the Bank of Japan (BOJ) slightly reduced the uncollateralized overnight call rate, its key policy interest rate. By March, the low level of equity prices, which had been declining since early 2000, was provoking renewed concerns about the solvency of Japanese banks. In mid-March, the BOJ announced that it was shifting from aiming at a particular overnight rate to targeting balances that private financial institutions hold at the Bank, effectively returning the overnight rate to zero; the BOJ also announced that it would continue this easy monetary stance until inflation moves up to zero or above. After the yen had moved near the end of March to its weakest level relative to the dollar in more than four years, Japanese financial markets were buoyed by the surprise election in May of Junichiro Koizumi to party leadership and thereby to prime minister. The yen firmed slightly for several weeks thereafter, but continued weak economic fundamentals and increased market focus on the daunting challenges facing the new government helped push the yen back down and beyond its previous low level.

At the start of 2001, economic activity in the euro area had slowed noticeably from the more rapid rates seen early last year but still was fairly robust. Average GDP growth of near 2 percent was only slightly below estimated rates of potential growth, although some key countries (notably Germany) were showing signs of faltering further. Although high prices for oil and food had raised headline inflation, the rate of change of core prices was below the 2 percent ceiling for overall inflation set by the European Central Bank (ECB). The euro also was showing some signs of strength, having moved well off the low it had reached in October. However, negative spillovers from the global slowdown started to become more evident in weaker export performance in the first quarter, and leading indicators such as business confidence slumped. Nevertheless, the ECB held policy steady through April, as further weakening of the euro against the dollar (following a trend seen since the FOMC's rate cut in early January), growth of M3 in excess of the ECB's reference rate, and signs of an edging up of euro-area core inflation were seen as militating against an easing of policy.

In early May, the ECB surprised markets with a 25 basis point reduction of its minimum bid rate and parallel reductions of its marginal lending and deposit rates. In explaining the step, the ECB noted that monetary developments no longer posed a threat to price stability and projected that moderation of GDP growth would damp upward price pressure. The euro has continued to fall since then and, on balance, has declined 9 percent against the dollar since 
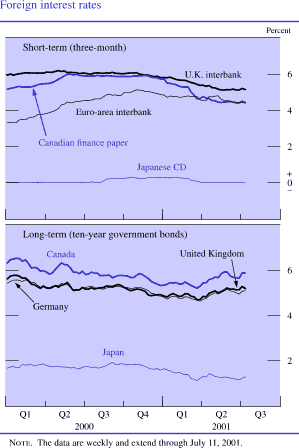
the beginning of the year. Faced with a similar slowdown in the U.K. economy that was exacerbated by the outbreak of foot-and-mouth disease, the Bank of England also cut its official call rate three times (by a total of 75 basis points) during the first half of the year. The Labor Party's victory in parliamentary elections in early June seemed to raise market expectations of an early U.K. euro referendum and put additional downward pressure on sterling, but that was partly offset by signs of stronger inflationary pressure. On balance, the pound has lost about 6 percent against the dollar this year, while it has strengthened against the euro.

The exchange value of the Canadian dollar has swung over a wide range in 2001. In the first quarter, the Canadian dollar fell about 5 percent against the U.S. dollar as the Canadian economy showed signs of continuing a deceleration of growth that had started in late 2000. Exports--especially autos, auto equipment, and electronic equipment--suffered from weaker U.S. demand. Softer global prices for non-oil commodities also appeared to put downward pressure on the Canadian currency. With inflation well within its target range, the Bank of Canada cut its policy rate several times by a total of 125 basis points. So far this year, industries outside of manufacturing and primary resources appear to have been much less affected by external shocks, and domestic demand has maintained a fairly healthy pace. Since the end of March, the Canadian dollar has regained much of the ground it had lost earlier and is down about 2 percent on balance since the beginning of the year.

Global financial markets were rattled in February by serious problems in the Turkish banking sector. Turkish interest rates soared and, after market pressures led authorities to allow the Turkish lira to float, it experienced a sharp depreciation of more than 30 percent. An IMF program announced in mid-May that will bring $8 billion in support this year and require a number of banking and other reforms helped steady the situation temporarily, but market sentiment started to deteriorate again in early July.

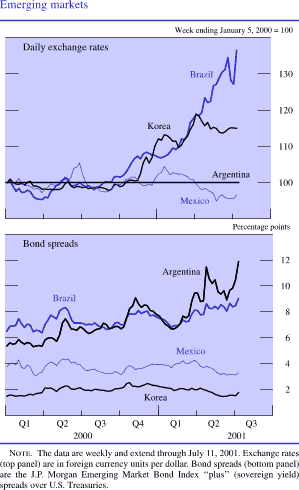
In Argentina, the weak economy and the government's large and growing debt burden stoked market fears that the government would default on its debt and alter its one-for-one peg of the peso to the dollar. In April, spreads on Argentina's internationally traded bonds moved up sharply, and interest rates spiked. In June, the government completed a nearly $30 billion debt exchange with its major domestic and international creditors aimed at alleviating the government's cash flow squeeze, improving its debt amortization profile, and giving it time to enact fiscal reforms and revive the economy. Argentine financial conditions improved somewhat following agreement on the debt swap. However, this improvement proved temporary, and an apparent intensification of market concerns about the possibility of a debt default triggered a sharp fall in Argentine financial asset prices at mid-July. This financial turbulence in Argentina negatively affected financial markets in several other emerging market economies. The turmoil in Argentina took a particular toll on Brazil, where an energy crisis added to other problems that have kept growth very slow since late last year. Intervention purchases of the real by the Brazilian central bank and a 300 basis point increase in its main policy interest rate helped take some pressure off the currency, but the real has declined about 24 percent so far this year.

Emerging markets. Daily exchange rates. Line chart with four series (Brazil, Korea, Argentina, and Mexico) starting at about 100. Date range is 2000:Q1 to 2001:Q3. Week ending January 5, 2000 = 100. Argentina stays at about 100 from 2000:Q1 through 2001:Q3. Mexico increases to about 105 in 2000:Q2, then fluctuates between about 98 and 103 and ends at about 97.5 in 2001:Q3. Korea fluctuates between about 98 and 101 until 2000:Q4, then generally increases to about 118 and ends at about 115. Brazil decreases to about 96 in 2000:Q1, then generally increases to end at about 138.


Emerging markets. Bond spreads. Percentage points. Line chart with four series (Brazil, Korea, Argentina, and Mexico). Date range is 2000:Q1 to 2001:Q3. Brazil starts at about 6.5 percent in early 2000, then increases to about 8.2 percent in 2000:Q2. In 2001:Q1 it decreases to about 7 percent and then increases to end at about 9 percent. Argentina starts at about 5.5 percent in early 2000 and then  increases to about 9 percent in 2000:Q4. In 2001:Q1 it decreases to about 7 percent and generally increases to end at about 12 percent. Mexico starts at about 3.9 percent in early 2000.Then it fluctuates between about 3 and 4.1 percent by 2001:Q2 and ends at about 3.7 percent. Korea starts at about 1.7 percent in early 2000. Then it fluctuates between 2.6 and 1.7 percent by early 2001 and ends at about 1.9 percent. Note: The data are weekly and extend through July 11, 2001. Exchange rates (top panel) are in foreign currency units per dollar. Bond spreads (bottom panel) are the J.P. Morgan Emerging Market Bond Index "plus" (sovereign yield) spreads over U.S. Treasuries.

The weak performance of the Mexican economy at the end of last year caused largely by a fall in exports to the United States (notably including a sharp drop in exports of automotive products) and tight monetary policy carried over into early 2001. With inflation declining, the Bank of Mexico loosened monetary policy in May for the first time in three years. Problems with Mexican growth did not spill over to financial markets, however. The peso has remained strong and is up about 3 percent so far this year, and stock prices have risen.

Average growth in emerging Asia slowed significantly in the first half; GDP grew more slowly or even declined in economies that were more exposed to the effects of the global drop in demand for high-tech products. Average growth of industrial production in Malaysia, Singapore, and Hong Kong, for example, fell from a 15 percent annual rate in late 2000 to close to zero in mid-2001. The turnaround of the high-tech component of industrial production in those countries was even more abrupt--from more than a 30 percent rate of increase to a slight decline by midyear. In the Philippines and Indonesia, economic difficulties were compounded by serious political tensions. Currencies in many of these countries moved down versus the dollar, and stock prices declined. In Korea, the sharp slump in activity that began late last year continued into 2001, as weakness in the external sector spread to domestic consumption and investment. The Bank of Korea lowered its target interest rate a total of 50 basis points over the first half of the year in response to the weakening in activity. The Chinese economy, which is less dependent on technology exports than many other countries in the region, continued to expand at a brisk pace in the first half of this year, as somewhat softer export demand was offset by increased government spending.

Section 1


Home | News and events | Monetary policy | July 2001 report
Accessibility | Contact Us
Last update: July 16, 2013