The Federal Reserve Board eagle logo links to homepage
Joint Press Release Board of Governors of the Federal Reserve System
Federal Deposit Insurance Corporation
Office of the Comptroller of the Currency


For Immediate Release
October 8, 2002

Bank Regulatory Agencies Find Adversely Rated Syndicated Loans Continue to Increase in 2002, but at Slower Rate than Previous Year

WASHINGTON -- The quality of large syndicated bank loans continued to deteriorate this year, but at a slower rate than was evident in 2001, according to the 2002 Shared National Credit (SNC)1 review, which federal bank regulators released today. The deterioration was consistent with general economic, sectoral, and credit market trends.

The results -- reported by the Board of Governors of the Federal Reserve System, the Office of the Comptroller of the Currency and the Federal Deposit Insurance Corporation -- are based on analyses that were prepared during the second quarter and reflect business and economic conditions that prevailed at that time.

For the 2002 review, total loan commitments classified as either substandard, doubtful or loss rose by $39.4 billion or 34 percent over the previous year, compared to a net increase of $54.3 billion or 86 percent the year before. At the same time, commitments rated special mention rose $3.6 billion or 5 percent compared to $39.1 billion or 108 percent the year before.

Adversely rated credits are the total of loans classified substandard, doubtful, and loss and loans rated special mention. Under the agencies' Uniform Loan Classification Standards, classified loans have well defined weaknesses, including default in some cases, while special mention loans exhibit potential weaknesses, which may result in further deterioration if left uncorrected.

Deterioration since the middle of last year was largely driven by the pronounced problems in the telecommunication sector, alleged corporate fraud, weakness from the recent recession, and the after-effects of September 11th. Similar to last year, deterioration has been particularly evident for credits to leveraged and speculative-grade borrowers that are facing difficulty generating sufficient cash flow to service their debts because of over capacity, weaker pricing or slower than anticipated growth. At the same time, certain market segments have shown moderate improvement, with the professional, scientific, financial, insurance and other service sectors showing lower classification levels relative to 2001.

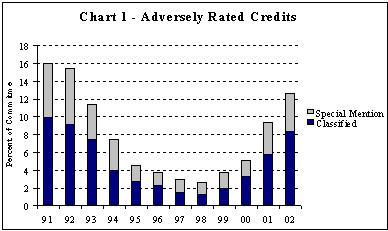
In 2002, the SNC Program covered 9,328 credits totaling $1.9 trillion in loan commitments to 5,542 borrowers. Of the total commitments, $692 billion was advanced and outstanding. Classified credits totaled $157.1 billion, or 8.4 percent of total commitments, up from $117.6 billion or 5.7 percent in 2001. At the same time, loans listed for special mention rose to 4.2 percent of total commitments, from 3.7 percent in 2001. On a combined basis, special mention and classified loans represent 12.6 percent of total commitments, up from 9.4 percent a year ago but still below the peak of 16 percent in 1991 (see Chart 1 and Appendix A). None of these figures include the effects of hedging or other techniques that individual organizations might have employed to mitigate risk.

Chart 1 - Adversely Related Credits

Of particular note for 2002 was a record $19.6 billion in commitments characterized as loss, up $11.6 billion from the year before. Of that total, $7.6 billion or 39 percent was attributable to the telecommunication and cable industries.

Of the $1.9 trillion in total SNC commitments, U.S. banking organizations2 and foreign banking organizations (FBO) each held 45 percent of the exposures, and nonbank firms held the remaining 10 percent (see top panel of Table 1). Since 2000, the share of commitments held by U.S. banks has fallen somewhat, while the nonbank share has grown. For 2002, the rate of deterioration for credits held by these groups has differed markedly, with U.S. banking organizations experiencing an 11 percent increase in classifieds, compared to 39 percent for FBOs and 68 percent for nonbanks. Classifications as a percent of commitments also showed a wide range with U.S. banks exhibiting lower overall problems relative to FBOs or nonbanks (see bottom panel).

Table 1 - Exposures by Entity Type

2002

2001

2000

Share of Total Commitments (%)


U.S. Bank

45%

46%

48%

FBO

45%

46%

45%

Nonbank

10%

8%

7%


Total Classifications ($ billions)


U.S. Bank

54.4

48.8

26.6

FBO

61.8

44.4

22.8

Nonbank

41.0

24.4

13.9

Total

157.1

117.6

63.4


Total Classifications (% increase)


U.S. Bank

11%

83%

72%

FBO

39%

95%

69%

Nonbank

68%

75%

65%

Total

34%

86%

69%


Classified as % of Commitments


U.S. Bank

6.5%

5.2%

2.8%

FBO

7.3%

4.7%

2.6%

Nonbank

22.6%

14.5%

10.2%

Total

8.4%

5.7%

3.2%

The significantly higher classification rate for nonbanks is consistent with market observations that nonbanks have largely focused on subinvestment grade investments and have been purchasers of distressed loans in the secondary market at discounts to par value; all dollar amounts in this release are par amounts. In addition, nonbanks and U.S. banks each held 27 percent of the loss classification, while FBOs held the remaining 46 percent.

Over the past year, the telecommunication and cable industries experienced the steepest decline in quality, with three-quarters of the $40 billion increase in SNC classifieds attributable to this segment. For 2002, total classifications for the sector soared to 27.0 percent of total commitments, compared to 3.9 percent the year before (see bottom panel of Table 2).

Table 2 - Telecom & Cable Classifications (2002)

    Telecom-Related Held By:
Committed Amounts ($Bill) Total
Telecom
U.S.
Banks
FBOs Nonbanks
Substandard
23.6
7.8
8.9
6.9
Doubtful
5.0
1.2
2.8
1.0
Loss
7.6
1.8
3.2
2.6
Total Classified
36.3
10.8
15.0
10.5
Special Mention
7.9
2.3
3.1
2.4
Total Criticized
44.2
13.1
18.1
12.9
   % share
100%
30%
41%
29%
Classified as % of Commitment
2002
27.0%
24.0%
25.0%
35.8%
2001
3.9%
3.3%
3.3%
10.0%
SNC Commitments Held ($Bill)
2002
134.4
45.0
60.0
29.4
2001
162.2
59.2
74.1
28.9
Share of Telecom Held (%)
2002
100%
34%
45%
22%
2001
100%
36%
46%
18%
 

The second largest increase in classifications was attributable to the oil, gas, pipelines and utilities industries, with a $12.7 billion increase and a classification rate of 7.5 percent, compared to 1.9 percent the year before (see Appendix B). Special mention credits for this segment more than doubled and amounted to 6.9 percent of commitments. Although the manufacturing industry exhibits the largest dollar volume of classified and criticized assets within the SNC portfolio, the rate of deterioration has diminished markedly from the prior year, with classifieds growing just 5 percent. The 1.5 percentage point rise in the manufacturing classification rate to 12.1 percent is largely a function of an 8 percent decline in outstanding commitments, rather than a marked growth in problem credits. On the positive side, classifications in the professional, scientific and other services industry fell by $3.9 billion, and classifieds for financial services and insurance industries declined by $3.0 billion.

For the most part, banking organizations have been vigilant in identifying problem credits and reflecting deterioration in the quality of syndicated loans in their internal credit ratings. A combination of factors, including strong earnings and capital bases, coupled with diverse revenue sources and balance sheets have allowed U.S. banking organizations to absorb deteriorating credit conditions over the past three years without the disruption experienced a decade ago. Nevertheless, banking organizations must continue to be vigilant in the current environment to ensure that they promptly identify and address any continuation in credit quality deterioration and adjust loans loss allowance levels appropriately.3

Media Contacts: OCC Dean DeBuck(202)874-4876
FDIC David Barr (202)898-6992
Federal Reserve Board David Skidmore (202)452-2955

Appendix A

Summary of Shared National Credit Trends

Committed Balances
(Dollars in Billions)

Year Special Mention Sub-standard Doubtful Loss Total Classified Total Adversely Rated Total Committed Total Outstanding
1991 49.2 65.5 10.8 3.5 79.8 129.0 806 #
1992 50.4 56.4 12.8 3.3 72.5 122.9 798 #
1993 31.4 50.4 6.7 3.5 60.6 92.0 806 331
1994 31.5 31.1 2.7 2.3 36.1 67.6 893 298
1995 18.8 25.0 1.7 1.5 28.2 47.0 1,063 343
1996 16.8 23.1 2.6 1.4 27.1 43.9 1,200 372
1997 19.6 19.4 1.9 0.9 22.2 41.8 1,435 423
1998 22.8 17.6 3.5 0.9 22.0 44.8 1,759 561
1999 31.3 31.0 4.9 1.5 37.4 68.7 1,829 629
2000 36.3 47.9 10.8 4.7 63.4 99.7 1,951 705
2001 75.5 87.0 22.6 8.0 117.6 192.8 2,050 769
2002 79.0 112.0 25.5 19.6 157.1 236.1 1,871 692

# - Data are not available.

Appendix B

Summary of SNC Industry4 Trends 2000-2002 ($Billions)

Industry

2002 2001 2000

Telecommunication & Cable


Commitment

134.4

162.2

139.7

Classified

36.3

6.5

2.1

Special Mention

7.9

11.8

3.4

  % Classified

27.0%

4.0%

1.5%

  % Special Mention

5.9%

7.3%

2.4%


Manufacturing


Commitment

499.0

543.7

574.7

Classified

60.2

57.4

19.6

Special Mention

24.7

25.9

18.3

  % Classified

12.1%

10.6%

3.4%

  % Special Mention

4.9%

4.8%

3.2%


Professional, Scientific, & Other Services


Commitment

98.5

123.4

180.2

Classified

7.8

11.7

13.2

Special Mention

1.6

2.4

4.0

  % Classified

7.80%

9.5%

7.3%

  % Special Mention

1.6%

1.9%

2.2%


Oil, Gas, Pipeline & Utilities


Commitment

226.1

224.5

174.5

Classified

17.0

4.3

4.0

Special Mention

15.5

7.0

1.0

  % Classified

7.5%

1.9%

2.3%

  % Special Mention

6.9%

3.1%

0.6%


Construction, Real Estate, Lodging & Transportation


Commitment

182.9

199.0

106.4

Classified

9.3

7.8

1.4

Special Mention

10.3

1.0

3.4

  % Classified

5.1%

3.9%

1.3%

  % Special Mention

5.6%

2.7%

0.9%


Financial Services & Insurance


Commitment

410.0

460.1

504.0

Classified

9.0

12.0

14.3

Special Mention

3.7

4.3

2.4

  % Classified

2.2%

2.6%

2.8%

  % Special Mention

0.9%

0.9%

0.5%


All Other


Commitment

320.3

337.5

271.5

Classified

17.5

18.0

8.7

Special Mention

15.2

18.7

6.1

  % Classified

5.5%

5.3%

3.3%

  % Special Mention

4.8%

5.5%

2.3%


All Industries (Total)


Commitment

1,871.2

2,050.4

1,951.0

Classified

157.1

117.6

63.4

Special Mention

79.0

75.4

36.3

  % Classified

8.4%

5.7%

3.2%

  % Special Mention

4.2%

3.7%

1.9%


Endnotes

1. The Shared National Credit (SNC) Program was established in 1977 by the Board of Governors of the Federal Reserve System, the Federal Deposit Insurance Corporation, and the Office of the Comptroller of the Currency to provide an efficient and consistent review and classification of large syndicated loans. The annual program covers loans or loan commitments of at least $20 million that are shared by three or more financial institutions. Return to text

2. To better reflect ultimate ownership, in this year's press release U.S. banks are defined to exclude U.S. chartered subsidiaries of foreign banking organizations for the years 2000 through 2002. Last year's press release data included those subsidiaries under U.S. banks, even if they were consolidated under the FBO's worldwide banking organization. Return to text

3. For further guidance, institutions should refer to the July 12, 1999 Joint Interagency Letter to Financial Institutions on the allowance for loan losses, as well as the December 1993 Interagency Policy Statement on the Allowance for Loan and Lease Losses. Return to text

4. Due to the recent conversion of industry classification codes (from SIC to NAICS), the specificity of 2002 and 2001 data exceeds that available for 2000. Accordingly, consistent year-to-year comparisons of industry sector information are not always possible. NAICS groupings of industries identified in Appendix B for 2002 and 2001 are as follows: Telecommunication & Cable (5132 through 51339); Manufacturing - 31 to 33; Professional, Scientific, and Other Services - 54, 55, 56, 61, 62; Oil, Gas, Pipelines, and Utilities - 21 (oil- & gas-related only), 22, 486; Construction, Real Estate, Lodging and Transportation - 23, 48 (excluding 486), 49, 53, 72; Finance and Insurance - 52; All Other - Remaining NAICS codes. Return to text

2002 Banking and consumer regulatory policy


Home | News and events
Accessibility
Last update: October 8, 2002