| Remarks by Vice Chairman Roger W. Ferguson, Jr. At the Stanford Institute for Economic Policy Research, Stanford, California Presented at the Real Estate Roundtable, Washington, D.C. January 27, 2005 January 12, 2005 Recessions and Recoveries Associated with Asset-Price Movements: What Do We Know? |
|
Thank you for inviting me to address the associates of the Stanford Institute for Economic Policy Research; it is a pleasure to be here. As you know, the U.S. economy is currently continuing its recovery from the relatively mild recession in 2001, which ended the longest period of economic expansion in our nation's recorded business-cycle history. The 1990s will be remembered not only for this remarkably long period of prosperity but also for the excitement of the "new economy" and, less happily, for the sharp decline in equity prices that marked its end. This market correction was most dramatic in sectors of the economy associated with new technologies, the very sectors that had experienced the most pronounced run-up in equity prices. The quick occurrence of a recession following soon after this significant asset-price correction prompted some observers to suggest that the boom-bust cycle in asset valuations was the proximate trigger of the economic downturn But a number of aspects of that argument have not yet been fully examined. In the interest of advancing the understanding on this issue, I will use this opportunity to provide a retrospective on the performance of the U.S. economy and of some other industrialized economies during and following recessions over the past three decades or so. In particular, I will focus on the role that asset prices may have played in expansions and recessions.1 Before going any further, however, I should emphasize that the views I will express today are my own and are not necessarily shared by my colleagues in the Federal Reserve System.
What Happens during Asset-Price Run-Ups? Similarly, asset prices also affect business balance sheets. Rising prices for assets raise the net worth of companies that own the assets. The value of the assets that a borrower owns is an important determinant of his or her creditworthiness. In the event of a default and foreclosure on a secured debt, collateral that caries a high price provides the lender with a high recovery rate, which makes lending less risky. During an asset-price boom, the creditworthiness of borrowers rises, the interest rates at which they borrow decline because of lower risk spreads, and business investment increases as firms take advantage of the relatively lower interest rates they face. A consequence of the positive influence of asset prices on investment is that if prospects for profitability as reflected in asset prices in one sector of the economy are advancing relative to asset prices in all other sectors, investment in that sector will outpace investment in the rest of the economy, all else equal. This circumstance may have important and potentially adverse allocative consequences on the economy. In particular, if asset prices do not accurately reflect the productive potential of the underlying asset, investment will be channeled to the wrong sectors. However, an asset-price boom in a specific sector might simply reflect investor expectations of higher productivity rather than a bubble, a term I will define in a few moments. Investment would still tend to be channeled to that sector, but for good reason in this instance. One example of a sector-specific jump in asset prices and an associated investment increase is the case of the U.S. technology sector in the late 1990s. Over the five years from the end of 1994 to the end of 1999, prices of nontech stocks tripled while those of tech stocks more than quintupled.3 Correspondingly, the average level of real investment in computers and other high-tech capital goods was more than 100 percent higher over the 1995-99 period than its level during 1994, while spending on other types of fixed capital was only about 15 percent higher than in 1994.
Asset-Price Busts Recessions are almost always accompanied by asset-price declines. But such declines sometimes appear to be the source of adverse surprises, and asset-price busts may subsequently have disproportionately adverse consequences. Falling asset prices create a negative wealth effect and restrain consumption. By making collateral less valuable, they also increase the risk of lending to businesses and thereby worsen the lending terms faced by borrowers. When asset prices fall substantially, lenders may also find themselves holding substantial amounts of nonperforming loans that are backed by what may have become, in some cases, worthless collateral. For this reason, recessions that are preceded by asset-price booms and busts may also be associated with problems in the banking industry. In such episodes, the ensuing loss of intermediation may serve as an additional force acting to prolong and deepen what might otherwise have been a milder recession. Concerns about the severity of downturns that follow significant asset-price collapses suggest that the identification and analysis of boom-bust asset-price cycles could be useful for policy. For that reason, I would next like to briefly review some of the issues associated with detecting asset-price bubbles.
Detecting Bubbles Ascertaining the existence of bubbles in practice is a very different matter. An immediate difficulty is that the theoretical notion of the fundamental price does not have an easily measured empirical counterpart. In part as a result of this measurement problem, statistical tests using historical data cannot easily distinguish bubbles from failures of the standard asset-pricing model in some other dimensions, or no failure of the model at all. Indeed, for every study of historical data that finds evidence of a bubble, often another shows that the findings could be explained by an alternative specification of the fundamentals in the absence of bubbles. 7 That is, even with the benefit of hindsight, statistical tests attempting to confirm the existence of bubbles in historical episodes can remain inconclusive. Of greater relevance for policy discussions, however, is not whether economists can identify a bubble long after it occurs, but whether the presence of a bubble could be detected in real time, when the information might be useful for policy decisions. Unfortunately, detection of a bubble, which is problematic even ex-post, is an even more formidable task and arguably becomes virtually impossible in real time. Indeed, in real time, it is not uncommon for economists and market participants to fail to recognize important shifts in underlying trends that may subsequently be viewed as the source of significant changes in market fundamentals. Current statistical methods are simply not up to the task of "detecting" asset-price bubbles, especially not in real time, when it matters most.8 "Detecting" a bubble appears to require judgment based on scant evidence. It entails asserting knowledge of the fundamental value of the assets in question. Unsurprisingly, central bankers are not comfortable making such a judgment call. Inevitably, a central bank claiming to detect a bubble would be asked to explain why it was willing to trust its own judgment over that of investors with perhaps many billions of dollars on the line. The issue of detecting bubbles notwithstanding, it is of interest to know whether recessions related to sizeable asset-price busts differ from other recessions in some way that might be important for policy considerations.
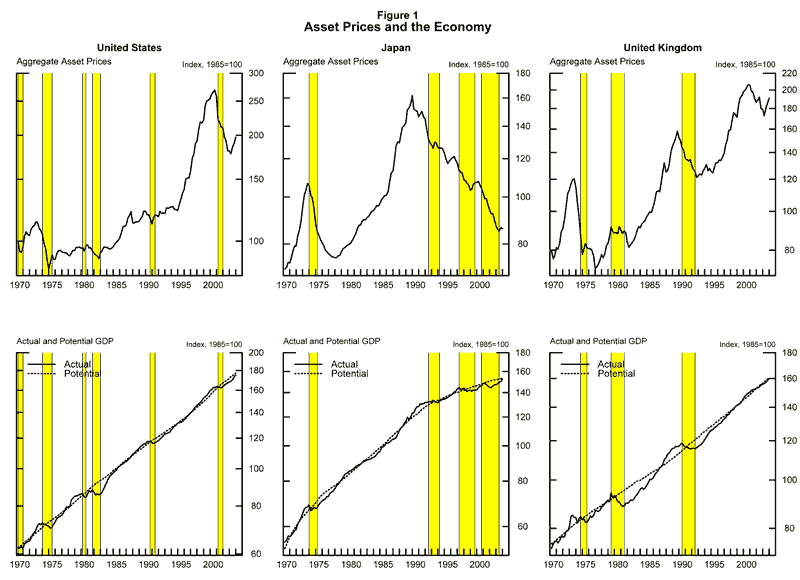
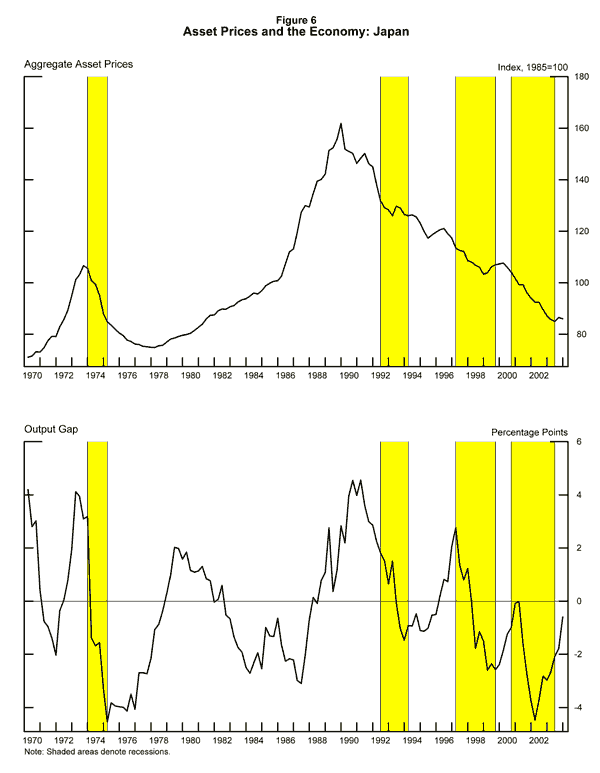
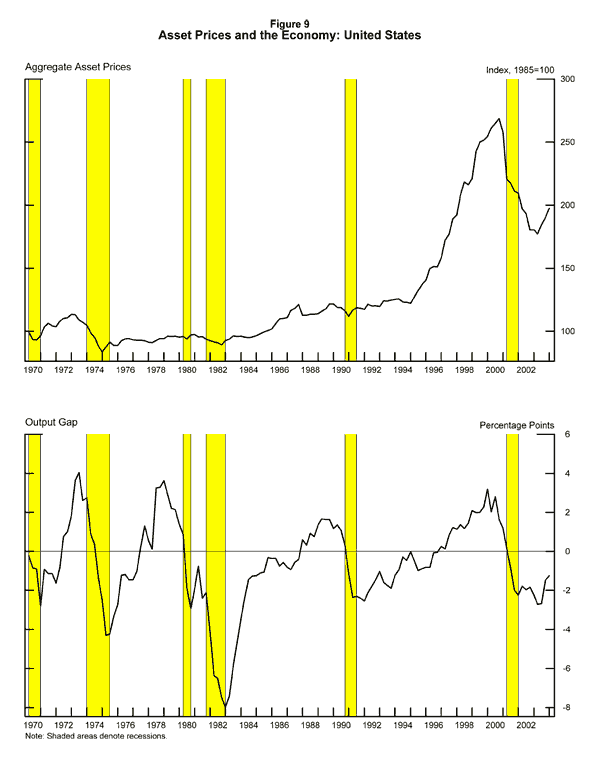
Are Recessions That Are Related to Asset-Price Busts Different? Additionally, can one make any other generalizations concerning recessions that follow asset-price booms and busts and how they differ from other recessions? To address those questions, it is instructive to examine recession episodes in the Group of Seven economies since 1970. Figure 1 presents a bird's-eye view of the evolution of asset prices and the economy from 1970 to 2003 for three of these economies, the United States, the United Kingdom, and Japan.9 For each country, the top panel of the figure shows the evolution of an aggregate inflation-adjusted index of asset prices--which consists of an average of stock prices and residential and commercial real estate prices. The shaded areas cover recession periods, as determined by the business cycle dating committee of the National Bureau of Economic Research in the United States, and a comparable methodology for the other countries.10 The bottom panels show the evolution of gross domestic product in these economies together with a historical estimate of the economy's potential. 11 |
|
The relationship of asset prices to the economy near turning points shows varying patterns (figure 1, top and bottom panels). In some episodes, asset-price declines do not appear to have preceded the recession. During some recessions, asset prices appear to have simply moved sideways, not registering substantial declines at all. But in other episodes, significant asset-price booms and subsequent declines do appear before the onset of a recession and continue during the downturn. For the United States, for example, the figure highlights the long run-up and subsequent fall in asset prices before the 2001 recession. The size of these recent movements dominates earlier boom-bust cycles in the U.S. economy in this sample. For Japan, one can see the remarkable run-up of the 1980s and its agonizing reversal during the 1990s. For the United Kingdom, one may notice the asset-price boom-bust cycle of the early 1970s followed by the painful recession beginning in 1974. Indeed, these three episodes stand out as perhaps the clearest suggestions of an asset-price boom-bust cycle significantly influencing or possibly triggering a subsequent recession and recovery. How do these three cyclical turning points compare with other recessions? To be sure, such a comparison rests on (1) our identification of these three episodes as the ones that appear to have been preceded by significant asset-price booms and busts and (2) separating these recessions from the rest. Such a classification necessarily involves some element of ambiguity, but the three episodes highlighted in figure 1, the U.S. recession in 2001, the Japanese recession in 1992, and the U.K. recession in 1974, do appear to stand out. 12
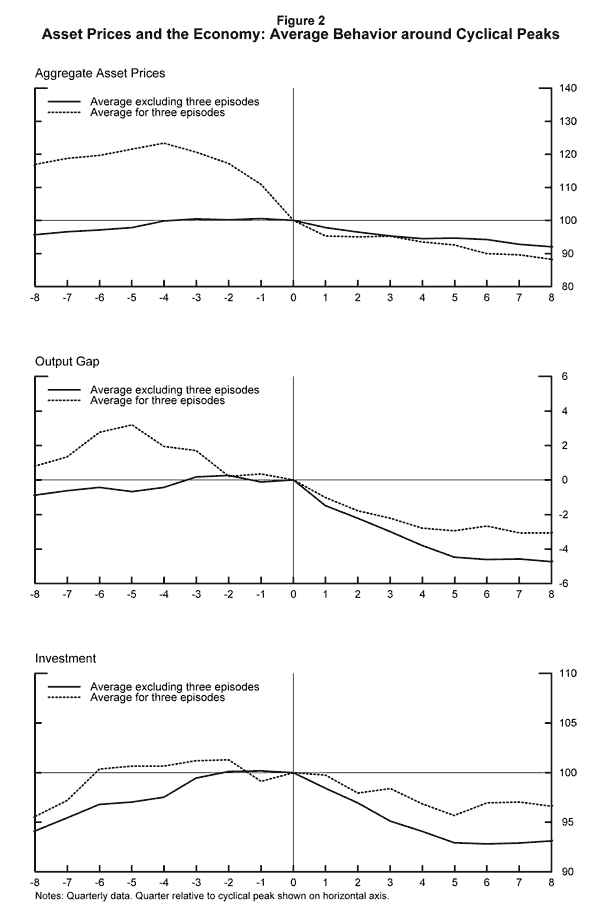
We have compared the average path of asset prices around the onset of the recession in these three episodes to the average path of asset prices in the other episodes in our sample (figure 2, top panel). The vertical line marks the quarter in which the recession began. The dotted curve shows the average of the three asset-price related episodes, and the solid curve shows the average of the remaining twenty-two recession episodes in the sample. 13 This comparison suggests that in recessions related to asset-price busts, asset prices fall before the recession more, on average, than they do in other episodes. This is, of course, as it should be, given our selection criteria for the classification of the three episodes. The more interesting question is whether these recessions are different in other dimensions as well. Consider, for example, the average paths of estimated output gaps during asset-price busts relative to the remaining recessions (figure 2, middle panel). The data are centered as they were for asset prices, but the output gap is normalized to equal zero in the first quarter of a recession. As one would expect, the output gap for both groups of episodes on average falls after recessions start, but it falls less for the asset-price-bust episodes. Finally, looking at investment (figure 2, bottom panel), the data also suggest that, on average at least, investment, like the output gap, was not affected more adversely in the three asset-price-bust episodes. If anything, these three episodes on average appear to be slightly shallower in terms of output losses and investment declines than the average of other recessions. But the comparisons of the averages provided in figure 2 could obscure valuable insights that might be obtained by looking at each of our three asset-price-bust episodes individually, as I do next.
Three Asset-Price-Bust Episodes
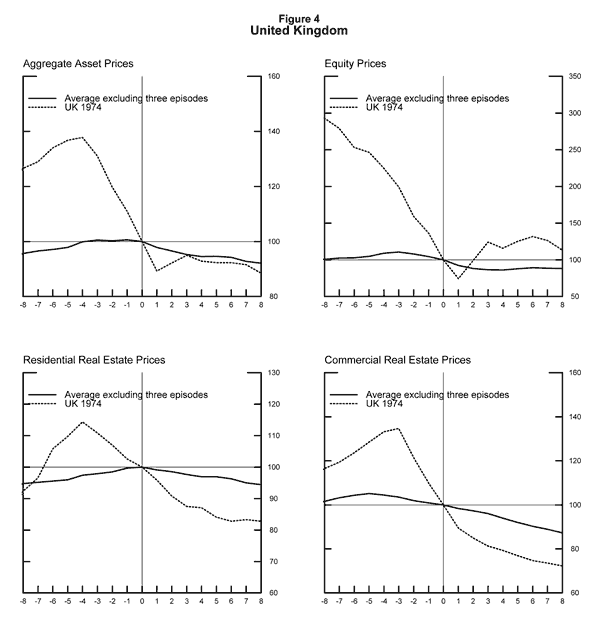
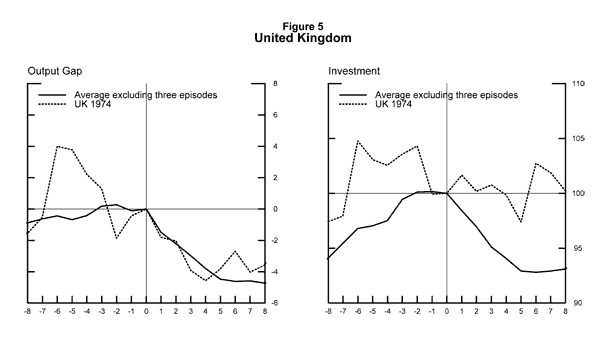
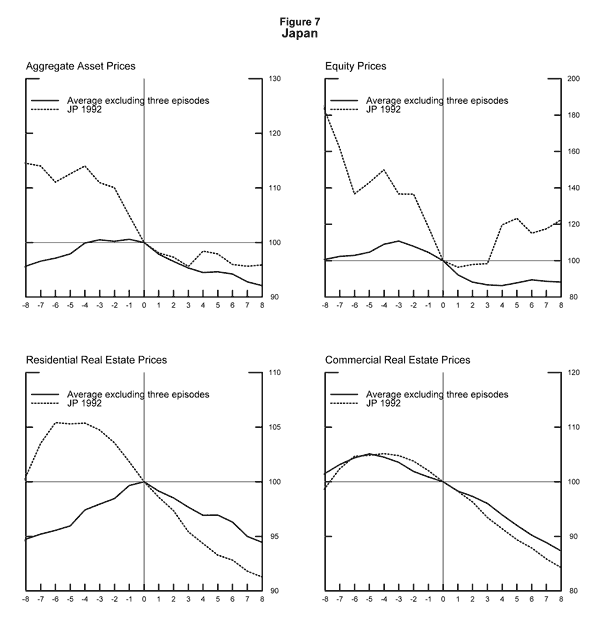
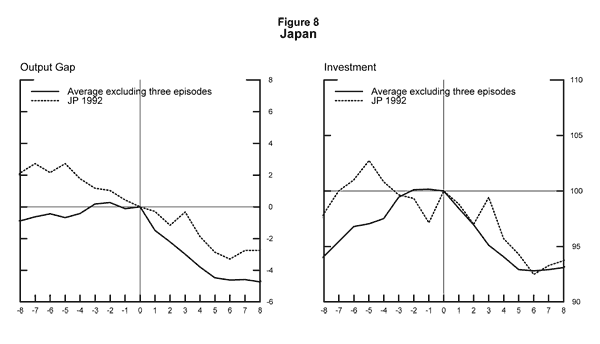
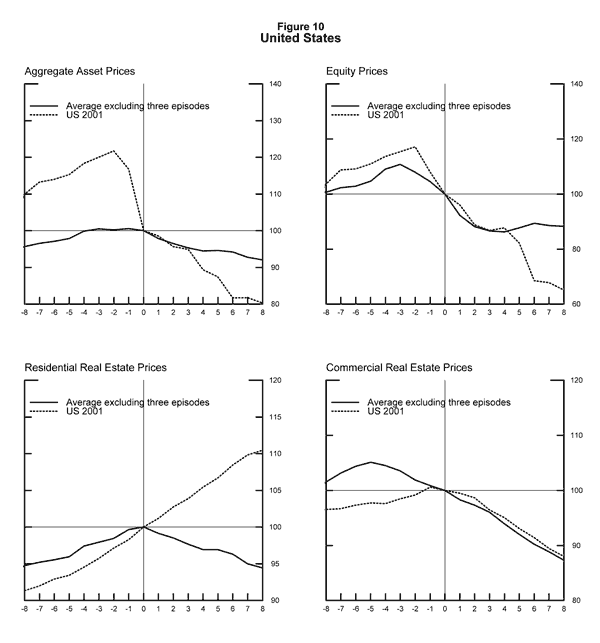
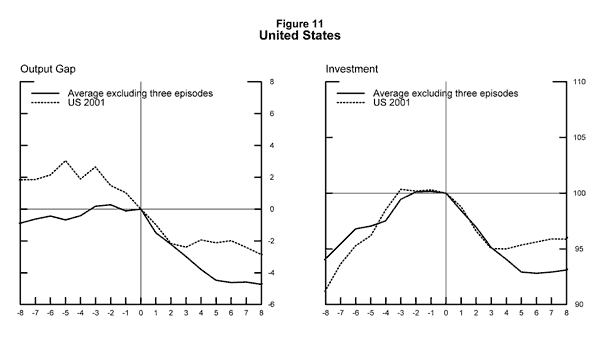
We take a closer look at the components of the aggregate asset-price index and compare their evolution around this U.K. cyclical peak to their average evolution during all recessions excluding our three asset-price-bust episodes (figure 4). Equity prices registered a remarkably sharp decline in this episode. But arguably a more distinctive characteristic of this asset-price boom-bust episode is the swing in real estate prices. Residential real estate prices, and especially commercial real estate prices (figure 4, bottom panels), also registered rather dramatic declines in this episode. It may thus be surprising that this recession does not appear to have been deeper than the average of recessions excluding the three asset-price-bust episodes. The output gap (figure 5) fell along with asset prices before the recession, but the decline was from an unsustainably overheated level. And investment (figure 5) stayed relatively strong compared with other recessions. Despite this episode being associated with rather severe declines in equity and commercial real estate prices, no evidence of an investment overhang appears in this comparison. Next, let us turn to the Japanese experience. The Japanese economy saw rapidly increasing equity and real estate prices during the 1980s (figure 6), a remarkably long period of stability and prosperity. These run-ups in asset prices were accompanied by a rapid expansion of bank credit, which was especially important for financing real estate purchases. But asset prices collapsed at the turn of the decade. This "bursting of the bubble," as the episode is often referred to by Japanese officials, was followed by a decade of relative stagnation marked by three arguably related recessions. Concentrating attention on just the first of these three recessions, beginning in 1992, proves insufficient to capture the severity of the overall problem. The detailed comparisons of the 1992 recession with other episodes (figure 7 and figure 8) do not indicate unusual weakness associated with the 1992 recession. Rather, the 1990s in Japan are more notable for the succession of incomplete recoveries than for the recessions themselves (figure 6). The bursting of the bubble importantly shaped subsequent developments in this case. The asset-price collapse hit the Japanese banking system hard, eroding bank capital. The ensuing disintermediation subsequently proved an important impediment to the economy's recovery. However, the extent of the problem was not fully appreciated at the time by policymakers. Despite steps toward an expansionary policy, the monetary easing of the early 1990s was insufficient to mitigate the underlying weakness during the expansion from 1994 to 1996. The continued fragility of the financial system arguably left the Japanese economy especially vulnerable to additional disturbances that could have otherwise been easily weathered. An economic crisis in Southeast Asia, coupled with a previously planned increase in consumption taxes, resulted in a larger-than-anticipated drag on domestic demand and set the stage for the recession that started in 1997. Following a brief recovery, monetary policy was tightened in 2000, and the third recession in a decade followed soon after. The Japanese experience offers a reminder of the importance of monitoring the health of the financial system and the need to be especially wary of signs of fragility following a period of sharp asset-price declines. It also serves to highlight how the behavior of the banking system during the asset-price run-up may influence subsequent outcomes. Lastly, it points to the potentially crucial role played by fiscal and monetary policies in recoveries following asset-price-bust recessions. Last, let us examine the U.S. recession of 2001 and the subsequent, ongoing recovery. We have prepared the U.S. data in the same manner as in the U.K. and Japanese cases (figure 9-figure 11). The evolution of disaggregated asset prices (figure 10) shows that the unusually large changes surrounding the 2001 recession reflected the movement of equity prices alone. Relative to the average episode, commercial real estate prices neither fell much during the recession nor rose a lot during the expansion. And instead of declining during the recession, residential real estate prices continued their upward trend. The behavior of real economic activity around the recent cyclical peak (figure 11) suggests a second interesting comparison. Relative to other recessions, this recession was shallow and did not appear to impart an unusual drag on investment, despite the sharp asset-price correction. Why was the 2001 recession relatively short and shallow even though the preceding swing in asset prices was so severe? In my opinion, two reasons stand out. The first regards the health of the financial sector. During the 1980s and early 1990s, the U.S. banking sector faced a succession of challenges: the savings and loan crisis of the early 1980s, the international debt crisis of the mid-1980s, waves of bank failures and consolidation, and the need to build capital in response to the adoption of the Basel I standards in 1988. But by the mid-1990s the banking sector had regained a solid footing, and regulators were careful to keep it that way. Prudential regulation coupled with good risk management meant that financial firms limited their exposure to risk during the boom years of the late 1990s. This approach paid off handsomely when the asset-price break occurred. Despite the recession, banks remained well capitalized, and their strength eliminated the threat of a vicious credit crunch or the risk of fragility in the system. As a result, the elements that appear to have been so detrimental for the recovery of the Japanese economy during the 1990s were absent during this episode. Following the "bursting of the bubble" in Japan, the banking system found itself holding a substantial amount of bad loans. And, as already seen, the woes of the banking system turned into a recessionary force in itself, curtailing the recovery. This comparison points to a useful policy lesson: A healthy financial sector and strong prudential regulation during an asset-price boom offer valuable insurance in case the boom turns to bust with an asset-price break. The second, and perhaps equally important, reason that the recent U.S. episode was unusually benign was, in my view, the quick response of policy. Both fiscal and monetary policy were eased quickly and effectively in this episode. The Federal Reserve cut the federal funds rate rapidly to create monetary accommodation and maintained conditions of substantial monetary policy ease for a considerable period well into the expansion. As well, the Administration and the Congress took quick steps early in the recession to provide fiscal stimulus that helped to prop up aggregate demand. Placing the policy response in its proper historical context may be critical for drawing the appropriate policy lessons for the future. Countercyclical fiscal and monetary policies are unlikely to have been as swift and strong during 2001 had earlier policies not set the stage for such action. On the fiscal side, the budgetary prudence of the 1990s yielded comfortable surpluses at the onset of the 2001 recession that facilitated the large fiscal policy easing. And on the monetary side, the successful completion of the last stage on the long path to price stability during the 1990s allowed substantial easing in response to the downturn. As policymakers stressed repeatedly, the prevalence of low- and well-anchored inflation expectations ultimately facilitates pursuit of such countercyclical policy. A clear lesson emerges from this experience for policy over the long haul. By pursuing fiscal prudence and price stability during booms, policymakers greatly enhance their ability to take swift, effective countercyclical action when it is needed most.
Conclusions Second, sweeping generalizations regarding asset-price-bust recessions and subsequent recoveries are not easily made. Idiosyncrasies dominate comparisons in the historical data. As such, each recession-and-recovery episode would seem to call for its own tailor-made policy response. Third, to the extent that comparisons across recessions are informative, asset-price-bust recessions do not appear to be necessarily more costly than other recession episodes. Specifically, at a macroeconomic level, recessions that follow swings in asset prices are not necessarily longer, deeper, and associated with a greater fall in output and investment than other recessions. That said, particular industrial segments and classes of investment, such as the high-tech sector in the recent U.S. episode, may suffer disproportionately during such recessions. Also, the health of the financial system, the strength of the banking sector, and the ability and willingness of policy to take appropriate countercyclical action seem to importantly influence the economic outcomes of an asset-price-bust. Which brings me to my last point: Over the long haul, preparation for a potential problem seems to be the best course of action. Prudential supervision and good risk management in banking, and the pursuit of fiscal prudence and price stability during booms, may ultimately serve as the best insurance for dealing with the inevitable occasional asset-price breaks observed in our modern economy.
Footnotes 1. My presentation is based on work with Refet Gurkaynak and Athanasios Orphanides. Return to text 2. See, for example, Morris A. Davis and Michael G. Palumbo (2001), "A Primer on the Economics and Time Series Econometrics of Wealth Effects," Finance and Economics Discussion Series 2001-9 (Washington: Board of Governors of the Federal Reserve System, February). Return to text 3. In this comparison, I use the Nasdaq composite index as a proxy for the high-tech sector and the Dow Jones industrials index as a proxy for the nontech sector. Return to text 4. See John H. Cochrane (2001), Asset Pricing (Princeton: Princeton University Press), p. 402. Return to text 5. Such a bubble would be called a "rational bubble." It is also conceivable that bubbles are present because some investors are not pricing assets rationally; for an introduction to that notion, see Annette Vissing-Jorgensen (2004), "Perspectives on Behavioral Finance: Does 'Irrationality' Disappear with Wealth? Evidence from Expectations and Actions," in Mark Gertler and Kenneth Rogoff, eds., NBER Macroeconomics Annual 2003 (Cambridge, Mass.: MIT Press), pp. 139-94. Return to text 6. See, for example, Jean Tirole (1985), "Asset Bubbles and Overlapping Generations," Econometrica, vol. 53 (November), pp. 1499-528; and Dilip Abreu and Markus K. Brunnermeier (2003), "Bubbles and Crashes," Econometrica, vol. 71 (January), pp. 173-204. Return to text 7. See, for example, Lubos Pastor and Pietro Veronesi (2004), "Was There a Nasdaq Bubble in the Late 1990s?" NBER Working Paper Series 10581 (Cambridge, Mass.: National Bureau of Economic Research, June). They argue that the high level of uncertainty about the future growth rate of dividends of tech firms helps explain these firms' stock prices without resorting to a bubble. Return to text 8. The difficulty of satisfactorily "detecting" bubbles is well known in the economics literature. For a recent survey see Refet Gurkaynak (2005), "Econometric Tests of Asset Price Bubbles: Taking Stock," Finance and Economics Discussion Series 2005-4 (Washington: Board of Governors of the Federal Reserve System, January). Return to text 9. For uniformity across countries, all data shown in this figure, and data discussed later on, including those for the United States, are drawn from international institutions. The asset-price data have been kindly provided by the Bank for International Settlements (BIS). For detailed explanations of these data see C. E.V. Borio, N. Kennedy, and S.D. Prowse (1994), "Exploring Aggregate Asset Price Fluctuations across Countries: Measurement, Determinants, and Monetary Policy Implications," BIS Economic Papers 40 (Basel: Bank for International Settlements). Return to text 10. To be sure, business cycle chronologies may differ somewhat depending on the underlying methodology. The dates of peaks and troughs in economic activity for the analysis that follows are from the Economic Cycle Research Institute. For the United States, these match the dates determined by the National Bureau of Economic Research (NBER). For other nations, the institute's methodology yields dates that are comparable to the NBER dates for the United States, which facilitates comparisons across countries. Recession dating is monthly. To obtain the quarterly time series used here, we converted the monthly expansion/recession phases to a quarterly frequency by designating the cyclical peak (the first quarter of recession) as the quarter containing the first full recession month--that is, the month following the monthly peak designation. Table 1 shows the dates of all recessions in the sample. Return to text
11. Estimates of real gross domestic product (GDP), the output gap, potential output, and real investment are from the Economic Outlook database of the Organisation for Economic Co-operation and Development. The investment data (shown in later displays) reflect total fixed investment. In figure 1, both actual and potential output are expressed relative to the value of actual real GDP in 1985. By definition, output should equal the economy's potential--and the corresponding measure of the output gap should equal zero--when productive factors in the economy are employed at their normal levels. Output is below the economy's potential when resources are underutilized and above it when the economy is overheated. To be sure, assessing the economy's potential with much accuracy is inherently difficult, and historical estimates of the implicit output gap are highly imprecise; however, these measures can serve as helpful summary indicators in historical comparisons such as those discussed below. Return to text 12. There are at least two reasons for the ambiguity in such classifications. The first relates to how one defines an asset-price bust. The second relates to the dating of cyclical peaks, which, as noted earlier, may differ somewhat depending on the methodology underlying business cycle chronologies. The three episodes on which I concentrate my attention are relatively uncontroversial in that the recessions followed rather substantial asset-price boom-bust cycles. But other recessions, which followed milder boom-bust cycles, could be added to this list. Examples would be the recessions that started in 1974 in the United States, in 1981 in Canada, and in 1990 in the United Kingdom. Return to text 13. To compute these averages, we first centered the path of asset prices around each recession episode. The quarter in which the recession began is marked as zero, and quarters from -8 to +8 denote the preceding and subsequent two years. Asset prices in each episode are normalized to 100 at the quarter marking the recession start. Return to text |
| |