| Remarks by Governor Edward M. Gramlich At the Spring 2005 Banking and Finance Lecture, Widener University, Chester, Pennsylvania April 21, 2005 A First Step in Dealing with Growing Retirement Costs |
|
Population aging is a worldwide phenomenon. In this country the looming retirement of the baby boom generation will take the United States ratio of workers to retirees from 3.3 today to 2 in about thirty years. Around the world, under present policies and demographic trends, the ratio of workers to retirees is likely to fall to less than 2 for countries as diverse as Australia, Brazil, Canada, China, France, Germany, Korea, Mexico, Russia, Turkey, and the United Kingdom. The ratio is likely to fall to less than 1 for Italy and Japan--that's right, in a few decades these two countries will be looking at a population situation in which they will have fewer workers than retirees. Demographic movements of this magnitude will require significant policy changes. The public costs of retirement systems will rise markedly unless countries raise their age of eligibility for retirement program benefits or cut these benefits. Moreover, small tax increases or benefit cuts will not do the job--the implicit actuarial deficits of these programs are so large that halfway measures will not be adequate. The United States is in relatively good shape by international standards. In contrast to other countries, the United States birth rate is not far below the rate that stabilizes population levels, and the tax rates necessary to finance our main retirement programs, Social Security and Medicare, are relatively low. But while the present situation of the United States may not be alarming, the outlook comes closer to being so. Outlays are projected to rise slightly more than program revenues for Social Security and much more than program revenues for Medicare. The recent annual report of the trustees of Social Security and Medicare projected rapid deterioration in the trust funds financing both programs, with the Medicare fund being exhausted in fifteen years. Their implication was that substantial tax increases or benefit cuts would be necessary to put both programs in long-term actuarial balance. What should we do to ensure the viability of Social Security and Medicare? Disaster is not imminent, but it seems pretty clear that in the not too distant future the United States, too, will have to confront some distinctly unpleasant policy choices. In this talk, I want to anticipate some of these choices. Up to now, discussions of Social Security and Medicare have been fragmented--there are a sizable number of proposals to reform Social Security, a few to reform Medicare, and none to unify the reforms for both programs. I will propose a joint approach that treats both programs alike and applies to them the same retirement ages and tax arrangements. This joint proposal fully corrects the long-term actuarial deficit for Social Security and would also make a start on a solution for Medicare.
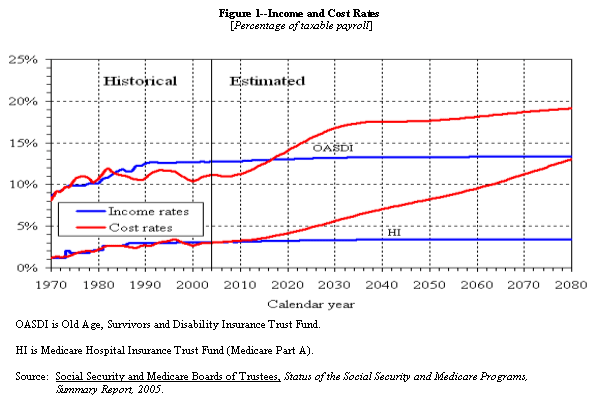
The Trustees' Report The Social Security retirement program began seventy years ago, and disability insurance was added fifty years ago. The combined expenses are financed by the Old Age, Survivors, and Disability Insurance (OASDI) Trust Funds. Medicare programs were added forty years ago. Part A of Medicare, covering hospital insurance is financed, just like Social Security, out of a payroll tax and trust fund. Part B, covering physician and outpatient costs, is optional, with about one-fourth of the costs financed by premiums paid by those who participate in the program and the remainder by general revenues. Part D, covering drug costs, was added last year and is also optional, financed by participants, general revenues, and some state contributions. To measure the adequacy of long-term financing, the four government trustees of the Social Security and Medicare trust funds convene every March with two outside members to review the projections. The actuaries make a number of long-term projections for life expectancy, birth rates, economic growth variables, prices, in general as well as specifically for health care; they then compute the expected actuarial situation for the trust funds for both programs. In recent years these projections have been made for seventy-five years, a horizon that seems long but in some sense is really not long enough. Because trust fund outlays are running well ahead of tax inflows by the end of the forecast period, the mere passage of time throws these seventy-five-year forecasts out of actuarial balance. To correct this tendency, the actuaries now provide forecasts that show costs if the ratio of trust fund assets to outlays is stable in the eighth decade out. This adjustment provides a reasonable approximation to the tax rates necessary to balance the system in perpetuity. The flow results for these projections, using the trustees' intermediate assumptions, are given in figure 1. The present combined employer-employee tax rate for the OASDI trust funds, the "income rates" line in the figure, is 12.4 percent and is assessed on the first $90,000 of taxable wages and salaries. Outlay rates are less than 12.4 percent of taxable wages and salaries now, but they rapidly rise above 12.4 percent as the huge baby boom population moves into retirement over the next thirty years. Even after that, time outlay rates continue to rise gradually because of steadily growing projected life expectancies. The pattern is qualitatively similar for the portion of Medicare financed by the payroll tax--Part A, or the hospital insurance (HI) portion. However, the outlay rates for Part A rise more steeply because of the rising relative costs of health care. Flow numbers are flow numbers, and given the steep inclines of at least some of the outlay rates, it makes sense to switch over to present values of liabilities, as shown in table 1. Over the next seventy-five years the unfunded liability for OASDI, essentially the discounted cumulated area between the cost and income lines in figure 1, is $4.0 trillion, 0.6 percent of the discounted present value of gross domestic product (GDP) over this period. An immediate payroll tax increase of 1.9 percentage points would be sufficient to pre-fund this liability. But because outlays greatly exceed revenues at the end of the projection period, the infinite-horizon unfunded liability is much larger, $11.1 trillion, or 1.2 percent of the discounted present value of GDP, which is tantamount to an immediate 3.5 percentage point increase in payroll tax rates. For Medicare, the initial size of the program is much smaller, but the outlay increases are larger, and the unfunded liabilities are much larger. Part A, the hospital insurance component, has a seventy-five-year unfunded liability of $8.6 trillion, or 1.4 percent of discounted GDP, and an infinite-horizon liability of $24.1 trillion, 2.5 percent of discounted GDP. It is more difficult to compute the liabilities for parts B and D because they have no dedicated trust funds. The gross expenditures for these programs, covering participant costs, general revenues, and state contributions, are $27.8 trillion (4.4 percent of GDP) over a seventy-five-year horizon or $58.0 trillion (6.1 percent of GDP) over an infinite horizon. Currently, participants and general revenues finance 1.3 percent of these costs (state payments under part D have not started yet). Hence, a reasonable estimate of the future unfunded liability is the difference--$19.8 trillion (3.1 percent of GDP) for seventy-five years or $45.8 trillion (4.8 percent of GDP) for the infinite horizon. And these humongous numbers do not even include Medicaid, which is financed entirely by general revenues and states, and also growing rapidly because of costs related to the aged.
Policy Approaches I have participated in the Social Security debate in the past, as chair of the 1994-96 Social Security Advisory Council, but today I want to look at both programs together. I freely admit that my proposal is only partial, a first step. I will focus only on ages of eligibility and tax rates for both programs, and will leave aside questions about privatizing Social Security or "carve out" or "add on" individual accounts. I also leave aside difficult questions about the structure of Medicare--whether and how to make more use of economic incentives or rationing. My idea on the tax side is relatively straightforward. Today, Medicare Part A is financed by a 2.9 percent combined payroll tax on all wages, and Social Security is financed by a combined 12.4 percent combined payroll tax on wages up to $90,000, a threshold that is increased each year with the growth in wages. One of my goals is to standardize treatment across the programs, and I would do that by removing the $90,000 cap on wages and salaries that are taxable for Social Security purposes. Let's treat both programs alike by taxing all wages for both programs. Will this represent a tax increase for Social Security? Of course it will, though in part the removal of the cap merely adjusts for the fact that because of the widening of the income distribution, substantially more wages are above the cap than in earlier times. But the main reason for removing the taxable payroll cap is that both programs together are woefully underfunded, and this would be a small step in the direction of fiscal responsibility. The basic idea on the benefit side is nearly as straightforward. We already have two relevant retirement ages for Social Security--the so-called normal retirement age (NRA), at which an individual qualifies for full benefits on the basis of his or her earnings history; and the age of early eligibility (EEA), at which an individual can receive actuarially reduced benefits. Historically the NRA has been 65 and the EEA has been 62. Recently the NRA has begun slowly climbing from 65 to 67 and is now near 66, but the EEA has remained fixed at 62. As I will argue below, there is a good rationale for raising the NRA beyond age 67, but I also think we should raise the EEA at the same pace. There are two reasons:
The next part of the age program is to keep the two ages common across both Social Security and Medicare. Confusion already exists because people qualify for full benefits under Medicare at age 65 and full benefits under Social Security at an age nearing 66. As the NRA increases for Social Security, the disparity will widen and the confusion will grow. So at the slowly rising NRA, I would give full benefits for both Social Security and Medicare. At the EEA, which would rise at the same slow rate as the NRA, I would give actuarially reduced benefits for Social Security and early buy-in opportunities for Medicare. One illustrative schedule is that individuals might be allowed to buy in to Medicare by paying, say, 90 percent of the average Medicare costs for parts A, B, and D once they hit the EEA, 60 percent a year later, 30 percent a year later, and only the standard part B and D premiums when they fully qualify for Medicare. Tying the program conventions together has programmatic value, but these programs are different and one must proceed cautiously. Medicare is a health insurance program, and health insurance performs two functions--it mitigates financial loss for households getting treatment, and it permits households to get health treatment in the first place. To the extent that the latter motive is dominant, as it could be for low-income or disabled households, measures to raise the eligibility age could be problematic. For this reason, it would be important to provide a generous schedule of buy-in substitutes for households with low-income or disabled beneficiaries, to encourage greater use of health care in the years before the NRA. The subsidies could be offset by surcharges on the premiums for well-off households, who could more easily afford the buy-in.
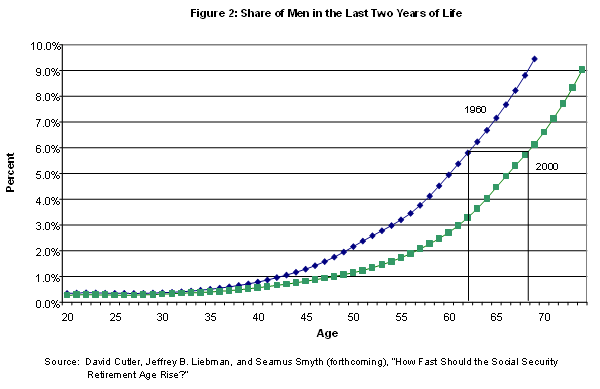
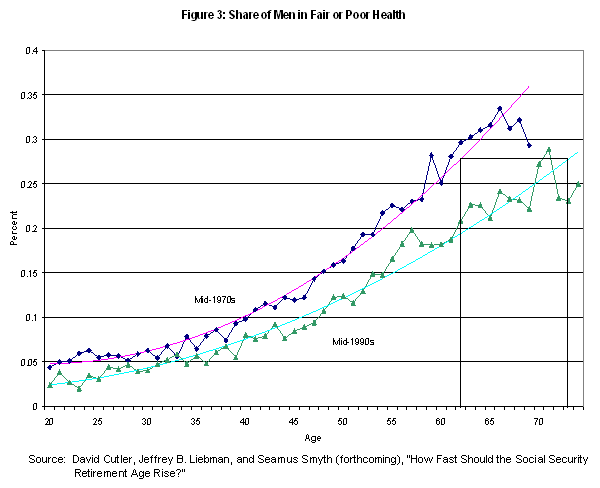
Retirement Ages I begin with the underlying logic for a rising retirement age. Historically most workers contributing to Social Security have been males. Males in my grandparents' generation who were lucky enough to attain age 65 could be expected to live, and collect benefits, for another thirteen years. Males in my grandchildren's generation lucky enough to attain age 65 are projected to live another twenty years. Had the NRA not been raised, this factor alone would have made Social Security a better deal by almost 60 percent for the younger generation. Obviously there have been many other changes in society, the economy, and Social Security over this time. But, still, it is my guess is that if the designers of Social Security had known back in the 1930s that postwar life expectancies would increase so significantly, they would have built rising retirement ages into the system. Of course, when asked, people do not favor rising retirement ages. But given the various undesirable choices for moving these programs back toward actuarial soundness, a slowly rising retirement age seems far and away the fairest across generations. One standard for how fast to raise the retirement age is to invoke life expectancies. Life expectancies at age 65 speak to the question of how many years into retirement individuals are likely to collect benefits. Life expectancies at age 20 address the question from a different perspective--as individuals enter adulthood, we might have them spend a constant percent of their time in work and retirement. The age-65 standard shows that, for males born between 1875 and 1995, life expectancy at age 65 has increased 7.4 years, an average of 0.6 years every decade (table 2). It also turns out that life expectancy has increased more rapidly for those born in the twentieth century--over this shorter period improvement has been about 0.7 years every decade. The age-20 proportionate standard works out as follows. In 1940, at the dawn of Social Security, 20-year-old males could expect to work another 45 years and to live just 1.9 more after retirement. That is, they could expect to spend 96 percent of their remaining life in the work force and 4 percent in retirement. Today, 20-year-old males can expect to live another 55.6 years. If they were to spend 96 percent of that time in the work force, the NRA would be slightly more than 73. By this standard, the NRA would have advanced 1.4 years every decade. Health status is also relevant. One measure is the share of men near death, defined as being in the last two years of life. In 1960 this share, for men around today's Social Security early retirement age of 62, was about 6 percent (figure 2). In 2000, the share of 68-year-old men near death was at this baseline level of 6 percent. By this health standard, in 40 years healthy life expectancies have increased 6 years, or 1.5 years per decade. One can also consider a broader measure of health status. Since 1970 the National Health Interview Survey has asked a direct question about health status. Typically, the proportion of people describing their own health as fair or poor is taken as a measure of poor health status. Since the numbers bounce around, I have made comparisons with trend lines estimated by Cutler, Liebman, and Smyth (figure 3).1 The trend lines show that, in the mid-1970s, 28 percent of men aged 62 reported that their health status was fair or poor. By the mid-1990s the 28 percent standard was not reached until men were about 73, an improvement of 11 years in just two decades. By this standard, the retirement age should increase by a whopping 5.5 years per decade. These health standards give varying estimates, so the conclusions are not as tight as for life expectancy. But they suggest that health standards are improving even more rapidly than life expectancies. If the retirement age were increased about a year per decade from the standpoint of life expectancy alone, the increase would be more rapid from the standpoint of health status. A sensible compromise would seem to be to raise the NRA and the EEA slightly more than a year every decade--maybe three months every two years--a pace slightly slower than the present rate of increase for the NRA. This rate of increase should be reviewed periodically to adjust to future changes in health status or life expectancy. There is one final point. A standard argument against raising the retirement age is that people are working physically demanding jobs and are simply not able to continue. Of course, workers can and do switch careers as they age, or claim early retirement. But it still makes sense to look at the share in demanding jobs, as is done in table 3. In 1950, one-fifth of the work force worked in jobs judged by the Labor Department to be physically demanding. But this share has dropped an average of 24 percent per decade since then. By 1996 it was down to only 7.5 percent of workers in physically demanding jobs, and by the time any of my suggested measures take effect, the share should be on the order of 3 or 4 percent--not zero, but probably not high enough to argue against measures to raise the retirement age at a gradual rate. It is not popular to raise the retirement age. Workers have a valid desire to consume some of their increasing productivity in the form of leisure time, or earlier retirement. At the same time, Social Security and Medicare together pose huge financial problems. It is also not popular to raise payroll taxes, or to ration health care. Among very unpleasant alternatives, raising the retirement age seems to be one of the fairest approaches across generations.
Budget Savings The tax change is easy to compute. Right now about 85 percent of wages are taxable and this coverage rate is slated to decline slightly over time. Applying the 12.4 percent tax rate to the15 percent of wages that are untaxed leads to an effective change based on now-taxable wages and salaries of 2.1 percentage points. This change more than solves the seventy-five-year Social Security problem (for the intermediate assumptions), and solves more than half of the infinite-horizon Social Security problem. It is only a first step, but a strong one. Increasing the NRA by three months every two years would improve the actuarial balance of Social Security by slightly less than 1 percentage point of taxable wages and salaries. I ignore any cost-saving effect on Medicare, permitting the early buy-in costs for low-income households to use up any budget savings from higher premiums for high-income households whose primary breadwinner is just over 65. If we were to combine this increase in the retirement age with a few standard measures to improve the horizontal equity of Social Security--including all newly-hired state and local workers and using a chained price index--the total improvement reaches about 1.4 percentage points. On net, the changes recommended here might improve the overall balance of Social Security plus Part A of Medicare by about 3.5 percentage points of taxable wages and salaries. These steps alone are enough to finance Social Security in perpetuity. Or, they could finance Social Security for seventy-five years and extend the life of Part A trust fund by about three decades. Huge general revenue liabilities for parts B and D of Medicare remain, but this package is still a start in dealing with growing retirement costs. As said above, the package of taxing all payrolls for Social Security and advancing the normal retirement age is indeed strong medicine. My approach here has been to unify proposals for the financial reform of Social Security and Medicare on the tax side and for retirement ages. Will the changes be pleasant or popular? No. Will something like them, or worse, be necessary some day? Yes. We might as well begin now thinking about those changes that seem to be the fairest across generations. Footnotes 1. David Cutler, Jeffrey B. Liebman, and Seamus Smyth (forthcoming), "How Fast Should the Social Security Retirement Age Rise?" Return to text |
|
Table 1. Measures of Trust Fund Actuarial Deficiency, 2005
1. GDP is the present discounted value of GDP over the relevant period.Return to table 2. The present discounted value of gross expenditures less the present 1.3 percent of GDP devoted to parts B and D.Return to table Source:2005 Annual Report of the Board of Trustees of the Federal Old-Age and Survivors Insurance and Disability Insurance Trust Funds and 2005 Annual Report of the Boards of Trustees of the Hospital Insurance and Supplementary Medical Insurance Funds Return to text |
||||||||||||||||||||||||||||||||||||||||
|
Table 2. Male Life Expectancies
1. Mean life expectancy at 65 is from the Social Security Administration and assumes individuals experience average mortality rates over the span of their remaining life. The assumption underlying life expectancy at 20 is more crude: individuals experience mortality rates for that year over their remaining life.Return to table
Source: Social Security Administration and National Vital Statistics Reports.
|
||||||||||||||||||||||||||||||||||||||||
|
Table 3. U.S. Workers in Physically Demanding Jobs
Source: Eugene Steuerle, Christopher Spiro, and Richard W. Johnson (1999), Straight Talk on Social Security and Retirement Policy, The Urban Institute, August 15.
|
||||||||||||||||||||||||||||||||||||||||
 Return to text |
| |