
How Did the 2003 Dividend Tax Cut Affect Stock Prices?
Keywords: Dividends, capital taxation
Abstract:
We test the hypothesis that the 2003 dividend tax cut boosted U.S. stock prices and thus lowered the cost of equity. Using an event-study methodology, we attempt to identify an aggregate stock market effect by comparing the behavior of U.S. common stock prices to that of European stocks and real estate investment trusts. We also examine the relative cross-sectional response of prices on high-dividend versus low-dividend paying stocks. We do not find any imprint of the dividend tax cut news on the value of the aggregate U.S. stock market. On the other hand, high-dividend stocks outperformed low-dividend stocks by a few percentage points over the event windows, suggesting that the tax cut did induce asset reallocation within equity portfolios. Finally, the positive abnormal returns on non-dividend paying U.S. stocks in 2003 do not appear to be tied to tax-cut news.
The views expressed are those of the authors and not necessarily those of the Federal Reserve Board, the Federal Reserve Bank of Chicago, or Barclays Global Investors. We thank Nellie Liang and John Graham for helpful comments. We are indebted to Nicholas Ryan for his excellent and extensive research assistance.
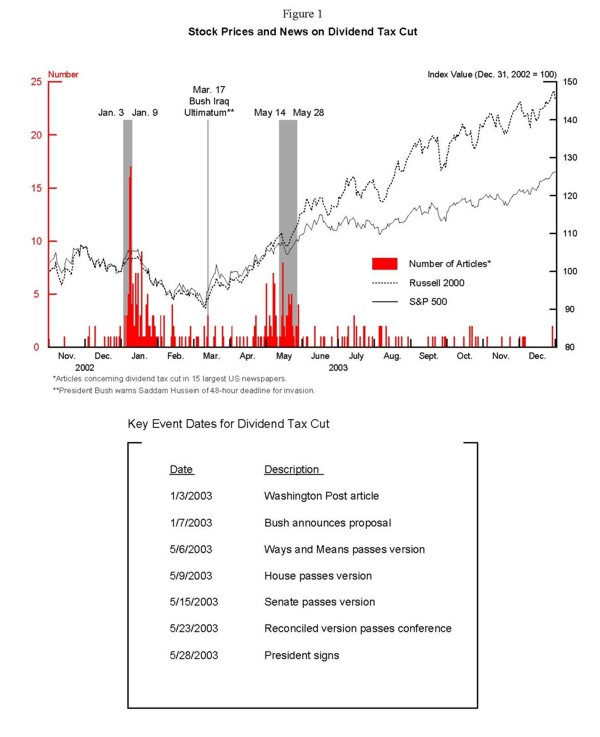
On May 28th of 2003 the President signed into law The Jobs and Growth Tax Relief Reconciliation Act of 2003 which, among other provisions, reduced the maximum tax rate on dividends from 38 to 15 percent. A related provision in the bill lowered the top rate on long-term capital gains from 20 percent to 15 percent, thereby equalizing those two tax rates for the first time since 1990. The dividend tax cut was perhaps the most dramatic provision in the bill and was almost certainly the most contentious. Indeed, the bill passed the Senate on a vote of 51-50, following weeks of wrangling, and up until the last day it remained unclear whether the bill would contain anything close to the significant cut in dividend taxes that was ultimately enacted.
During the debate leading up to enactment, proponents ascribed many benefits to the dividend tax cut. One of the main arguments was that reducing taxes on investment income would lower the cost of capital to business, stimulating investment and job creation. The lower cost of capital would be effected through a rise in U.S. corporate equity prices, which, as a side benefit, would boost spending through the wealth effect.1 For instance, a Treasury official testified before Congress that, although the Treasury had not worked up its own estimate, "estimates [by others] of the impact on stock market valuations range from 5 percent to 15 percent (Fisher (2003))." By capitalizing the CBO projection of the annual flow of foregone dividend taxes, Poterba (2004) estimated that the dividend tax cut could have boosted the value of U.S. equities by roughly 6 percent. The likely valuation effects remain a relevant concern going forward, when Congress faces the decision of whether to allow the tax cuts to expire in 2010, as provided for in current law.
In this paper, we test the hypothesis that the cut in capital taxation boosted U.S. stock prices, thereby lowering the cost of equity capital.2 We use an event-study methodology focused on time periods with notable positive news about the potential for passage of a dividend tax cut. We attempt to identify an aggregate market effect by comparing the behavior of U.S. common stock prices to the prices of securities that received no direct benefit from the tax cut. Our primary test involves comparing stock returns in the U.S. to returns on European stock markets, where U.S. investors - the beneficiaries of the tax law change - hold only a small fraction of shares outstanding (and presumably do not make up the "marginal investor"). We also compare the performance of U.S. stocks to the returns of real estate investment trusts (REITs), which received no benefit from the tax cut as they were already tax-advantaged.
In addition, we analyze the cross-sectional impact of the dividend tax cut news, by examining the relative response of stock prices across firms with different dividend policies. Such analysis allows us to address the tax effect at a disaggregated level and provides a robustness check on the validity of our event window choices. Given the uncertainty that always surrounds future tax policy, compounded in this case by sunset provisions and projections of large budget deficits, investors may well have discounted more heavily the tax savings on far-future dividends. If so, stocks with high current dividend yields would have been affected more than "growth" stocks paying little or no dividends. Finally, to bring some further counter-factual evidence to bear, we examine the cross-sectional behavior of yields on U.S. corporate bonds and the cross-sectional behavior of U.K. stock prices during the event windows.
In sum, we fail to find much, if any, imprint of the dividend tax cut news on the value of the aggregate stock market. U.S. large-cap and small-cap indexes do not outperform either their European counterparts or REITs over the event windows. Despite the claims of the tax-cut proponents, this result may not be too surprising. As suggested above, investors' might have capitalized only a small part of the future tax benefits, due to the explicitly temporary nature of the tax break. In addition, given the preponderance of tax-free investors, and institutional investors that book dividends as ordinary income, the "marginal investor" might have benefited relatively little from the tax cut.
The absence of a measurable aggregate effect, however, should not necessarily be taken as evidence of "tax irrelevance." In fact, our cross-sectional analysis indicates that high-dividend yield stocks did experience positive abnormal returns over the event windows, while low-dividend stocks moved in the opposite direction. These countervailing stock movements are consistent with the possibility of portfolio rebalancing by alert taxable investors and would attenuate the aggregate effect of the tax cut. Our interpretation of the positive abnormal returns on high-dividend stocks (in concert with no aggregate effect) is further bolstered by the lack of a similar pattern of abnormal returns within the cross-section of U.K. equities, which did not benefit from the tax law change.
On the other hand, we find that non-dividend paying stocks, in contrast to low-dividend yield stocks, outperformed the market (but not high-dividend yield stocks) on a risk-adjusted basis during the event periods. At first glance, this finding is surprising because the tax gains on these shares accrue in the more distant future. However, further careful inspection suggests that the timing of their abnormal returns is not tied to the event window. Moreover, our analysis of these firms' stock buybacks, on the one hand, and the returns on non-dividend-paying foreign stocks, on the other, both suggest that the zero-dividend stocks' performance was unrelated to tax cut news.
On a purely statistical level, our cross-sectional findings are consistent with the empirical results in Brown, Liang, and Weisbenner (2004) and Auerbach and Hassett (2005, 2006) who also conduct event studies around the dividend tax. Those studies use the cross-sectional variation in stock returns to test their hypotheses. Brown, Liang, and Weisbenner (2004) test for the role of executive share ownership on the level and composition of total payouts, while Auerbach and Hassett use the stock market response to the tax cut to evaluate the "new" versus the "traditional" view of dividend taxation. Neither analysis addresses the overall effect of the dividend tax cut on the U.S. stock market. Indeed, some of their inferences seem to require the assumption of a positive aggregate effect. Our results do undermine the Auerbach and Hassett (2005, 2006) interpretation of positive excess returns on zero-dividend stocks as a consequence of the dividend tax cut.
Dhaliwal, Krull and Li (2005) estimate the aggregate valuation effect induced by the tax act. They back out two ex ante estimates of the required return on equity using the level of stock prices and analysts earnings forecasts at two different dates. In principle, this approach controls for news about future cash flows, but it requires strong modeling choices and heroic assumptions about stability of the risk premium. Thus, their finding that the aggregate cost of capital declined seems largely attributable to their choice of event window - March 31st to June 30th. That window begins in the wake of an apparent peak in the market risk premium induced by uncertainty and anxiety regarding the probable invasion of Iraq. To the extent that changes in equity risk premiums are global, this highlights the benefit of using European stocks (and REIT shares) as controls.
I. Event Windows
News that a substantial dividend tax cut was being considered by the Administration as part of a major 2003 tax package first appeared in December of 2002, beginning with a piece in the December 4th Wall Street Journal (McKinnon, 2002). The press reports in December contained few details and largely couched the issue as a subject of debate within the administration. The administration's intention to propose a dividend tax cut only became clear in a January 3rd Washington Post article (Allen and Milbank (2003)), which also laid out some of the elements of the tax package in advance of the President's January 7th speech to the Economics Club of Chicago.
The vertical bars in Figure 1 plot the daily number of news stories in the 15 largest U.S. newspapers that discussed both "dividends" and "taxes". As shown, newspaper coverage on this issue skyrocketed in the first week of January, peaking on January 8th, the day after the speech. The number of such stories quickly subsided during February through April as legislation made scant progress and the public focused on the prospect of war in Iraq. We therefore assume that the first major event window occurs between January 3-9 (shaded in figure 1), the period over which newspaper coverage initially spiked.3
The dividend tax cut became a prime news story again in early May, following reports that House Republican leaders had finally agreed on a specific tax package containing a provision to lower the top tax rate on corporate dividends to 15 percent. Still, prior to mid-May it remained unclear whether any substantial cut in dividend taxes could pass the Senate. For instance, a May 5th Wall Street Journal article (Murray and McKinnon (2003)) led off with: "The Senate Finance Committee's tax package probably won't include any of the dividend-tax relief that President Bush wants, although it will leave room for a smaller version of the benefit if Republicans can muster support for it." On May 9th, it was reported that the Senate Finance Committee had agreed to include as part of the Senate tax package a much scaled-back benefit. That tax package - which included only miniscule dividend tax relief compared to the original proposal - was expected to see "rougher waters" on the Senate floor (Murray (2003)).
However, a breakthrough was reported on May 15th (Firestone (2003)), specifically that the previous day "a bipartisan group of senators reached agreement with Republican leaders... adding a crucial Democratic vote to President Bush's plan for eliminating taxes on dividends." Indeed, on May 15th, three Democrats joined 48 Republicans to pass a package under which investors could exclude 50 percent of dividend income from taxes this year and 100 percent of such income in 2004-2006, after which point the tax would be reinstated in full.
Consequently, our second event period begins with May 14th, the day of the first major breakthrough in Senate negotiations. The last obstacle was breached with Senate passage of the compromise legislation early in the morning on May 23rd, but we let the formal event window run through May 28th, two business days later, when the President signed the bill.4
As shown in the chart, stock market gains during the two tax-cut event windows are relatively modest. Over the January 3-9 window, the S&P 500 and the Russell 2000 small-cap index rose about 2 percent and 1 percent, respectively. Over the May 14-28 window, the S&P 500 rose 1.2 percent,
while the small-cap index rose 2.7 percent. (Including May 6-13 would boost the second-window returns to 2.9 and 5 percent, respectively.) These moves appear to be swamped by the slump and rebound of share prices around the threat and then realization of war in Iraq. In particular, on March
17th, news that the U.S, Britain and Spain announced an end to their efforts to win UN support for a war, and of an impending televised address by Bush, sent the S&P 500 soaring 3-
![]() percent that day alone (McKay (2003)). Investors were apparently relieved by the resolution of the
uncertainty about if and when the war would commence.
percent that day alone (McKay (2003)). Investors were apparently relieved by the resolution of the
uncertainty about if and when the war would commence.
II. Aggregate Market Evidence
Although our empirical analysis of the effects of the 2003 dividend tax cut on the stock market takes on several guises, the methodology is similar in all cases. In this section, we present three tests contrasting the change in value of a portfolio of U.S. common stocks that currently (or prospectively) generate taxable dividend streams with the change in value of a benchmark portfolio of securities during the two event windows. In each case, the tax cut legislation under consideration can be reasonably presumed to have little or no direct effect on the valuation of the benchmark portfolio. Thus, by examining the relative returns on U.S. common stocks, we can in principle control for the effects of general economic news and investor sentiment.
Our first two tests compare U.S. stock market returns with returns on foreign equities. The benefits of the dividend tax cut would accrue only to investors subject to the U.S. tax law, and U.S. investors hold a relatively small fraction of foreign equities - between 10 and 15 percent of most European markets (Department of the Treasury and Federal Reserve Bank of New York (2005)). In addition, the benefit of the tax cut to a U.S. owner of foreign stocks is typically less than the benefit they would receive on U.S. company dividends because the U.S. taxpayer's total tax liability on a foreign stock equals the maximum of the U.S. and foreign country dividend tax rates (Rousslang (1999)).
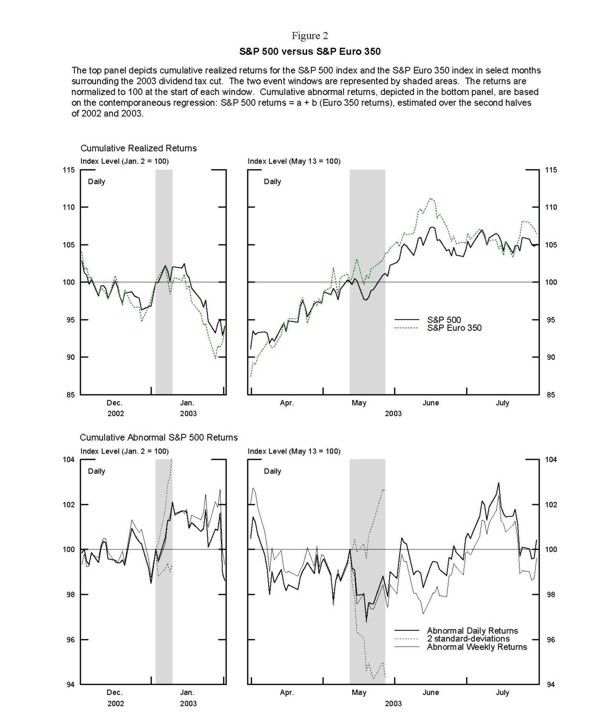
Figures 2 and 3 present our tests for excess positive returns on the U.S. stock market relative to foreign counterparts. The top panels of Figure 2 show the levels of two broad large-cap stock market indexes - the S&P 500 and S&P Euro 350 (IShares) - surrounding the key time periods. The latter index tracks large firms domiciled in continental Europe, covering about 70 percent of the region's market capitalization and spanning 17 exchanges.5 Over both event windows, shown by the two shaded areas, the performance of European stocks appears similar to or better than that of U.S. stocks.
Although the visual evidence in the top panel is suggestive, this comparison does not control for the "normal" relationship between U.S. and foreign equities. To do so, we assume that the U.S. and foreign stock indexes are influenced by a common (global) market factor, but with different loadings, or sensitivities. We then regress daily S&P 500 returns on daily S&P Euro 350 returns in the six months before and after the event period (July-Dec. 2002 and July-Dec. 2003) to obtain an estimate of the relative beta for the S&P 500 during normal times.6
We find a strong positive link between returns in the two markets (![]() = 0.66), with fluctuations in foreign equity returns accounting for nearly two-thirds of
variation in the S&P 500 returns. Abnormal returns are calculated as the difference between actual and model-predicted S&P 500 returns. These abnormal returns are then cumulated over the relevant time horizon and plotted in the lower panel of Figure 2, normalized to 100 at the beginning of
each event window (January 2 and May 13, 2003).
= 0.66), with fluctuations in foreign equity returns accounting for nearly two-thirds of
variation in the S&P 500 returns. Abnormal returns are calculated as the difference between actual and model-predicted S&P 500 returns. These abnormal returns are then cumulated over the relevant time horizon and plotted in the lower panel of Figure 2, normalized to 100 at the beginning of
each event window (January 2 and May 13, 2003).
If the U.S. stock market responded to the possibility of a dividend tax cut, then its cumulative abnormal returns (CAR) would be positive during the event periods. As shown by the thick black line in the lower left hand panel, the cumulative abnormal return from January 3-9 is estimated to be positive but small, about 2 percent. On the other hand, abnormal S&P 500 returns over the May event window are negative, on net. Thus, during the key periods where the actual form of the tax cut took shape and was adopted, the S&P 500 did not outperform a comparably broad index of European equities. The picture also indicates that including December in the event window would not help boost the estimated effect.
At the same time, it is important to note that our test has fairly low statistical power. Daily index returns were quite volatile in 2002 and 2003, with a standard deviation of 1.5 percentage points over our estimation period. Even though much of this variance is explained by movements in the S&P Euro 350 index, the remaining variation is large enough to generate wide standard error bounds, which increase as the event horizon lengthens.7 The error bounds, shown by the dotted lines, serve as an illustration of the magnitude of the stock market response necessary to overcome statistical doubts about the tax effect, a task that this exercise clearly fails.
As a robustness check, we re-estimate our results using weekly returns data, which smoothes out some day-to-day fluctuations in the market. Although the variance of excess weekly returns is lower, their cumulative level (the thin solid line in the bottom panels) is about the same and still below zero over the May period, again indicating no measurable positive effect of the tax cut.8
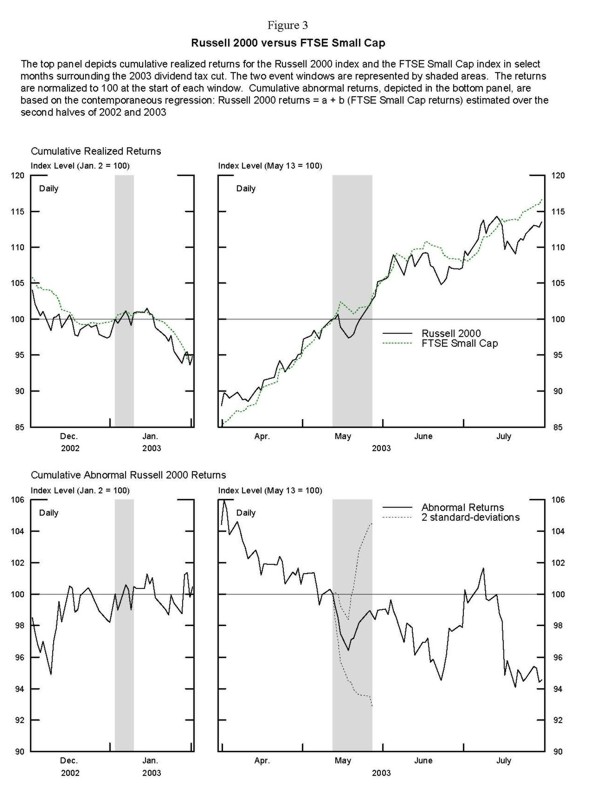
Small-capitalization stocks, as reflected by the Russell 2000 index, outperformed large-cap stocks over 2003, particularly around May. This observation seemed to contradict to the common wisdom that large-cap stocks, particularly companies paying high dividends now, stood the most to gain. That view is consistent with a fairly simple valuation framework where future tax policy is uncertain, and thus the tax-liability benefit on distant-future dividends is heavily discounted.9
If small-cap U.S. stocks were positively affected by the tax cut, then one would expect small-cap stocks in the U.S. to have performed unusually well in comparison to foreign small-cap stocks. We examine this hypothesis in Figure 3, where the FTSE Small Cap index is used as a foreign-market counterpart to the Russell 2000.10 The co-movement exhibited in the top panels suggests that the surge in small-cap stocks was a global phenomenon. This is confirmed by the abnormal returns plotted in the lower panels of the exhibit at the daily (thick solid line) frequency. The abnormal returns are zero over the January event window, and are even marginally negative over the May window, again contradicting the hypothesis that the tax cut was behind the strong market performance of small-cap U.S. stocks.
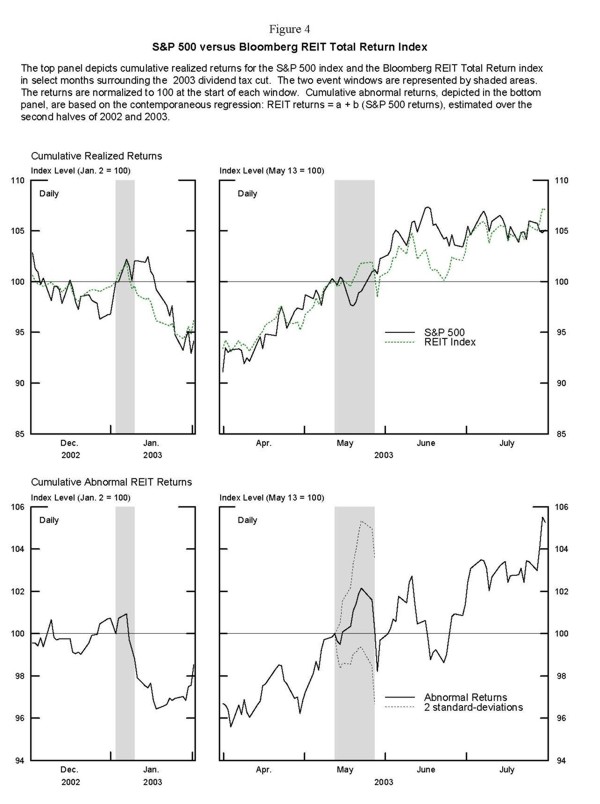
As an alternative to using foreign markets as a control, we also consider a class of U.S. assets whose dividends were specifically excluded from the 2003 tax cut. Real estate investment trusts (REITs) do not pay taxes on their profits at the corporate level if they distribute at least 90% of taxable profits to their investors. Although such distributions are commonly referred to as "dividends," their tax-free pass-through to investors made them ineligible for the lower dividend tax rate. Consequently, if the dividend tax cut boosted the valuation of (eligible) common stocks, one would expect REIT returns to have underperformed relative to the broad market over the event windows; that is, abnormal REIT returns should have been negative.
As shown in the top panels of Figure 4, REIT share prices generally tracked the overall market for most of the event windows, even after the reconciled version of the tax legislation passed the Senate-House conference and the tax treatment of REIT distributions was made clear. Only on the day before the bill was signed into law did REIT shares decline sharply, and then only temporarily. The lower panels of Figure 4 examine the cumulative abnormal REIT returns, estimated relative to S&P 500 returns. Abnormal returns are near zero during the event windows and well within the estimated error bounds and are modestly positive by the end of July. Having found no effect of the dividend tax cut on aggregate U.S. stock valuations, in the next section we attempt to determine whether the legislation had any significant cross-sectional effects on U.S. stock valuations.
III. Cross-sectional Evidence
A. Abnormal returns by current dividend yield portfolio
In a world without uncertainty where all corporate net income is eventually paid out as dividends, a once-and-for-all cut in the dividend tax rate would have a similar positive valuation effect on all common stocks, regardless of their current dividend yield. Perhaps the most obvious complication is the uncertainty regarding future tax policy in light of the frequency of such changes over the century (see, for example, figures 3 and 4 in Sialm (2005b)). Indeed, the 2003 law and its early incarnations explicitly embedded sunset provisions - the reduced dividend tax rate was set to expire in 2008, absent additional legislative action.11 Together with growing budget deficits, the sunset provision undoubtedly added to the usual degree of uncertainty about the duration of the benefit.
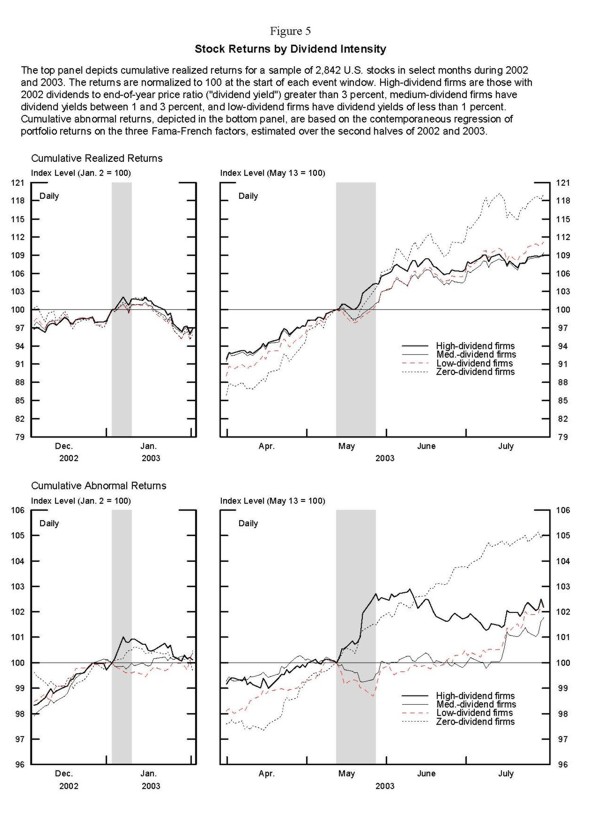
The uncertain permanence of a dividend tax cut should dampen the positive valuation effect on all stocks, but more so for stocks on which the lion's share of dividends may not be paid until far into the future, i.e. stocks that currently pay little or no dividend. 12 Accordingly, we look for cross-sectional effects of the proposed dividend tax cut by splitting our sample of roughly 2800 firms into four portfolios based on their dividend yield in 2002. As shown in Table 1, just over half of the firms paid no dividends in 2002. We split the dividend-paying firms into three portfolios, high-, medium-, and low-dividend firms. We define high-dividend firms as those for which the ratio of 2002 dividends to end-of-year price ("dividend yield") is greater than 3 percent, about a fifth of the dividend-payers. Medium-dividend firms have a dividend yield between 1 and 3 percent, while low-dividend firms are those with a dividend yield of less than 1 percent. Summary statistics for each group are presented in Table 1. The zero-dividend firms are notably smaller, more investment intensive, and less debt reliant than the other groups.
The top panels of Figure 5 show the cumulative realized returns for each group (equal-weighted) over the two event periods. The cumulative returns ranged between 1 and 2 percent during the January 2003 event window for each group. During the May event period, the high-dividend and zero-dividend portfolios logged gains of approximately five percent, noticeably more than the other portfolios.13 Because risk characteristics almost surely vary systematically across these groups, we test for differential performance by computing abnormal returns using the Fama-French three-factor model estimated over a twelve-month period that straddles the event period (July-Dec, 2002 and July-Dec. 2003). Conclusions are insensitive to choice of the estimation period.
As seen in the bottom panels of Figure 5, the high-dividend portfolio generated abnormal returns of around 1 percent in the January window and nearly 3 percent in the May window. Interestingly, in the latter period, it appears that high-dividend stocks began to diverge from low- and medium-dividend stocks on May 14th, a pattern that persisted until the day before the legislation was signed. This supports our presumption that the May 14-28 period was an appropriate choice for the event window. As shown formally in Table 2 (columns 3 and 4 of panels A and B), over each event window, the abnormal returns of the high-dividend firms are statistically different from zero and from the abnormal returns of low-dividend firms.
To verify whether the positive CAR for high-dividend stocks over the event windows can be ascribed to the dividend tax cut, we carry out several robustness checks. First, we estimate abnormal bond returns for those high- and low-dividend firms that have bonds outstanding. If the performance differential between high- and low-dividend stocks is related to systematic differences in economic news, rather than the tax cut, then we would also expect to see some differential in the bond returns for the two groups of firms. As reported in Table 2 (panel C), we find no evidence of abnormal bond returns for either the high- or low-dividend group, consistent with the presumption that the gap in equity performance is driven by the tax event.
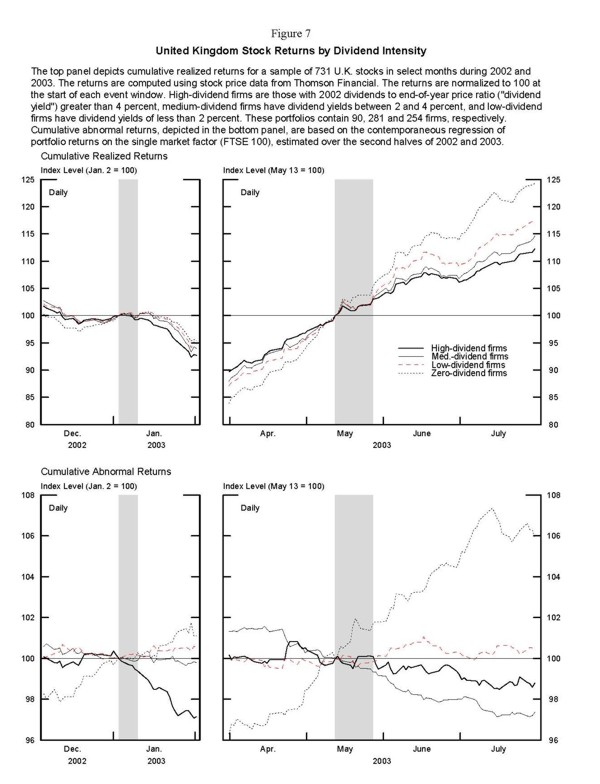
In addition, we test for differences in abnormal returns across dividend-yield based portfolios in a cross- section of UK stocks using a simple market model. The results shown in Figure 7 are in stark contrast to those for the U.S. stocks. In particular, we find that abnormal returns for both high- and low-dividend UK stocks were essentially zero over event windows defined on the basis for the change in U.S. tax law. Importantly, this result also corroborates our earlier identifying assumption that the dividend tax cut did not have any substantial implications for the valuation of European stocks.
One way to reconcile the apparent tax responsiveness in the cross-section of stock returns with the absence of an aggregate tax effect is through the possibility of portfolio rebalancing by taxable investors. Such investors could choose to rebalance their stock portfolios toward high-dividend stocks, while not changing their overall allocation between stocks and bonds. Indeed, positive abnormal returns of a high-dividend stock portfolio in Figure 5 are counterbalanced by the low-dividend portfolio's losses. In fact, the stocks in our high-dividend-yield portfolio represented less than 15 percent of the total market value of the all stocks in the sample. Thus, this subset of stocks could have been boosted at the expense of other, lower-dividend-paying stocks.
The results also suggest that the performance differential was not persistent, having dissipated by July. Though we cannot draw any statistically meaningful conclusions, a temporary response and reversal could be the result of temporary illiquidity: that is, the cross-sectional valuation effects of a quick response by alert tax-sensitive investors might have been eventually arbitraged away by non-taxable investors making offsetting portfolio changes.
B. Interpretation of abnormal returns on zero-dividend stocks
Another notable feature of Figure 5 is the positive (1-1/2 percent) abnormal returns logged by zero-dividend firms in the May window, which are marginally statistically significant. As mentioned earlier, this result seems to present a puzzle. The positive CARs on stocks with a high current dividend yield are consistent with theoretical predictions of the effect of a temporary tax cut for dividend-paying firms. Yet, the out-performance of zero-dividend stocks relative to the overall market (and low-dividend stocks) casts some doubt on that interpretation.
Auerbach and Hassett (2005) argue that such positive abnormal returns on zero-dividend stocks constitute evidence that the tax cut lowered the cost of capital for an important set of firms. In particular, they hypothesize a world in which share prices of zero-dividend firms should be those most sensitive to the proposed tax cut. Their main assumption is that zero-dividend firms tend to be immature firms that are more likely than others to issue a substantial amount of new shares in the future, due to their inability to satisfy large investment needs with internally-generated funds or by issuing interest-bearing debt. Current shareholders of such firms would reap the windfall on dividends to be paid on current shares as well as shares yet to be issued. This would inflate the response of those firms current market value to a cut in dividend taxes.14
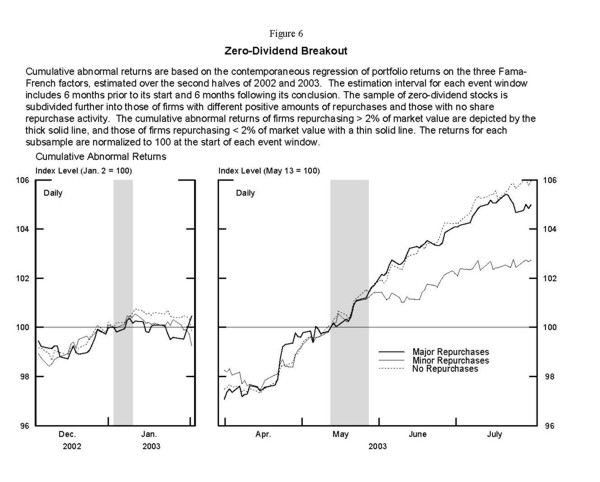
One way to test this explanation would be to identify those zero-dividend firms that are most likely to be truly equity-issuance dependent and then compare their abnormal returns to other zero-dividend firms for which this story is less plausible. We consider one such experiment in Table 3 and Figure 6. Here, the portfolio of zero dividend firms is split into three subgroups: firms that did not repurchase shares in the few years prior to 2003, firms that repurchased on average fewer than 2 percent of shares per annum, and firms that repurchased at least 2 percent of shares per annum. Arguably, firms with large repurchases are not likely to be cash-flow constrained "immature" firms that expect to issue a lot of new shares in the near future. Indeed, in the second row of table 3, we show the percent of firms in each group that subsequently issued a substantial amount (2 percent) of new shares between June 2003 and August 2005. The zero-dividend firms with large repurchases were notably less likely to subsequently issue new shares, even compared to firms that paid dividends.
In any case, as can be seen in Figure 6, both inside and outside the event windows, we find virtually no difference between the abnormal returns of zero-dividend firms with large repurchases and those with zero repurchases. These results would seem to cast doubt on the equity-dependence rationale for the positive abnormal event-window returns by zero-dividend firms.15
Another possibility is that the abnormal returns on zero-dividend stocks are unrelated to the event. In particular, Figure 6 shows that, unlike high-dividend firms, the abnormal performance of zero-dividend firms is not tied specifically to the event period, but rather runs almost continuously from mid-April through July. This suggests that something else may be driving this result; for instance, the risk-factor model used to estimate normal returns for these firms could be substantially mis-specified.16
We find additional corroboration for this explanation in the performance of the U.K. stock market. Recall that abnormal returns for all dividend-paying U.K. stocks were essentially zero over the event windows, in line with our assumption of the tax cut neutrality outside the U.S. However, as also shown in Figure 7, zero-dividend (and mostly small-cap) U.K. stocks logged positive abnormal returns throughout the entire April-June period, similar to what we observed regarding such stocks in the U.S. This is consistent with the hypothesis that the behavior of zero-dividend-paying shares in the U.S was the result of a broad (even global) shift in risk tolerances or other fundamentals and not of the tax cut per se.
IV. Further considerations
In any event study focused on an act of Congress, there will always be some uncertainty about the appropriate choice of event window due to the incremental nature of informational events. In the case of the dividend tax cut, while the initial policy announcement was a discrete event, some information appeared to leak in December hinting toward the new policy proposal. In addition, our determination of when the Congressional debate tilted in favor of a substantive dividend tax cut is somewhat subjective, even if quite plausible.17 One way to provide some evidence on the efficacy of our event-window choice used in the aggregate analysis is to use the timing of the cross-sectional effects as evidence on the reasonableness of the window.
The first pair of columns in Table 4 shows a ranking of the weekly values for abnormal returns on the high-dividend portfolios in the 52 weeks surrounding the tax event, starting in November 2002. Each of the three weeks in our two event windows show up among the top five weeks for abnormal returns on the high-dividend portfolio (shaded in the table). Indeed, the top week ends on May 28, which covers the days when the bill was passed and signed by the President. This is the only week in which the abnormal return on the high-dividend portfolio (1.58 percent) is significantly different from the mean at the five percent level.
On the other hand, this data also appears to provide evidence of a possible market response prior to the leaks in December. The second highest week (and the only other significant observation) is that ending December 11 - the week following the previously-noted Wall Street Journal article, which revealed administration discussions of a possible dividend tax cut. The third-highest week is also in December. Nonetheless, even if we were to change our test of the aggregate market response to focus on early- or mid-December, our conclusions regarding the lack of an aggregate effect would not change. As was shown in Figure 2, the cumulative abnormal returns on the S&P 500 (relative to the Euro 350) over that period were close to zero or even negative.
An additional pair of interesting observations from this table comes from the columns listing abnormal returns on low-dividend and zero-dividend stocks. The abnormal returns on low-dividend stocks during the event weeks (shaded) are near the bottom end of the table, consistent with the idea of some portfolio reallocation away from low-dividend stocks. In contrast, zero-dividend stocks recorded high positive CARs (at least one standard deviation above sample mean) in ten weeks throughout this period, and all but one week has no apparent connection to news about the tax cut. Even in that week (May 28), the return is well below the abnormal return in the highest week (November 27) and not much different from returns in several other weeks. This finding is consistent with our argument that the tax-event-window abnormal returns on zero-dividend stocks were probably unrelated to the event itself.
V. Conclusions
In summary, we find little if any imprint of the dividend tax cut news on the value of the aggregate stock market. U.S. large-cap and small cap indexes did not outperform either their European counterparts or REIT stocks during the event windows, regardless of how broadly those windows are defined. The tax cut did appear to have statistically significant, cross-sectional effects on stock valuations, with high-dividend firms receiving a boost at the expense of low-dividend firms, although this effect seems to have been short-lived. We also find evidence of positive excess returns on zero-dividend stocks. However, further scrutiny of the time-series and cross-sectional pattern of these excess returns suggests that they were probably unrelated to the dividend tax cut. This interpretation is supported by our finding that zero-dividend stocks outside the U.S. exhibited similarly positive abnormal returns during the tax event windows while foreign dividend-paying stocks showed no measurable response.
Of course, as with any event study, ours is subject to the usual caveats, the most significant being our inability to perfectly control for the myriad other factors that may have influenced U.S. stock valuations during or around the event windows. Regarding our aggregate results, there is also the problem of fairly wide confidence intervals that comes from having a somewhat diffuse event. Although we cannot statistically rule out the existence of a small valuation effect, we can be reasonably certain that the market was not boosted by more than four or five percent. Moreover, the cross-sectional results suggest that portfolio rebalancing from low- to high-dividend stocks may be behind the absence of a sizable aggregate response.
However, we did not attempt to determine why the tax cut might have had little impact. As suggested earlier, one possibility is that investors discounted the effect on future dividends owing to the built-in sunset provisions, not to mention the uncertainty regarding the permanence of any tax regime. Another mitigating factor is that a substantial proportion of U.S. stocks is held in accounts or by entities for which the lower dividend tax rate does not apply.
Auerbach, Alan J., 2002, Taxation and Corporate Financial Policy, in Alan Auerbach and Martin Feldstein, eds., Handbook of Public Economics, vol. 3 (Amsterdam: North-Hollan/Elsevier).
Auerbach, Alan J. and Kevin A. Hassett, 2002, On the marginal source of investments funds, Journal of Public Economics 87, 205-232.
Auerbach, Alan J. and Kevin A. Hassett, 2005, The 2003 dividend tax cuts and the value of the firm: An event study, NBER Working Paper No. 11449.
Auerbach, Alan J. and Kevin A. Hassett, 2006, Dividend taxes and firm valuation: new evidence, American Economic Review 96.
Allen, Mike and Dana Milbank, "President to Seek Dividend Tax Cut," Washington Post, January 3, 2003.
Brown, Jeffrey R., Liang, Nellie, and Scott Weisbenner, 2004, Executive financial incentives and payout policy: firm responses to the 2003 dividend tax cut, NBER Working Paper 11002.
Campbell, John Y., Lo, Andrew W., and A. Craig MacKinlay, 1997, The Econometrics of Financial Markets (Princeton University Press: Princeton, NJ).
Chetty, Raj and Emmanuel Saez, 2005, Dividend taxes and corporate Behavior: Evidence from the 2003 dividend tax cut, The Quarterly Journal of Economics 120, 791-833.
Chetty, Raj, Emmanuel Saez, and Joseph Rosenberg, 2005, The effects of taxes on market responses to dividend announcements and payments: What can we learn from the 2003 tax cut? NBER Working Paper 11452.
Department of the Treasury and Federal Reserve Bank of New York, 2005, Report on U.S. Portfolio Holdings of Foreign Securities as of December 31, 2003"
Dhaliwal, Dan, Linda Krull, and Oliver Zhen Li, 2005, Did the 2003 Tax Act reduce the cost of equity capital?, Working paper, University of Arizona.
Firestone, David, "With Plan for State Aid, Senate Republicans Gain Crucial Democratic Vote on Tax Cut," New York Times, May 15, 2003
Fisher, Peter R., 2003, "Paying Dividends: How the President's Tax Plan will Benefit Individual Investors and Strengthen Capital Markets," in Hearing before Subcommittee on Oversight and Investigations of Committee on Financial Services, U.S. House of Representatives, 108 Cong. 1st Session. (Government Printing Office, 2003), pp. 4-17.
Graham, John, Roni Michaely, and Michael Roberts, 2003, Do price discreteness and transactions costs affect stock returns? Comparing ex-dividend pricing before and after decimalization, Journal of Finance 58, 2611-36.
McKay, Peter A., "Stocks Surge on Clarity Over War with Iraq," Wall Street Journal, March 18, 2003.
Murray, Shailagh, "Senate Approves Tax Package: Dividend Repeal Survives in Scaled-Back Version," Wall Street Journal, May 9, 2003.
Murray, Shailagh, and John D. McKinnon, "Senate Panel Unlikely to Include Dividend-Tax Relief in it Plan," Wall Street Journal, May 5, 2003.
Poterba, James, 2004, Taxation and corporate payout policy, American Economic Review 94, 171-75.
Poterba, James, 2002, Taxation, risk-taking, and household Portfolio Behavior, in Alan Auerbach and Martin Feldstein, eds., Handbook of Public Economics, vol. 3 (Amsterdam: North-Holland / Elsevier).
Rousslang, Donald J., 1999, Foreign tax credit, in J. Cordes, R. Ebel, and J. Gravelle, eds. The Encyclopedia of Taxation and Tax Policy (Urban Institute Press).
Sialm, Clemens, 2005a, Tax changes and asset pricing: Cross-sectional evidence", working paper, University of Michigan.
Sialm, Clemens, 2005b, Tax changes and asset pricing: Time-series evidence", NBER Working Paper 11756.
Tax Reform Panel, 2005, The final report of the President's Advisory Panel on Federal Tax Reform, www.taxreformpanel.gov/final-report.
| Portfolio | Number of Firms | Median Assets ($ millions) | Median Dividend Yield (percent) | Median Capx / Net PPE (percent) | Median Cash* / Assets (percent) | Median LT Debt / Assets (percent) | Median Csh Flow / Capx (percent) | 25th perc. Csh Flow / Capx (percent) |
|---|---|---|---|---|---|---|---|---|
| High-Dividend | 256 | 1351 | 4.1 | 11.8 | 3.5 | 22.8 | 161.0 | 104.2 |
| Med-Dividend | 627 | 1559 | 1.8 | 13.7 | 4.8 | 14.4 | 212.2 | 145.1 |
| Low-Dividend | 444 | 1525 | 0.6 | 16.2 | 5.9 | 14.2 | 209.0 | 117.2 |
| Zero-Dividend | 1515 | 369 | 0.0 | 23.5 | 13.8 | 8.0 | 161.0 | 63.1 |
* Cash includes short-term investments.
All firm statistics from year-end 2002 except Cash Flow / Capx, which is the median ratio of 1999, 2000, and 2002.
Data is merged sample from Compustat and CRSP, filtered for public U.S. firms, excluding REITs and open-end funds.
| Portfolio | C.A.R. Jan 2 - 9 (percent) | S.E. Residuals from Regression | P - diff than zero | P - diff than low div. |
|---|---|---|---|---|
| High-Dividend | 1.23 | 0.0024 | 0.0192 | 0.0183 |
| Med-Dividend | -0.15 | 0.0021 | 0.3880 | 0.3418 |
| Low-Dividend | -0.45 | 0.0022 | 0.2026 | |
| Zero-Dividend | 0.30 | 0.0029 | 0.3375 | 0.2007 |
| Portfolio | C.A.R. May 13 - 28 (percent) | S.E. Residuals from Regression | P - diff than zero | P - diff than low div. |
|---|---|---|---|---|
| High-Dividend | 2.70 | 0.0024 | 0.0004 | 0.0002 |
| Med-Dividend | -0.52 | 0.0021 | 0.2268 | 0.2883 |
| Low-Dividend | -1.09 | 0.0022 | 0.0691 | |
| Zero-Dividend | 1.51 | 0.0029 | 0.0578 | 0.0158 |
| Return Type | C.A.R. May 13 - 28 (percent) High Dividend Firms |
C.A.R. May 13 - 28 (percent) Low Dividend Firms |
P - abnormal returns high div. diff than low div.* |
|---|---|---|---|
| Equity Returns | 4.98 | 2.02 | 0.0060 |
| Bond Returns | -0.05 | -0.22 | 0.4897 |
* From a regression of abnormal returns on a constant and a dummy variable for dividend portfolio type.
Firms with No Dividends Repurchases = 0 |
Firms with No Dividends Repurchases < 2% |
Firms with No Dividends Repurchases > 2% |
Firms with Dividends |
|
|---|---|---|---|---|
| Number of Firms | 916 | 415 | 234 | 1380 |
| Percent Issuing Equity (June 2003 to August 2005) | 14% | 12% | 7%* | 12% |
| Newly Issued Shares as Percent of 2002 Shares (median among issuers) | 21% | 19% | 22% | 13% |
*The fraction of major-repurchasing zero-dividend firms issuing equities is statistically different from that for minor repurchasing zero-dividend firms at the 10 percent level, and different from that for non-repurchasing firms at the 1 percent level.
| Rank | High Dividend Date |
High Dividend Return |
Low Dividend Date |
Low Dividend Return |
Zero Dividend Date |
Zero Dividend Return |
|---|---|---|---|---|---|---|
| 1 | 28-May-03 | 1.58** | 4-Jun-03 | 0.85 | 27-Nov-02 | 1.31** |
| 2 | 11-Dec-02 | 0.96* | 1-Oct-03 | 0.85 | 20-Nov-02 | 1.02** |
| 3 | 24-Dec-02 | 0.79 | 29-Oct-03 | 0.85 | 23-Apr-03 | 0.94* |
| 4 | 8-Jan-03 | 0.71 | 18-Dec-02 | 0.82 | 28-May-03 | 0.76 |
| 5 | 21-May-03 | 0.70 | 4-Dec-02 | 0.80 | 9-Jul-03 | 0.73 |
| 6 | 18-Dec-02 | 0.67 | 5-Feb-03 | 0.74 | 14-May-03 | 0.71 |
| 7 | 30-Jul-03 | 0.63 | 13-Aug-03 | 0.72 | 31-Dec-02 | 0.69 |
| 8 | 23-Jul-03 | 0.61 | 24-Dec-02 | 0.71 | 26-Mar-03 | 0.67 |
| 9 | 22-Jan-03 | 0.52 | 19-Mar-03 | 0.71 | 30-Apr-03 | 0.64 |
| 10 | 29-Oct-03 | 0.48 | 7-May-03 | 0.69 | 19-Mar-03 | 0.63 |
| 11 | 14-May-03 | 0.42 | 16-Apr-03 | 0.66 | 18-Jun-03 | 0.54 |
| 12 | 30-Apr-03 | 0.42 | 11-Jun-03 | 0.59 | 13-Nov-02 | 0.44 |
| 13 | 2-Jul-03 | 0.34 | 6-Aug-03 | 0.53 | 18-Dec-02 | 0.44 |
| 14 | 1-Oct-03 | 0.34 | 23-Jul-03 | 0.50 | 2-Jul-03 | 0.42 |
| 15 | 16-Jul-03 | 0.27 | 30-Jul-03 | 0.48 | 7-May-03 | 0.41 |
| 16 | 26-Mar-03 | 0.21 | 11-Dec-02 | 0.44 | 22-Oct-03 | 0.39 |
| 17 | 5-Feb-03 | 0.18 | 16-Jul-03 | 0.43 | 29-Oct-03 | 0.38 |
| 18 | 20-Nov-02 | 0.17 | 24-Sep-03 | 0.41 | 11-Jun-03 | 0.38 |
| 19 | 4-Dec-02 | 0.15 | 23-Apr-03 | 0.39 | 4-Dec-02 | 0.37 |
| 20 | 31-Dec-02 | 0.14 | 25-Jun-03 | 0.31 | 6-Aug-03 | 0.35 |
| 21 | 5-Mar-03 | 0.13 | 13-Nov-02 | 0.30 | 24-Dec-02 | 0.34 |
| 22 | 27-Nov-02 | 0.12 | 26-Feb-03 | 0.27 | 21-May-03 | 0.28 |
| 23 | 10-Sep-03 | 0.12 | 2-Apr-03 | 0.25 | 4-Jun-03 | 0.27 |
| 24 | 26-Feb-03 | 0.09 | 5-Nov-03 | 0.23 | 27-Aug-03 | 0.26 |
| 25 | 23-Apr-03 | 0.08 | 9-Jul-03 | 0.23 | 25-Jun-03 | 0.25 |
| 26 | 19-Feb-03 | 0.05 | 14-May-03 | 0.22 | 23-Jul-03 | 0.23 |
| 27 | 16-Apr-03 | 0.05 | 31-Dec-02 | 0.20 | 11-Dec-02 | 0.21 |
| 28 | 13-Nov-02 | 0.03 | 22-Oct-03 | 0.19 | 8-Jan-03 | 0.20 |
| 29 | 11-Jun-03 | -0.01 | 26-Mar-03 | 0.18 | 22-Jan-03 | 0.15 |
| 30 | 7-May-03 | -0.01 | 9-Apr-03 | 0.17 | 20-Aug-03 | 0.14 |
| 31 | 2-Apr-03 | -0.04 | 2-Jul-03 | 0.17 | 16-Jul-03 | 0.12 |
| 32 | 4-Jun-03 | -0.05 | 30-Apr-03 | 0.14 | 3-Sep-03 | 0.11 |
| 33 | 22-Oct-03 | -0.07 | 15-Oct-03 | 0.09 | 10-Sep-03 | 0.08 |
| 34 | 17-Sep-03 | -0.09 | 22-Jan-03 | 0.07 | 13-Aug-03 | 0.06 |
| 35 | 9-Apr-03 | -0.10 | 8-Oct-03 | 0.07 | 24-Sep-03 | 0.05 |
| 36 | 24-Sep-03 | -0.11 | 29-Jan-03 | 0.05 | 26-Feb-03 | -0.04 |
| 37 | 20-Aug-03 | -0.13 | 20-Aug-03 | 0.05 | 5-Nov-03 | -0.04 |
| 38 | 13-Aug-03 | -0.20 | 15-Jan-03 | 0.03 | 8-Oct-03 | -0.05 |
| 39 | 18-Jun-03 | -0.28 | 17-Sep-03 | -0.03 | 15-Jan-03 | -0.07 |
| 40 | 27-Aug-03 | -0.29 | 18-Jun-03 | -0.04 | 16-Apr-03 | -0.11 |
| 41 | 19-Mar-03 | -0.30 | 20-Nov-02 | -0.09 | 19-Feb-03 | -0.13 |
| 42 | 5-Nov-03 | -0.37 | 12-Feb-03 | -0.11 | 9-Apr-03 | -0.13 |
| 43 | 29-Jan-03 | -0.39 | 3-Sep-03 | -0.13 | 30-Jul-03 | -0.13 |
| 44 | 12-Feb-03 | -0.43 | 28-May-03 | -0.17 | 15-Oct-03 | -0.18 |
| 45 | 25-Jun-03 | -0.43 | 8-Jan-03 | -0.20 | 2-Apr-03 | -0.21 |
| 46 | 8-Oct-03 | -0.50 | 19-Feb-03 | -0.33 | 12-Mar-03 | -0.25 |
| 47 | 3-Sep-03 | -0.50 | 12-Mar-03 | -0.40 | 17-Sep-03 | -0.29 |
| 48 | 12-Mar-03 | -0.53 | 5-Mar-03 | -0.40 | 29-Jan-03 | -0.31 |
| 49 | 15-Jan-03 | -0.55 | 10-Sep-03 | -0.40 | 1-Oct-03 | -0.52 |
| 50 | 9-Jul-03 | -0.62 | 21-May-03 | -0.42* | 5-Mar-03 | -0.52 |
| 51 | 15-Oct-03 | -0.67 | 27-Aug-03 | -0.45* | 12-Feb-03 | -0.59 |
| 52 | 6-Aug-03 | -0.77* | 27-Nov-02 | -0.51* | 5-Feb-03 | -0.65 |