
Families' Use of Payment Instruments During a Decade of Change in the U.S. Payment System
Keywords: Payment systems, consumer choice, technology adoption, multihoming.
Abstract:
JEL codes: G20, D12, E41.
Introduction
In the 1950s, most consumers paid by either cash or check. Both of these are paper-based forms of payment. Financial innovation from the 1970s to today created new electronic ways for individuals to pay, such as debit cards, credit and charge cards, and direct payments from a bank account. Despite these innovations, many families continued to rely significantly on paper payments through the early 1990s. However, in the mid-1990s and early 2000s, a major shift in the U.S. payment system occurred. The share of consumer payments made with electronic devices such as credit cards, debit cards and direct payments jumped from 25 percent in 1995 to over 50 percent in 2002 (BIS, 2004).
This paper investigates the link between aggregate changes in the use of different forms of payment to family level survey data on payment systems. Family level data from the 1995, 1998 and 2001 waves of the Survey of Consumer Finances (SCF) indicate that the share of families using or holding electronic forms of payment also increased over the same period. In addition, the proportion of families using more than one payment instrument also moved up, a practice called "multihoming." The results in this paper document a significant change in the payment system, inform payment system policies, and provide evidence of technology adoption behavior more generally.
Previous research using the SCF data shows that payment instrument use is significantly correlated with income, age and demographic characteristics (Kennickell and Kwast (1997), Stavins (2001), Mester (2003) and Hayashi and Klee (2003)). Importantly, this paper extends previous results in three ways. First, it documents these relationships over a time of significant change in the payment system. Second, it explores the correlation between the use of different payment instruments, which lends insight into the complementarity or substitutability of different payment instruments. And finally, it discusses the rise in multihoming.
There are three important reasons to study payment system issues. First, payment systems are a huge, important component of a well-functioning market economy. In 2002, there were approximately 82 billion payments valued at $65 trillion dollars made with checks, credit cards, debit cards, and automated clearing house (ACH) payments.2 These payment flows were over six times the dollar value of GDP, and more than $225,000 per capita. Second, paper payments are more resource intensive than electronic payments, and these resource costs represent anywhere from 1/2 to 3 percent of GDP (Humphrey and Berger (1990), Wells (1996), Hahn (2004)). Thus, a change in the payment system that causes a shift away from paper to electronic payments could potentially save resource costs, thereby increasing economic efficiency. And third, payment systems have been the subject of multiple antitrust cases and policy initiatives. The results on the substitutability of different payment instruments could help inform policymakers on the potential effects of payment system policies on consumer behavior.
To preview the results, there has been significant increases in the proportion of families who report using debit cards and direct payments. Age and income are strongly correlated with the decision to use these particular payment instruments. Younger families and higher income more frequently report using a debit card or direct payments. These results point to possible effects of the propensity to adopt new technologies or access to new technologies in a family's decision to use electronic forms of payment. Personal characteristics have a large influence on the type of payment instruments used.
At the same time that the proportion of families using debit cards and direct payments grew, however, the proportion of families that report using checks or holding credit cards has remained relatively stable. This observation leads to the next part of the analysis, that is, to investigate how multihoming behavior has changed over the period. Indeed, the share of families that multihome increased substantially. The factors that determine multihoming behavior are generally the same that determine electronic payment use. Income, age, and demographics tend to be correlated with multihoming behavior. This result leads us to believe that while families adopted new forms of payment, they did not immediately stop using the older forms of payment. Payment choice likely depends on the nature of the transaction.
Given that families choose individual payments based on their demographic characteristics, and likely choose within a portfolio of payment instruments for any particular transaction, it is natural to investigate this multihoming behavior more closely. Although the final set of results are a bit difficult to interpret, they seem to suggest that families generally use both debit cards and credit cards together. However, by refining the categories somewhat, it appears that families either use debit cards or they are convenience users of credit cards, but usually not both. Similarly, debit card use is an either-or decision with direct payment use. No apparent pattern can be distinguished for debit card and check use, or direct payment and check use.
These results help us understand the aggregate trends in the use of noncash payments. Because aggregate data indicate that the number of electronic payments increased while the number of check payments declined, while the family level data indicate that the use and holdings of these payment instruments either held steady or did not fall, families likely changed their intensity of use of different payment instruments. Although the data offer little indication of intensity of use, understanding factors that may contribute to multihoming behavior helps inform ongoing theortical research that models this phenomenon.3 Taking the family-level results together with the aggregate results, we can get a sense of how the change in family behavior over this period affected the aggregate number of payments overall.
One caveat is that this paper addresses demand influences only. To be sure, supply-side factors also contributed to the shift from paper to electronic payments. Many of the networks and a large part of the technical infrastructure that supply electronic payments were established before 1995. But, although the backbones of these networks existed before 1995, access points increased substantially from 1995 to 2001. One notable increase was in the number of point of sale terminals for PIN debit cards. In 1995, there were approximately 530,000 terminals; in 2001, 3.64 million (BIS, various years). Whether this was a cause or an effect of increased adoption rates by families is difficult to determine, but it is not surprising that the two phenomena occurred during the same period. Although this paper focuses on demand factors at the consumer level, these supply-side influences should be noted.
The paper proceeds as follows. Section 2 gives extensive background on the U.S. payments system, including a brief history, aggregate statistics, and family-level statistics. Section 3 posits a theoretical model of payment choice and describes the estimation procedure. This leads to the estimation results reported in section 4. Section 5 offers conclusions and suggestions for further research.
Background on the U.S. payments system
History
Today consumers pay for goods and services with cash and "noncash retail payments" - debit cards, credit and charge cards, direct payments from a bank account, known as automated clearing house (ACH) payments, and check payments. Debit card, ACH and checks deduct money directly from a user's account. In contrast, credit cards provide users with a line of credit, either revolving or non-revolving (also known as charge cards). This study focuses on these noncash retail payments, because data on cash use is generally unavailable.4
A quick overview of payment system history gives perspective on the aggregate data. The payment instruments commonly used today developed at different points in time. The oldest type of noncash retail payment commonly used by U.S. consumers today is the check. The earliest forms of check payments were introduced in the late 1600s, and until relatively recently, represented the great majority of noncash retail payments.5 In fact, in the 1960s, concern grew over a projected dramatic increase in the number of check payments, which led to the development of the ACH, a computer-based system for payments available to consumers. Common uses of the ACH include direct deposit of payroll, mortgage payments, utility bill payments and insurance payments. The number of payments made with the ACH increased substantially throughout the 1980s and 1990s, and the value of these payments also continues to increase.
"Plastic" payment instruments developed in the second half of the twentieth century. The first general purpose charge card, Diners Club, was introduced in 1950. Before the 1950s, some retailers offered "charga-plates", but these were limited to a particular establishment. Credit cards were not widely used until the 1970s, and use grew across the income distribution through the 1980s and 1990s.6 The earliest forms of debit cards appeared in the 1970s.7 Although debit card use was relatively nonexistent before 1989, by 2001, almost one half of U.S. families used a debit card. An indication of debit card's current prominence is that Visa reported in 2002 that more transactions on their network were made with debit cards than with credit cards; this trend continues through today.8
Over the history of U.S. payment system, there have been few periods during which payment patterns changed as dramatically as over the past ten years. Through the 1960s, consumers relied heavily on cash, checks and store credit as the primary means of payment. Payment patterns started to shift in the 1960s through the 1970s, when credit cards and direct payments began to be used widely, although the share of noncash payments made by check remained high. At the end of this period, in 1979, checks represented 85.7 percent of noncash retail payments.9 In the sixteen years between 1979 and 1995, the share of noncash payments made electronically grew 9 percentage points. Since 1995, this share grew rapidly, almost tripling in only eight years.
Today, electronic payment networks are growing in importance in the U.S. economy. For some economic activity, electronic payment networks are critical, such as for e-commerce. Data from the U.S. Census Bureau show that retail e-commerce sales increased from $6.1 billion in the fourth quarter of 1999 to $15.5 billion in the first quarter of 2004, which represents an increase from 0.7 percent of total retail sales to 1.9 percent. It is likely that a large chunk of consumer Internet shopping goes through the Visa and MasterCard networks, and a good portion of business-to-business e-commerce eventually flows through the ACH network. 10
Aggregate and family-level data
Aggregate data
The history of the payment system offers a backdrop for better understanding data on the most common payment instruments in use today. Tables 1(a) and 1(b) show data on noncash retail payments from 1995 to 2001. Table 1(a) shows the total number of noncash retail payments; the left side shows number and the right side shows shares. The total number of noncash retail payments grew from approximately 65.7 billion in 1995 to 78.8 billion in 2001. Concurrently, the estimated number of checks paid fell from 49.5 billion in 1995 to 41.2 billion in 2001.11 With an assumed 3 percent annual decline, the number of checks paid fell to 41.2 billion in 2001.
The right half of the table shows the share of the number of noncash retail payments of each payment type. The share of the number payments made by debit card increased 13 percentage points, from 3 percent in 1995 to 16 percent in 2001. The credit card share increased 5 percentage points, and the ACH share increased 5 percentage points. At the same time, the estimated check share fell from 75 percent in 1995, to 57 percent in 2000, to 52 percent in 2001. Overall, the share of payments made electronically increased 23 percentage points, from approximately 25 percent in 1995 to 48 percent in 2001.
Table 1(b) shows the value and shares of constant-dollar noncash retail payments. Check and ACH payments represent relatively larger shares of the value of payments than the share of the number of payments. This is mainly because debit cards and credit cards are used primarily to purchase smaller value items at the point of sale, whereas checks and ACH may be used to pay mortgages, salaries, and other higher-dollar value payments. Consistent with this view, while debit card's share of the number of payments increased 8 percentage points from 1998 to 2001, its share of the value of payments increased only one percentage point.12
Survey of Consumer Finances
The trend towards electronic payment evident in the aggregate are also in household data from the Survey of Consumer Finances.13 According to the SCF, families' use of debit cards, credit cards and ACH payments grew substantially from 1995 to 2001.14 Table 2(a) presents payment use and holdings statistics from the complete SCF samples. As shown in line 1 of the table, from 1995 to 2001, debit card use increased 29.4 percentage points, from 17.6 percent of families in 1995 to 47.0 percent of families in 2001. As shown in lines 3 and 4 of the table, there has also been a rise in debit card use among those who do not have a checking account, likely because government benefit programs increasingly use debit cards or similar payment instruments as a method for disbursing funds to program recipients. Thus, it appears that the use of debit cards have increased across the income distribution.
The broad increase in debit card use across different income and age groups is shown clearly in figures 1(a) and 1(b). The x axis in each of these figures plots the group of families, and the y axis plots the use of debit cards as a percentage of that group. The three lines represent data from the 1995, 1998 and 2001 waves of the survey. As shown in figure 1(a), debit card use rises, then falls with income. In contrast, as shown in figure 1(b), debit card use steadily falls with age. However, in both cases, there was a level rise across all groups in debit card use. The aggregate rise in the number of debit card transactions may be able to be explained in part by these family trends.
From 1995 to 2001, the fraction of households with credit cards increased 1.8 percentage points, to 76.2 percent of families. The relatively slight increase in total holdings masks a change in composition: "Bank" credit card holdings, or cards issued on the Visa, MasterCard, Discover networks, or American Express' Optima credit card, increased 6.3 percentage points while retailer card holdings decreased 12.4 percentage points and gas card holdings decreased 8.6 percentage points. In addition, the proportion of "convenience users" - families who had new charges on their last bill and had no balance after the last payment was made on the account - increased 4.1 percentage points from 1995 to 2001.15 This represents a growing proportion of bank credit card users overall. In 1995, convenience users were 36.8 percent of bank credit card holding families; in 1998, 37.2 percent, and in 2001, 39.3 percent. American Express, Diners Club, or Carte Blanche card holdings (commonly referred to as travel and entertainment charge cards), stayed relatively constant, at 11.0, 9.1 and 10.6 percent of families in 1995, 1998 and 2001, respectively.
Figures 2(a) and 2(b) graphically present how credit card holdings vary by income and age. Unlike with debit card use, credit card holdings steadily increase with income. In all survey years, over 95 percent of families in the top tenth of the income distribution had a credit card. Part of this difference may stem from the need to satisfy certain measures of credit worthiness in order to obtain a credit card; higher income families may be more likely to satisfy these requirements. Also, as indicated in figure 2(b), the incidence of credit card holdings tends to rise, then fall, with age, showing the highest rates of credit card use are among working-age families.
Direct payment use also increased over this period. From 1995 to 2001, direct payment use increased 18.5 percentage points, to 40.3 percent of families. Many industries that receive recurring payments from their consumers have adopted the use of the ACH. According to the survey data, families most frequently reported that they use direct payment for insurance premiums across all survey years.
However, not every bill can be paid with a direct payment, and not all other payments can be made with either a credit card or debit card. Thus, despite these increases in use and holdings of electronic forms of payment, as shown in the last line of the table, the share of families that reported using checks as a main way of interacting with a financial institution remained stable at approximately 75 percent of families.16 This result suggest multihoming by families.
Indeed, many families use or hold more than one type of payment instrument, and the proportion of families using or holding more than one increased over time. Table 2 (b) gives summary statistics on the proportion of families that use or hold more than one of these instruments. As shown in the table, in 1995, 14.5 percent of families used a debit card and had a credit card. This share increased to 37.8 percent of families in 2001, a jump of 23.3 percentage points. Similarly, the share of families that used a debit card and direct payment also jumped, from 5.6 percent of families to 23.2 in 2001. The proportion of families using debit cards, holding credit cards, and using direct payment increased 15.2 percentage points, from 4.8 percent of families in 1995, to 20.0 percent of families in 2001.
However, evidence suggests that not all families multihome in the same way. Table 2 (c) reports cross-tabulations of credit card and debit card use in 2001. These statistics show that not only do families use more than one type of card, families use these cards differently. The data are broken up into four categories of credit card users: convenience users, or bank credit card holders who had new charges, but no balance owed after the last bill was paid on the account; borrowing users, or bank credit card holders who had new charges, and had a balance owed after the last bill was paid on the account; only holding, or bank credit card holders who had no new charges on the account, and borrowing nonusers, or bank credit card holders who had no new charges, and had a balance owed after the last bill was paid on the account.
Interestingly, while only about 44 percent of families who use credit cards for convenience use a debit card, approximately 59 percent of families who borrow on credit cards use a debit card. Borrowing non-users, defined as families who reported outstanding credit card balances but did not report any new charges report a similar percentage of debit card use to borrowing users of credit cards, approximately 58 percent. According to Visa and MasterCard rules at the time these data were gathered, there was no difference for retailer acceptance of a bank credit card or a signature debit card transaction. In addition, many debit cards have both functionalities: they allow consumers to sign or to use a PIN. These features mitigate supply-side factors that could affect the choice between debit and credit. Possible explanations include use of a debit card as a device to discipline spending or credit constraints for borrowing users.17
To summarize, from 1995 to 2001, the number of electronic payments increased by approximately 20 percent. The aggregate statistics show that the share of payments made with debit cards, credit cards and ACH payments steadily increased from 1995 to 2001, while the share of payments made by check fell. At the same time, the family-level data indicate that the proportion of families that used debit cards and direct payments increased, and the proportion of families that had credit cards or used checks stayed relatively constant. Means of the survey data suggest that use of these payments appear to differ by income, demographics and purpose of payment. These statistics motivate the model presented in the next section, which formalizes a consumer's choice of payment instrument based on personal characteristics and the nature of the transaction. The model then leads to the estimation procedure, which presents the assumptions needed in order to estimate the model accurately.
The model and estimation procedure
Model of payment instrument choice
Consider a situation where a consumer decides what payment instrument to use. One set of factors that may influence a decision is personal characteristics. As noted in the introduction, previous research has shown that age, income, and demographic characteristics are correlated with use of payment instruments. These factors could proxy for access to different payment instruments, willingness to try new products, and the cost of the payment technology relative to other payment technologies.
Another set of factors that should also influence choices are the characteristics of the payment instrument itself. Some card products offer consumers airline miles or cash back bonuses when they are used. Other people may prefer checks, as checks could be perceived to help consumers with budgeting or accounting.18 Most direct payments from a bank account are originated on a recurring, regularly scheduled basis and may only require the consumer to sign up for the service once.
A third set of factors that may influence a consumer in making payment choices are the characteristics of transactions. For example, credit cards are convenient to use for many purchases made on the Internet. Checks, in contrast, may be less convenient for some types of Internet transactions, but more convenient for casual payments, for example to an individual or to a small business. Direct payments are convenient for a regularly scheduled payment - such as a mortgage - but cumbersome for Internet purchases or for paying indivuduals.
Given these sets of factors, the model specified assumes that the consumer chooses the payment instrument that maximizes utility, specified as
| (1) |
where ![]() is
family
is
family ![]() 's utility for
payment instrument
's utility for
payment instrument ![]() for
transaction type
for
transaction type ![]() ,
,
![]() is a vector of
family characteristics,
is a vector of
family characteristics, ![]() is a vector of payment instrument characteristics and
is a vector of payment instrument characteristics and ![]() is a vector of transaction
characteristics.
is a vector of transaction
characteristics. ![]() ,
,
![]() and
and ![]() are vectors of parameters that
weight these factors in the consumer's utility function.
are vectors of parameters that
weight these factors in the consumer's utility function.
A common approach in estimating discrete choice models is to assume that some factors that determine payment choice are unobserved by the econometrician. The utility of the consumer is then specified as
where
![]() captures
the unobserved factors. In addition, the researcher observes an
indicator
captures
the unobserved factors. In addition, the researcher observes an
indicator ![]() that
equals one if consumer
that
equals one if consumer ![]() chooses payment instrument
chooses payment instrument ![]() for transaction
for transaction ![]() . Assuming a probability distribution for the
unobserved factors that determine payment choice leads to a
probability of using or having a particular payment instrument
based on observed factors. If the probability distribution
satisfies certain properties, McFadden (1973) shows that this
specification satisfies the properties necessary and sufficient to
be consistent with utility maximization.
. Assuming a probability distribution for the
unobserved factors that determine payment choice leads to a
probability of using or having a particular payment instrument
based on observed factors. If the probability distribution
satisfies certain properties, McFadden (1973) shows that this
specification satisfies the properties necessary and sufficient to
be consistent with utility maximization.
Assuming that the error terms are independently and identically distributed with an extreme value distribution, the probability that a family chooses a particular payment instrument is
| (3) | ||
| (4) | ||
| (5) | ||
| (6) |
where
![]() and
and
![]() is the cumulative
distribution function of the error term. In the estimation that
follows, different distributional assumptions for the error term -
normal and logistic - will determine the numerical
probabilities.
is the cumulative
distribution function of the error term. In the estimation that
follows, different distributional assumptions for the error term -
normal and logistic - will determine the numerical
probabilities.
As a final note, the consumer chooses the payment instrument most appropriate for each transaction. This captures the idea that consumers may consider a debit card transaction for a grocery store purchase different from a debit card transaction for a mortgage payment. If it is assumed that consumers make more than one type of transaction, and thus make more than one decision, it is likely that consumers use more than one type of payment. Differentiating the decisions by both payment instrument and transaction type allows the model to capture the multihoming seen in the data.
Estimation procedure
Due to data limitations, not all of the parameters of the model in (2) can be estimated. Advantages of the SCF include its well-documented and rigorous sampling structure and its extensive demographic characteristics; disadvantages include the lack of information on factors that may influence payment choice. To start, the data do not contain information on attributes of different payment instruments available to the consumer. For example, there is no information on fees charged for debit card use, ACH payment use, or per-check fees. These fees likely affect consumer payment choices.
Another data limitation is that the SCF does not ask questions that would be useful to determine the influence of transaction characteristics. Although the data include information on whether the family uses a debit card, for example, there is no information on where they use the debit card. Families may choose to use debit cards relatively more often at grocery stores than at restaurants because, in general, grocery stores have PIN pads and restaurants do not.
In addition, the econometrician does not observe the supply side - the financial institutions' decisions on what types of payment instruments to offer families. Although the SCF does contain some information on past bankruptcies - which could lend insight into credit constraints - and information on credit card interest rates - which could proxy for the riskiness of the borrower - including these in the estimation may introduce bias in the estimates and thus may not be a good proxy for supply concerns.
But, as noted elsewhere, data on payment systems are scarce.19 Thus, the advantages of using the SCF to study payment choice outweigh the disadvantages detailed above. However, the data limitations will influence the estimation procedure.
In particular, the data limitations imply that the model must be estimated on the vector of consumer characteristics only. The lack of fee or other relevant data related to payments noted above implies that there is no variation in the data for the choices, only variation across families. Essentially, the estimated parameters are family characteristic hedonics for using or holding particular payment instruments.
Thus, in order to estimate the effect of different
characteristics on payment choice, one must construct parameters
for each characteristic specific for each choice. The coeffiecients
![]() in equation
(2) become
in equation
(2) become ![]() . Because utility is a relative concept, adding
the same constant to the utility of each choice does not alter the
family's decision problem. This feature makes it necessary to
normalize the coefficients relative to one of the possible
outcomes.
. Because utility is a relative concept, adding
the same constant to the utility of each choice does not alter the
family's decision problem. This feature makes it necessary to
normalize the coefficients relative to one of the possible
outcomes.
However, there is still a need to capture three things in the
data: the rise in the use of electronic payment, the incidence of
multihoming, and the substitutability of different payment
instruments. There are three estimation procedures used to tackle
these problems. The first model is a simple binomial model that
evaluates the probability of using or holding different payment
instruments. Estimates of this model provide one parameter set,
which reflects the probability of using or holding the particular
payment instrument, relative to not using or holding the payment
instrument. For this model, a normal distribution for the
unobserved error term in (6) is
assumed. With this assumption, the log-likelihood function of
![]() given
given
![]() is
is
| (7) |
where ![]() is an
indicator that consumer
is an
indicator that consumer ![]() uses or holds payment instrument
uses or holds payment instrument ![]() and
and ![]() is
the normal cumulative distribution function. Note that this
specification implies that transaction characteristics are subsumed
in the error term.
is
the normal cumulative distribution function. Note that this
specification implies that transaction characteristics are subsumed
in the error term.
The second model fits an ordered probit model, which uses the count of the number of different payment instruments used as the dependent variable. The values of the count range from zero to four. No distinction is made between using different combinations of payment instruments; rather, this model gives insight into the decision to hold multiple payment instruments. Because families choose a payment instrument for each transaction, the payment instrument chosen must yield the maximum utility. Aggregating these maxima over the set of transactions should preserve the fundamental utility ordering. Thus, the utility concept remains fundamentally the same as in the binomial model.
Let
 |
(8) |
where
This model implies the choice probabilities given ![]() as
as
|
(9) |
Setting
|
(10) |
where
Because the ordered probit model does not give insight into the most preferred combinations of payment instruments, the third model examines the multiple payment instrument decision a bit more closely and evaluates how families substitute one payment instrument for another. Four models are specified: debit and credit, debit and convenience user, debit and check, and debit card and direct payment. The different pairings allow evaulation of the dimensions over which families perceive payment instruments to be substitutes or complements. Debit cards and credit cards are physically similar and can often be used at the same types of locations. However, they potentially have very different effects on a family's balance sheet. Comparing debit cards and convenience use of credit cards gives perspective on the use of credit cards simply for transactions, and not for exensions of credit. Debit cards and checks provide insight into newer versus older forms of payment that act directly on a bank account and can be used at the point of sale, while debit cards and direct payment elucidate electronic payment adoption behavior.
Both multinomial logit models and nested multinomial logit models are estimated. Tests are performed to see whether the multinomial assumptions are adequate to answer the research question, as the multinomial logit model is a special case of the nested multinomial logit model. The probability of choosing a combination of payment instruments is specified as
|
(11) |
where ![]() denotes the
combination of payment instruments chosen by family
denotes the
combination of payment instruments chosen by family ![]() ,
, ![]() subscripts all the nests,
subscripts all the nests, ![]() , and
, and ![]() defines the degree of
substitutability within the nest. If
defines the degree of
substitutability within the nest. If ![]() equals one, the model collapses to the
multinomial logit model. Whether this is the case is an empircal
question we explore later in the estimation results.
equals one, the model collapses to the
multinomial logit model. Whether this is the case is an empircal
question we explore later in the estimation results.
Estimation results
The subsample used in the estimation procedure eliminates families with no income, zero or negative assets, and no affiliated financial institutions. Table 4 presents summary statistics on the subsample used in the estimation procedure, which are roughly in line with the entire (table 2). In addition, the public use SCF data set contains five implicates of the data. The binomial probit results reflect the estimated results corrected for imputation variance. The ordered probit and multinomial logit results reflect results from the first data implicate only. Results from the other data implicates are qualitatively similar.20 Finally, the SCF oversamples relatively wealthy families.21 Although the data include weights that could control for this data feature in the estimation, the nonlinearities of the model prevent them from being used effectively. In order to check how the sample affects the results, the models were run on subsamples that eliminated families with greater than $3.25 million in assets or $400,000 in income in 2001 dollars.22 This subsample contained 3,260 families in 2001, 3,231 families in 1998, and 3,273 families in 1995. In what follows, the results for the subsample are qualitatively similar, but in some instances, significance of parameter estimates change. In order to aid comparability across time, all results are in 2001 dollars.
Binomial probit results
The first part estimates binomial probits of the probability of using or having debit cards, credit cards, direct payment and checks. It uses the EM algorithm, and is estimated using maximum likelihood techniques.23 The probability of using or holding one of these instruments depends on consumer characteristics from one of three groups. The first group is financial characteristics - income, number of financial institutions, and homeownership. The second group is demographic - age of head, education, number of children, marital status, female headed household, or ethnicity. The third group reflects employment status - self-employed, retired, number of years with employer, and an indicator of the number of years with employer being less than one. Tables 5 (a) through (d) report the binomial probit results. The first column of figures under each year is the parameter estimates, the second column is the marginal effect of the variable. For continuous variables - log income, squared log income, number of institutions, number of children, number of years with employer - the marginal effect is the average across observations of the derivative of the probability with respect to the variable. In other words, one takes the parameter estimates and calculates each observation's marginal probability with respect to income. These marginal probabilities are then averaged across observations. For the dummy variables, the marginal effect is calculated as the average of the differences across observations between the probability of using or having with the dummy variable set to one, and set to zero.
Across all years, higher income families seem more likely to use debit cards, but the negative coefficient on the square of log income indicates that this use rate increases at a decreasing rate. This observation is consistent with the simple plot in figure 1(a), where debit card use rises, then falls with income. A family likely needs a certain level of income in order to have general access to financial services, but as income rises, families may start to substitute other forms of payment for debit cards. As discussed below, wealthier consumers may substitute convenience use of credit cards for debit cards.
More education also leads to a higher probability of debit card use. Although income and education are correlated, these two variables have separate effects in the specficiation. In a study of young Finnish consumers, Hyytinen and Takalo (2004) found that more informed consumers are more likely to use newer forms of payment. The education result here could be broadly consistent with this phenomenon.24
The older age category dummies have negative coefficients, which implies that younger families are more likely to use a debit card than older families. In 2001, the coefficient on nonwhite is positive and significant. Except for the 1995 survey, self-employed, retired, and number of years with employer are negatively correlated with the probability of using a debit card. These could be isolating effects due to income and age that are not picked up by these other variables. Tests show that the data have significant multicollinearity; thus the results should be interpreted as broadly indicating that debit cards are generally used by higher income, younger, and more educated families.25
The marginal effects reported in the last columns indicate that a one percent change in income and age lead to larger changes in the probability of using or holding these payment instruments than the other variables. The magnitude of the income effect decreases over time, while the magnitude of the age effect increases. The pseudo-R squared statistics indicate that these variables explain a modest amount of the variation in debit card use. However, this variation seems to be better explained in later years; in 2001, the level of this statistic reaches over ten percent. Supply factors may explain some of the variation in earlier years, but it is difficult to test this hypothesis with the available data.
Turning to bank credit card holdings, the coefficient on log income is positive and significantly different from zero in all survey years, while the coefficient on non-homeowner is negative and significant. Both of these variables point to the importance of income and assets as determinants for bank credit card holdings. More education indicates a higher credit card holding rate, and the number of children and nonwhite families indicate a lower holding rate.26 In contrast to the debit card results, the retired variable is not significantly different from zero in all survey years.
Convenience use of credit cards is positively correlated with age and education. This is an interesting contrast to the debit card results, which indicate that debit card use is negatively correlated with age, possibly suggesting that older families tend to be less credit constrained than younger families. Consistent with this view is that retired families are more likely to be convenience users, and non-homeowners are less likely. It may also reflect cohort differences in attitudes towards debit cards.
Using direct payment is positively correlated with income across all years in the sample. Interestingly, older families seem significantly less likely to use direct payment in the earlier years of the sample but not in the later years. This could point to significant supply effects for some types of payments; for example, more insurance companies or utilities may have started to offer direct payment to all customers. Similar to other electronic payment use, education is positively correlated with direct payment use, but nonwhite families are less likely to use direct payment. Renters seem less likely to use direct payment. In general, mortgages may be paid with electronic payments, but rent payments are less likely to be paid electonically. The amount of variation explained in the data by these variables seems modest, as shown by the pseudo R-squared statistic.
The final table shows the results from estimating the probability that families use a check as a main way to do business with a financial institution. Similar to debit card use, income and higher education are significantly positively correlated with check use. However, similar to credit card use, nonwhite and nonhomeowner status are significantly negatively correlated.
Importantly, the binomial probit results and the binomial logit results are generally qualitatively similar, indicating that the results are relatively robust to distributional assumptions.
Ordered probit results
Table 2 (b) presented summary statistics suggesting a rise in multihoming over the sample period. In order to investigate this phenomenon more thoroughly, tables 6(a), (b) and (c) present results from estimating an ordered probit for the number of payment instruments used in 1995, 1998, and 2001. The four payment instruments examined are debit cards, credit cards, direct payment, and checks in 1998 and 2001, and the three payment instruments examined in 1995 are debit cards, credit cards, and direct payment. The explanatory variables are the same as were used in section 4.1.
Similar to the binomial results, the characteristics that explain multihoming behavior are relatively constant across time. The number of payment instruments used is positively correlated with income, which could proxy for differential access to financial services across the income distribution. Age is negatively correlated with multihoming. This could point to increased adoption behavior by younger families than by older families. Unmarried hourseholds are less likely to multihome, potentially indicating different payment preferences within a household.27 Non-homeowners are less likely to multihome; this could be a result of the fact that many mortgages are paid with direct payments, and thus, increase the number of payments used by any family. The self-employed are less likely to multihome; other researchers have found evidence that the self-employed differ somewhat in payment preferences from the general population.28
In general, the results suggest that the adoption of debit cards by young families over the period did not imply completely eliminating other forms of payment. Although not directly estimable from these data, the results are consistent with families holding multiple payment instruments, using one for its best suited purpose. The next section investigates the correlation between familly characteristics and using different pairs of payment instruments.
Multinomial logit results
The final step in the analysis is to see what factors affect the decision to hold multiple payment instruments and to understand how the decisions to use or hold multiple payment instruments are correlated. To this end, joint choices of payment instruments are constructed, and the estimation procedure assumes that families choose the one that maximizes their utility. As explained in section 3.2 the estimation procedure uses only a subset of the potential combinations. The tables report estimation results on the decisions to use debit cards and to hold credit cards; decisions to use debit cards and to be convenience users; decisions to use debit cards and to use checks as a main way to interact with a financial institution; and decisions to use direct payments and use checks as a main way to interact with a financial institution. In each case, there are four possible outcomes. For example, in the debit card, credit card choice the outcomes are: do not use a debit card, do not use a credit card; do not use a debit card, use a credit card; use a debit card, do not use a credit card; and use a debit card, use a credit card. The specification uses the "do not use" both instruments as the normalized outcome, and the reported coefficients are relative to this outcome.
The reported results show how family characteristics are correlated with the use or holdings of these combinations of payment instruments. The specification assumes that the unobserved part of utility is distributed with a multinomial logistic distribution. Because the logistic distribution exhibits the independence from irrelevant alternatives property, estimation results on a subset of the possible combinations lead to the same odds ratios as estimation results on all of the possible combinations.
Tables 7 (a) through 7 (k) report the results.29 The first column under each year reports the parameter estimate, the second reports the standard error, and the third reports the marginal effect of the variable. These are calculated as the change in the marginal probability of use or holding with a change in the independent variable. The parameters used to evaluate these changes are the estimated parameter minus the mean of the parameters across choices. Thus, it is possible that a reported coefficient and a marginal effect have different signs.
In general, the results reveal the following trends. Across all combinations, debit card use is generally negatively correlated with age, and positively correlated with education. In most cases, these correlations are significant. Married families are more likely to use more than one instrument than nonmarried families, and homeowners are more likely to use more than one instrument than nonhomeowners. These results are consistent across time. The married results may point to differences in preferences within a family, although given the data construction, it is difficult to tell. Homeowners most likely use direct payment for a mortgage, and this would cause an increase in the number of instruments a family uses or holds, all other things equal.
The most striking difference in the multinomial results from the binomial results are the income results. In some cases, the multinomial income coefficients are negative, while they are positive in similar binomial results. There are a few potential explanations for this difference. As explained above, the SCF oversamples wealthy families. Interpreting income coefficients without sample weights can be difficult, but using sample weights in nonlinear estimation routines can be problematic. In addition, in some of the specifications, one of the choices - using a debit card, but not using the other instrument - has a small number of respondents in each survey year. For example, in the debit card, credit card choice results, in 2001, debit card only users represented 316 families, or an unweighted 7.48 percent of the sample; in 1998, 232 families or an unweighted 5.70 percent of the sample, and in 1995, 100 families, or an unweighted 2.48 percent of the sample. Thus, the coefficients may need to be interpreted with care. Moreover, there is significant multicollinearity in the data. Because there are many more parameters to estimate in the multinomial specification than in the binomial specification, the multicollinearity in the data may contribute to the sign changes for some of the parameters.
In order to evaluate the substitutability of different payment instruments, the next step was to estimate a nested logit model. The nests were formed as follows.30 Using neither of the pair of payment instruments and using both of the payment instruments were each their own nests, while using one or the other payment instrument were nested. This lends insight into how families multihome. Specifically, an inclusive parameter in the nested logit that is significantly different from and less than one will indicate that families view the two payment instruments as an either-or decision. Either they use one payment instrument, or they use the other payment instrument. Alternatively, an inclusive parameter that is not significantly different from one indicates little difference between the nested logit model and the multinomial logit model, implying no discernable pattern between choosing neither, either-or, or both payment instruments. An inclusive parameter greater than one, although somewhat at odds with theory, possibly indicates that families may be more likely to use both of the payment instruments.
Accordingly, as shown in Table 8, the results suggest that using debit cards and credit cards were viewed as an either-or decision in 1995, but then grew to a both decision in 2001. Dividing this result further suggests that families view debit card and convenience use of credit cards as an either-or decision. The debit and check use results suggest no regular pattern, as the nested multinomial logit model cannot be distinguished from a multinomial logit model. Together with the direct payment and check use result in the last line of the table, these results suggest that there may be less systematic variation in families' preferences for check writing, or more likely, it is difficult to uncover systematic preferences for check writing using these data. The debit card and direct payment results suggest that families view debit card use and direct payment use as an either-or decision; however, the standard errors on these estimates are fairly large and thus the results are not easily interpreted.
Conclusion
This paper shows that families' use and holdings of payment instruments depends critically on their income, age, and demographic characteristics. Despite significant increases in the levels of use and holdings, the family characteristics that predict use and holdings of each instrument are generally the same across time. This paper first shows that payment use and holdings are significantly correlated with consumer characteristics, and showed that these results are consistent across time. It also documents the rise in multihoming, providing insight into the factors that predict multihoming by families. With that information in mind, it estimated joint decisions to use and hold different payment instruments. This is an important exercise, as many families hold more than one of each of these payment instruments.
In general, families that are younger, higher income, and better educated are more likely to use electronic payment instruments, and more than one payment instrument. The patterns of substitution across payment instruments differ. Most notably, debit card use and convenience credit card use seem to be strong substitutes, while other combinations of payments do not exhibit these tendencies. In future research, it would be interesting to explore these substitutions further, to see if more complete data provides additional insight into consumer payment behavior.
Consumers and businesses may continue to substitute electronic payments for check payments in the future. Most importantly, the shift in payments from paper to electronics represents a societal change in the way that people go about their every day business. For years, industry participants have waited for "the checkless society". The data indicate that while not here, the checkless society may be speeding its approach. It is important to understand family-level behavior in light of this signficant overall change in the U.S. payment system.
Acknowledgments
I thank Kenneth Kopecky, two anonymous referees, and David Van
Hoose for thoughtful comments on the paper. I also thank Geoff
Gerdes, Diana Hancock, Kathleen Johnson, Jeff Marquardt, David
Mills, Kevin Moore, Travis Nesmith, Bill Nelson, Leo Van Hove,
Jonathan Zinman and seminar participants at the the Federal Reserve
Bank of Philadelphia and the Eastern Economic Association for
helpful comments and suggestions. I also thank Dan Dube and
Namirembe Mukasa for excellent research assistance.
Appendix: Survey of Consumer Finances Questions
The SCF contains both direct and indirect questions on payment choices. Respondents answer direct questions with "yes", "no" or "not applicable". The indirect questions ask respondents to name the "main ways" they interact with financial institutions. Respondents may answer these questions by choosing from a list of potential responses on the screen, or choose another response. Respondents may also choose more than one response.
While the debit card use, credit card holdings and direct payment use direct responses, the check use statistics use the indirect responses from the "main ways" question. The 1998 and 2001 waves of the Survey include check use in the provided responses, but not in the 1995 wave.31 Thus, although the data do not measure check writing directly, this measure may be correlated with check writing. The statistics reported in this paper should be interpreted with these differences in mind.
Below, a * indicates a reponse provided to the survey respondent.
- Direct questions: 1995, 1998, 2001
A debit card is a card that you can present when you buy things that automatically deducts the amount of the purchase from the money in an account that you have.
Do you use any debit cards? Does your family use any debit cards?
INTERVIEWER: WE CARE ABOUT USE, NOT WHETHER R HAS A DEBIT CARD
1. *YES
5. *NO
- Indirect questions: 1998, 2001
(SHOW CARD 4) What are the main ways (you do/your family does) business with this institution [-by check, by ATM (cash machine), by debit card, in person, by mail, by talking with someone on the phone, by touchtone service on the phone, by direct deposit or withdrawal, by computer or online service, by other electronic transfer, or some other way]? Please start with the most important way.
CODE ALL THAT APPLY: CODE MAIN METHOD FIRST AND REMAINDER
IN ORDER GIVEN
1. *CASH MACHINE/ATM/debit card
2. *IN PERSON
3. *MAIL
4. *PHONE - TALKING
5. *DIRECT DEPOSIT
6. *DON'T DO REGULAR BUSINESS
7. *PHONE - USING TOUCHTONE SERVICE
8. *DIRECT WITHDRAWAL/PAYMENT
9. *OTHER ELECTRONIC TRANSFER
10. *CHECK
11. R's agent or manager; personal banker; go-between (this is a broad category that encompasses both formal and informal relationships)
12. *COMPUTER/INTERNET/ONLINE SERVICE
30. Fax Machine
33. Credit card
-7. *OTHER
0. Inap. (no institutions: X8300=-1/fewer than 2 institutions: 2/fewer than 3 institutions: X8300 3/ fewer than 4 institutions: X8300 4/fewer than 5 institutions: X8300 5/fewer than 6 instiutions: X8300 6)
Table 1(a): Noncash retail payments: Number and share, 1995, 1998, 2001
| Number of payments (in millions) 1995 | Number of payments (in millions) 1998 | Number of payments (in millions) 2001 | Share of payments 1995 | Share of payments 1998 | Share of payments 2001 | |
|---|---|---|---|---|---|---|
| Debit cards1 | 1,553.8 | 5,730.7 | 12,452.7 | 0.03 | 0.08 | 0.16 |
| Credit cards2 | 11,172.0 | 13,422.4 | 17,090.1 | 0.17 | 0.19 | 0.22 |
| Bank cards | 6,682.5 | 8,522.9 | 11,391.4 | 0.10 | 0.12 | 0.14 |
| MasterCard | 2,321.7 | 2,839.7 | 4,094.5 | 0.04 | 0.04 | 0.05 |
| VISA | 3,727.1 | 4,948.4 | 6,236.9 | 0.06 | 0.07 | 0.08 |
| ACH items | 3,489.7 | 5,329.9 | 8,060.9 | 0.05 | 0.08 | 0.10 |
| Federal Reserve ACH5,6 | 2,645.0 | 3,719.0 | 5,348.7 | 0.04 | 0.05 | 0.07 |
| Private ACH7 | 249.7 | 553.9 | 754.1 | 0.00 | 0.01 | 0.01 |
| "On-us" ACH | 595.0 | 1,057.0 | 1,958.1 | 0.01 | 0.02 | 0.02 |
| Subtotal: Electronic payments | 16,215.5 | 24,483.0 | 37,603.7 | 0.25 | 0.35 | 0.48 |
| Checks paid | 49,500.0 | 45,169.7 | 41,222.6 | 0.75 | 0.65 | 0.52 |
| Total | 65,715.5 | 69,652.7 | 78,826.3 | 1.00 | 1.00 | 1.00 |
Table 1(b): Noncash retail payments: Value and share, 1995, 1998, 2001
| Value of payments (in billions of 2001 U.S. dollars) 1995 | Value of payments (in billions of 2001 U.S. dollars) 1998 | Value of payments (in billions of 2001 U.S. dollars) 2001 | Share of payments 1995 | Share of payments 1998 | Share of payments 2001 | |
|---|---|---|---|---|---|---|
| Debit cards2 | 73.0 | 259.1 | 571.8 | 0.00 | 0.01 | |
| Credit cards3 | 991.6 | 1,228.6 | 1,514.4 | 0.02 | 0.02 | |
| Bank cards3 | 625.4 | 815.1 | 1,013.1 | 0.01 | 0.02 | |
| MasterCard | 230.1 | 299.4 | 421.2 | 0.00 | 0.01 | |
| VISA | 395.3 | 515.7 | 591.9 | 0.01 | 0.01 | |
| ACH items | 14,213.9 | 20,158.0 | 23,057.9 | 0.31 | 0.36 | |
| Federal Reserve ACH4,5 | 10,383.9 | 13,393.0 | 15,235.8 | 0.21 | 0.24 | |
| Private ACH6 | 1,272.7 | 2,719.2 | 2,400.7 | 0.04 | 0.04 | |
| "On-us" ACH | 2,558.3 | 4,045.8 | 5,421.4 | 0.06 | 0.08 | |
| Subtotal: Electronic payments | 15,278.50 | 21,645.70 | 25,144.1 | n.a. | 0.33 | 0.39 |
| Checks paid | n.a. | 43,650.3 | 38,909.1 | 0.67 | 0.61 | |
| Total | n.a. | 65,296.0 | 64,053.2 | n.a. | 1.00 | 1.00 |
| 1. | Includes PIN-based (online) and signature-based (offline) transactions. |
| 2. | Includes bank, travel and entertainment, retailer, and oil company card transactions. |
| 3. | Bank cards include Visa and MasterCard credit cards. |
| 4. | Includes all government and commercial items. |
| 5. | Includes items sent by private automated clearing houses to the Federal Reserve |
| for transmission to the receiving bank. | |
| 6. | Does not include "on-us" items. |
| Sources: | The Nilson Report (HSN Consultants Inc., Oxnard, CA); Federal Reserve; |
| National Automated Clearing House Association. |
Table 2 (a): Use and holdings of payment instruments1
| 1995 | 1998 | 2001 | |
|---|---|---|---|
| Use a debit card | 17.6 (0.04) |
33.8 (0.07) |
47.0 (0.04) |
| Use a debit card, have checking account | 16.5 (0.00) |
31.7 (0.00) |
42.1 (0.00) |
| Use a debit card, no checking account | 1.1 (0.00) |
2.1 (0.00) |
4.9 (0.00) |
| Do not use a debit card, checking account | 64.4 (0.00) |
49.8 (0.00) |
39.7 (0.00) |
| Do not use a debit card, no checking account | 18.0 (0.00) |
16.4 (0.00) |
13.3 (0.00) |
| Have a credit card | 74.4 (0.04) |
72.5 (0.14) |
76.2 (0.08) |
| Bank card2 | 66.4 (0.07) |
67.5 (0.18) |
72.7 (0.10) |
| Convenience users3 | 24.5 (0.17) |
25.1 (0.33) |
28.6 (0.18) |
| Retailer card | 57.6 (0.08) |
50.0 (0.16) |
45.2 (0.07) |
| Gas card | 24.7 (0.06) |
19.2 (0.12) |
16.1 (0.06) |
| Use direct deposit4 | 46.7 (0.11) |
60.5 (0.11) |
67.3 (0.11) |
| Paycheck | 26.9 (0.08) |
38.3 (0.18) |
45.2 (0.17) |
| Social Security | 17.3 (0.11) |
21.0 (0.07) |
22.0 (0.08) |
| Use direct payment5 | 21.8 (0.11) |
36.0 (0.06) |
40.3 (0.15) |
| Utility bills | 4.5 (0.04) |
8.4 (0.07) |
11.7 (0.14) |
| Mortgage/Rent | 6.0 (0.06) |
9.2 (0.07) |
12.8 (0.12) |
| Insurance | 8.9 (0.07) |
17.2 (0.04) |
18.6 (0.06) |
| Have an ATM card | 62.5 (0.00) |
67.4 (0.00) |
69.8 (0.00) |
| "Main ways" to do business with financial
institution: Check |
n.a. | 75.4 (0.00) |
76.6 (0.00) |
| "Main ways" to do business with financial
institution: Cash machine/ATM/Debit card |
31.6 (0.00) |
50.1 (0.00) |
54.0 (0.00) |
| 1. | In percent of families. For details, see Aizcorbe et al. (2003). |
| 2. | Bank credit cards include Visa, MasterCard, Discover and Optima cards. |
| 3. | Percent of all families. Defined as families who had new charges on their last bill and had no balance after the last payment was made on the account. |
| 4. | Percent of all families. Families may use more than one direct deposit. |
| 5. | Percent of all families. Families may use more than one direct payment. |
Standard errors of the means are in parentheses. Standard errors are corrected for sampling error, imputation variance and nonresponse.
Table 2 (b): Use and holdings of multiple payment instruments
| 1995 | 1998 | 2001 | |
|---|---|---|---|
| Use debit card and have a bank card | 14.5 | 26.7 | 37.8 |
| Use debit card and use direct payment | 5.6 | 16.1 | 23.2 |
| Use debit card and use check | 31.0 | 41.9 | |
| Have bank card and use direct payment | 18.1 | 30.3 | 34.4 |
| Have bank card and use check | 60.5 | 64.4 | |
| Use direct payment and use check | 33.5 | 36.7 | |
| Use debit card, have bank card, use direct payment | 4.8 | 13.6 | 20.0 |
| Use debit card, have bank card, use check | 24.7 | 34.7 | |
| Have bank card, use direct payment, use check | 28.6 | 31.6 | |
| Use debit card, have bank card, use direct payment, use check | 12.9 | 18.6 | |
| Median number of use and holdings (debit, credit, direct) | 1.0 | 2.0 | 2.0 |
| Average number of use and holdings (debit, credit, direct) | 1.5 | 2.0 | 2.3 |
| Median number of use and holdings (all) | 2.0 | 3.0 | |
| Average number of use and holdings (all) | 2.3 | 2.5 |
Table 2 (c): 2001 SCF: Debit card use by bank credit card holding
| Bank credit card holdings and use | Use a debit card | Do not use a debit card | Percent of all families |
|---|---|---|---|
| Convenience users: Percent of convenience users (row %) |
43.9 | 56.1 | 100.0 |
| Convenience users: Percent of debit card users (column %) |
26.7 | 30.2 | 28.6 |
| Convenience users: Percent of all families (table %) |
12.6 | 16.0 | 28.6 |
| Borrowing users: Percent of borrowing users (row %) |
59.1 | 40.9 | 100.0 |
| Borrowing users: Percent of debit card users (column %) |
37.8 | 23.2 | 30.0 |
| Borrowing users: Percent of all families (table %) |
17.7 | 12.3 | 30.0 |
| Only holding: Percent of only holders (row %) |
44.5 | 55.5 | 100.0 |
| Only holding: Percent of debit card users (column %) |
4.9 | 5.4 | 5.1 |
| Only holding: Percent of all families (table %) |
2.3 | 2.8 | 5.1 |
| Borrowing non-users: Percent of non-users (row %) |
58.1 | 41.9 | 100.0 |
| Borrowing non-users: Percent of debit card users (column %) |
11.1 | 7.1 | 9.0 | Borrowing non-users: Percent of all families (table %) |
5.2 | 3.8 | 9.0 |
| Do not have a bank credit card: Percent of non-holders (row %) |
33.7 | 66.3 | 100.0 |
| Do not have a bank credit card: Percent of debit card users (column %) |
33.7 | 66.3 | 100.0 |
| Do not have a bank credit card: Percent of all families (table %) |
9.2 | 18.1 | 27.3 |
| All families: Percent of all families (row %) |
47.0 | 53.0 | 100.0 |
| All families: Percent of debit card users (column %) |
100.0 | 100.0 | 100.0 |
| All families: Percent of all families (table %) |
47.0 | 53.0 | 100.0 |
Table 3: Variable definitions
| Use a debit card | Equals 1 if family uses a debit card |
| Have a bank card | Equals 1 if family has a bank credit card |
| Use direct payment | Equals 1 if family uses direct payment |
| Use check | Equals 1 if family uses check as a main way to interact with a financial institution |
| Convenience user | Equals 1 if family has a bank credit card,who had new charges on their last bill, and had no balance after the last payment was made on the account. |
| Income, log | Log of family income, in 2001 dollars |
| (Income, log)2 | Log of family income squared, in 2001 dollars |
| No. of institutions | Number of institutions where family has accounts or financial business |
| Age of head: 35-44 |
Indicates head of family is between 35-44 years old |
| Age of head: 45-54 |
Indicates head of family is between 45-54 years old |
| Age of head: 55-64 |
Indicates head of family is between 55-64 years old |
| Age of head: 65-74 |
Indicates head of family is between 65-74 years old |
| Age of head: 75 or more |
Indicates head of family is over 75 years old |
| Education: High school |
Indicates head of family's highest attained education level |
| Education: Some college |
Indicates head of family's highest attained education level |
| Education: College degree |
Indicates head of family's highest attained education level |
| Number of children | Number of children in family |
| Unmarried | Indicates head of family is unmarried |
| Female | Indicates head of family is female |
| Nonwhite | Indicates head of family is nonwhite |
| Self-employed | Indicates head of family is self-employed |
| Retired | Indicates head of family is retireed |
| Years with employer | Number of years head of family worked for current employer |
| (indicates less than one) | If years with employer is less than one |
| Does not own home | Indicates nonhomeowner |
Table 4: Sample summary statistics
| 1995 | 1998 | 2001 | |
|---|---|---|---|
| Use a debit card | 19.1 (0.04) |
36.0 (0.07) |
49.5 (0.04) |
| Have a bank card | 71.6 (0.08) |
71.6 (0.20) |
76.8 (0.10) |
| Use direct payment | 23.6 (0.11) |
38.4 (0.06) |
42.7 (0.16) |
| Convenience user | 26.3 (0.00) |
26.7 (0.00) |
30.2 (0.00) |
| Check | n.a. | 79.8 (0.00) |
81.0 (0.00) |
| Income, log | 10.3 (0.00) |
10.4 (0.01) |
10.6 (0.00) |
| (Income, log)2 | 107.3 (0.10) |
109.9 (0.22) |
113.9 (0.10) |
| No. of institutions | 3.3 (0.02) |
3.5 (0.02) |
3.4 (0.01) |
| Age of head: 35-44 |
22.8 (0.02) |
23.6 (0.01) |
22.4 (0.01) |
| Age of head: 45-54 |
18.3 (0.02) |
19.6 (0.01) |
21.0 (0.02) |
| Age of head: 55-64 |
12.6 (0.01) |
13.2 (0.02) |
13.4 (0.01) |
| Age of head: 65-74 |
12.5 (0.01) |
11.4 (0.01) |
10.8 (0.01) |
| Age of head: 74 or more |
10.2 (0.01) |
9.9 (0.02) |
10.6 (0.01) |
| Education: High school |
31.7 (0.09) |
31.9 (0.16) |
31.6 (0.13) |
| Education: Some college |
19.3 (0.04) |
19.0 (0.09) |
18.9 (0.12) |
| Education: College degree |
33.0 (0.12) |
35.1 (0.29) |
35.8 (0.17) |
| Number of children | 0.8 (0.00) |
0.8 (0.00) |
0.8 (0.00) |
| Unmarried | 38.7 (0.11) |
39.6 (0.19) |
37.9 (0.15) |
| Female | 26.6 (0.11) |
26.5 (0.14) |
25.3 (0.14) |
| Nonwhite | 19.1 (0.04) |
19.6 (0.15) |
21.4 (0.09) |
| Self-employed | 10.5 (0.11) |
11.6 (0.24) |
12.1 (0.09) |
| Retired | 24.8 (0.05) |
23.3 (0.06) |
22.3 (0.04) |
| Years with employer | 6.5 (0.02) |
6.8 (0.03) |
7.3 (0.02) |
| (indicates less than one) | 6.7 (0.02) |
5.9 (0.02) |
6.4 (0.02) |
| Does not own home | 30.7 (0.01) |
30.4 (0.01) |
29.1 (0.01) |
| No. of observations | 4,033 | 4,070 | 4,227 |
Table 5(a): Use a debit card
| 1995 Estimate |
1995 Marginal effect |
1998 Estimate |
1998 Marginal effect |
2001 Estimate |
2001 Marginal effect |
|
|---|---|---|---|---|---|---|
| Income, log | 0.760** (0.203) |
0.187 | 0.312** (0.139) |
0.094 | 0.973** (0.159) |
0.342 |
| (Income, log)2 | -0.031** (0.008) |
-0.008 | -0.014** (0.006) |
-0.004 | -0.041** (0.006) |
-0.014 |
| No. of institutions | 0.013** (0.006) |
0.004 | 0.007 (0.007) |
0.003 | 0.012 (0.009) |
0.004 |
| Age of head: 35-44 |
-0.110 (0.074) |
-0.027 | -0.208** (0.069) |
-0.066 | -0.258** (0.069) |
-0.087 |
| Age of head: 45-54 |
-0.264** (0.080) |
-0.063 | -0.313** (0.073) |
-0.099 | -0.371** (0.071) |
-0.125 |
| Age of head: 55-64 |
-0.427** (0.097) |
-0.096 | -0.552** (0.086) |
-0.168 | -0.616** (0.083) |
-0.207 |
| Age of head: 65-74 |
-0.446** (0.114) |
-0.098 | -0.559** (0.105) |
-0.169 | -0.953** (0.103) |
-0.304 |
| Age of head: 75 or more |
-0.899** (0.148) |
-0.158 | -1.096** (0.138) |
-0.272 | -1.220** (0.120) |
-0.363 |
| Education: High school |
-0.002 (0.100) |
0.000 | 0.246** (0.089) |
0.079 | 0.098 (0.081) |
0.034 |
| Education: Some college |
0.263** (0.104) |
0.073 | 0.431** (0.094) |
0.145 | 0.334** (0.088) |
0.120 |
| Education: College degree |
0.319** (0.099) |
0.083 | 0.438** (0.090) |
0.141 | 0.283** (0.084) |
0.100 |
| No. of children | -0.025 (0.024) |
-0.007 | 0.019 (0.021) |
0.006 | -0.014 (0.020) |
-0.005 |
| Unmarried | -0.003 (0.078) |
-0.002 | -0.070 (0.068) |
-0.024 | -0.050 (0.068) |
-0.018 |
| Female | -0.042 (0.089) |
-0.011 | 0.021 (0.075) |
0.007 | -0.005 (0.074) |
-0.002 |
| Nonwhite | -0.037 (0.069) |
-0.008 | -0.156** (0.061) |
-0.051 | 0.119** (0.058) |
0.044 |
| Self-employed | -0.074 (0.064) |
-0.018 | -0.282** (0.057) |
-0.092 | -0.280** (0.056) |
-0.098 |
| Retired | -0.006 (0.102) |
-0.001 | -0.279** (0.091) |
-0.092 | -0.172** (0.086) |
-0.059 |
| Years with employer | -0.005 (0.003) |
-0.001 | -0.007** (0.003) |
-0.002 | -0.007** (0.002) |
-0.003 |
| (less than one) | 0.016 (0.107) |
0.004 | 0.110 (0.097) |
0.037 | -0.075 (0.097) |
-0.026 |
| Does not own home | 0.020 (0.065) |
0.005 | 0.019 (0.059) |
0.006 | 0.215** (0.057) |
0.076 |
| Intercept | -5.370** (1.214) |
-2.044** (0.836) |
-5.508** (0.967) |
|||
| Pseudo R2 | 0.048 | 0.078 | 0.113 | |||
| Likelihood ratio | 187.6 | 401.0 | 658.4 | |||
| No. of observations | 4,033 | 4,070 | 4,227 |
Table 5(b): Have a bank credit card
| 1995 Estimate | 1995 Marginal effect | 1998 Estimate | 1998 Marginal effect | 2001 Estimate | 2001 Marginal effect | |
|---|---|---|---|---|---|---|
| Income, log | 0.605** (0.259) |
0.116 | 1.121** (0.210) |
0.228 | 0.582** (0.210) |
0.119 |
| (Income, log)2 | -0.014 (0.012) |
-0.002 | -0.037** (0.009) |
-0.008 | -0.017(0.009) |
-0.004 |
| No. of institutions | 0.103** (0.018) |
0.020 | 0.134** (0.019) |
0.027 | 0.114** (0.019) |
0.022 |
| Age of head: 35-44 |
0.094 (0.081) |
0.018 | 0.053 (0.083) |
0.010 | 0.140 (0.082) |
0.027 |
| Age of head: 45-54 |
0.109 (0.090) |
0.019 | 0.048 (0.093) |
0.008 | 0.097 (0.088) |
0.020 |
| Age of head: 55-64 |
0.262** (0.113) |
0.048 | 0.138 (0.110) |
0.024 | 0.005 (0.105) |
0.002 |
| Age of head: 65-74 |
0.365** (0.134) |
0.065 | 0.190 (0.133) |
0.032 | 0.193 (0.133) |
0.040 |
| Age of head: 75 or more |
-0.026 (0.145) |
-0.006 | -0.178 (0.143) |
-0.039 | -0.209 (0.136) |
-0.044 |
| Education: High school |
0.530** (0.082) |
0.099 | 0.265** (0.086) |
0.048 | 0.436** (0.081) |
0.078 |
| Education: Some college |
0.843** (0.093) |
0.145 | 0.534** (0.097) |
0.094 | 0.644** (0.093) |
0.109 |
| Education: College degree |
1.104** (0.091) |
0.215 | 0.906** (0.094) |
0.176 | 0.834** (0.091) |
0.159 |
| No. of children | -0.122** (0.028) |
-0.024 | -0.108** (0.028) |
-0.022 | -0.107** (0.026) |
-0.021 |
| Unmarried | -0.268** (0.083) |
-0.055 | -0.178** (0.081) |
-0.035 | -0.086 (0.080) |
-0.017 |
| Female | 0.115** (0.089) |
0.024 | 0.032 (0.084) |
0.008 | -0.016 (0.083) |
-0.003 |
| Nonwhite | -0.268** (0.069) |
-0.056 | -0.280** (0.068) |
-0.06 | -0.206** (0.065) |
-0.042 |
| Self-employed | -0.068 (0.083) |
-0.017 | 0.028 (0.085) |
0.005 | 0.045 (0.086) |
0.010 |
| Retired | -0.118 (0.114) |
-0.023 | -0.035 (0.111) |
-0.004 | -0.044 (0.107) |
-0.008 |
| Years with employer | 1.892 E-4 (0.004) |
0.000 | 0.006 (0.004) |
0.001 | 0.008** (0.004) |
0.002 |
| (less than one) | -0.109 (0.110) |
-0.021 | -0.090 (0.113) |
-0.017 | -0.038 (0.110) |
-0.007 |
| Does not own home | -0.389** (0.065) |
-0.085 | -0.301** (0.066) |
-0.062 | -0.376** (0.065) |
-0.077 |
| Intercept | -4.853** (1.406) |
-7.589** (1.195) |
-4.102** (1.208) |
|||
| Pseudo R2 | 0.300 | 0.325 | 0.265 | |||
| Likelihood ratio | 1202.9 | 1370.6 | 1056.1 | |||
| No. of observations | 4,033 | 4,070 | 4,227 |
Table 5(d): Use direct payment
| 1995 Estimate | 1995 Marginal effect | 1998 Estimate | 1998 Marginal effect | 2001 Estimate | 2001 Marginal effect | |
|---|---|---|---|---|---|---|
| Income, log | 0.524** (0.171) |
0.154 | 0.496** (0.142) |
0.186 | 0.988** (0.159) |
0.357 |
| (Income, log)2 | -0.022** (0.007) |
-0.006 | -0.020** (0.006) |
-0.007 | -0.038 (0.006) |
-0.014 |
| No. of institutions | 0.010 (0.006) |
0.003 | 0.014** (0.007) |
0.006 | 0.049** (0.009) |
0.020 |
| Age of head: 35-44 |
-0.013 (0.074) |
-0.004 | -0.043 (0.070) |
-0.016 | 0.031 (0.071) |
0.015 |
| Age of head: 45-54 |
-0.023 (0.077) |
-0.007 | -0.020 (0.073) |
-0.007 | 0.019 (0.072) |
0.009 |
| Age of head: 55-64 |
-0.207** (0.091) |
-0.060 | -0.080 (0.085) |
-0.030 | -0.098 (0.084) |
-0.034 |
| Age of head: 65-74 |
-0.306** (0.106) |
-0.086 | -0.071 (0.101) |
-0.027 | -0.187 (0.102) |
-0.061 |
| Age of head: 75 or more |
-0.535** (0.127) |
-0.137 | -0.175 (0.117) |
-0.064 | -0.162 (0.113) |
-0.057 |
| Education: High school |
0.113 (0.090) |
0.035 | 0.166** (0.083) |
0.059 | 0.163** (0.081) |
0.059 |
| Education: Some college |
0.240** (0.096) |
0.076 | 0.437** (0.089) |
0.159 | 0.340** (0.088) |
0.129 |
| Education: College degree |
0.339** (0.090) |
0.107 | 0.432** (0.084) |
0.156 | 0.366** (0.083) |
0.138 |
| No. of children | 0.001 (0.023) |
0.000 | 0.004 (0.021) |
0.001 | 0.016 (0.020) |
0.006 |
| Unmarried | -0.148 (0.076) |
-0.046 | 0.069 (0.066) |
-0.024 | 0.023 (0.065) |
0.006 |
| Female | 0.138 (0.086) |
0.043 | -0.040 (0.073) |
0.015 | 0.094 (0.073) |
0.038 |
| Nonwhite | -0.247** (0.068) |
-0.072 | 0.011 (0.059) |
-0.002 | -0.163** (0.059) |
-0.055 |
| Self-employed | -0.064 (0.060) |
-0.018 | -0.145** (0.055) |
-0.052 | -0.094 (0.056) |
-0.036 |
| Retired | 0.046 (0.093) |
0.012 | -0.070 (0.086) |
-0.027 | -0.007 (0.086) |
-0.003 |
| Years with employer | -0.002 (0.003) |
-0.001 | -0.003 (0.003) |
-0.001 | -0.007** (0.002) |
-0.002 |
| (less than one) | -0.124 (0.111) |
-0.036 | -0.069 (0.100) |
-0.026 | -0.056 (0.099) |
-0.022 |
| Does not own home | -0.456** (0.065) |
-0.129 | -0.286** (0.058) |
-0.104 | -0.285** (0.058) |
-0.101 |
| Intercept | -3.735** (1.027) |
-3.520** (0.862) |
-6.646** (0.979) |
|||
| Pseudo R2 | 0.049 | 0.038 | 0.068 | |||
| Likelihood ratio | 223.1 | 207.5 | 393.5 | |||
| No. of observations | 4,033 | 4,070 | 4,227 |
Table 5(e): Convenience user
| 1995 Estimate | 1995 Marginal effect | 1998 Estimate | 1998 Marginal effect | 2001 Estimate | 2001 Marginal effect | |
|---|---|---|---|---|---|---|
| Income, log | 0.277 (0.206) |
0.086 | 0.180 (0.273) |
0.081 | 0.195 (0.231) |
0.053 |
| (Income, log)2 | 0.001 (0.009) |
0.000 | 0.011 (0.012) |
0.001 | 0.007 (0.010) |
0.002 |
| No. of institutions | 0.022** (0.010) |
0.004 | 0.013 (0.008) |
0.003 | 0.018 (0.009) |
0.006 |
| Age of head: 35-44 |
0.030 (0.084) |
0.008 | 0.049 (0.085) |
0.006 | 0.103 (0.084) |
0.036 |
| Age of head: 45-54 |
0.084 (0.085) |
0.026 | 0.046 (0.089) |
0.007 | 0.160** (0.083) |
0.044 |
| Age of head: 55-64 |
0.426** (0.098) |
0.118 | 0.230** (0.100) |
0.055 | 0.275** (0.096) |
0.077 |
| Age of head: 65-74 |
0.683** (0.116) |
0.193 | 0.485** (0.119) |
0.127 | 0.544** (0.116) |
0.155 |
| Age of head: 75 or more |
0.604** (0.129) |
0.169 | 0.445** (0.136) |
0.115 | 0.361** (0.128) |
0.098 |
| Education: High school |
0.519** (0.099) |
0.141 | 0.419** (0.104) |
0.108 | 0.373** (0.098) |
0.094 |
| Education: Some college |
0.729** (0.105) |
0.191 | 0.446** (0.113) |
0.119 | 0.459** (0.106) |
0.117 |
| Education: College degree |
1.136** (0.101) |
0.338 | 0.931** (0.105) |
0.267 | 0.860** (0.100) |
0.250 |
| No. of children | -0.140** (0.025) |
-0.038 | -0.067** (0.025) |
-0.017 | -0.059** (0.024) |
-0.017 |
| Unmarried | -0.076 (0.077) |
-0.021 | 0.042 (0.076) |
0.013 | 0.042 (0.074) |
0.014 |
| Female | -0.115 (0.088) |
-0.029 | -0.151 (0.087) |
-0.040 | -0.076 (0.083) |
-0.021 |
| Nonwhite | -0.429** (0.074) |
-0.112 | -0.365** (0.076) |
-0.091 | -0.462** (0.072) |
-0.128 |
| Self-employed | 0.230** (0.063) |
0.060 | 0.130** (0.062) |
0.035 | 0.237** (0.062) |
0.066 |
| Retired | 0.338** (0.098) |
0.095 | 0.476** (0.102) |
0.131 | 0.336** (0.098) |
0.094 |
| Years with employer | 0.004 (0.003) |
0.001 | 0.005 (0.003) |
0.001 | 2.869E (0.003) |
0.000 |
| (less than one) | -0.278** (0.127) |
-0.069 | -0.090 (0.128) |
-0.022 | -0.086 (0.118) |
-0.026 |
| Does not own home | -0.249** (0.067) |
-0.070 | -0.256** (0.068) |
-0.068 | -0.354** (0.065) |
-0.100 |
| Intercept | -4.465** (1.217) |
-4.482** (1.606) |
-4.057** (1.381) |
|||
| Pseudo R2 | 0.296 | 0.321 | 0.305 | |||
| Likelihood ratio | 1628.6 | 1775.6 | 1773.5 | |||
| No. of observations | 4,033 | 4,070 | 4,227 |
Table 5(h): Use check
| 1998 Estimate | 1998 Marginal effect | 2001 Estimate | 2001 Marginal effect | |
|---|---|---|---|---|
| Income, log | 0.344** (0.133) |
0.086 | 0.228** (0.151) |
0.057 |
| (Income, log)2 | -0.014** (0.005) |
-0.004 | -0.010** (0.006) |
-0.003 |
| No. of institutions | 0.015 (0.008) |
0.005 | 0.023** (0.012) |
0.008 |
| Age of head: 35-44 |
-0.130 (0.079) |
-0.033 | -0.103 (0.079) |
-0.026 |
| Age of head: 45-54 |
-0.036 (0.084) |
-0.008 | -0.106 (0.083) |
-0.024 |
| Age of head: 55-64 |
-0.135 (0.096) |
-0.033 | -0.186 (0.096) |
-0.049 |
| Age of head: 65-74 |
-0.164 (0.114) |
-0.041 | -0.174 (0.116) |
-0.047 |
| Age of head: 75 or more |
-0.131 (0.130) |
-0.028 | -0.182 (0.126) |
-0.046 |
| Education: High school |
0.200** (0.082) |
0.052 | 0.123** (0.083) |
0.026 |
| Education: Some college |
0.289** (0.091) |
0.073 | 0.241** (0.093) |
0.049 |
| Education: College degree |
0.392** (0.085) |
0.101 | 0.332** (0.087) |
0.078 |
| No. of children | 0.013 (0.024) |
0.003 | -0.041 (0.023) |
-0.010 |
| Unmarried | -0.086 (0.073) |
-0.025 | -0.134 (0.073) |
-0.036 |
| Female | -0.089 (0.078) |
-0.022 | -0.063 (0.078) |
-0.015 |
| Nonwhite | -0.224** (0.064) |
-0.061 | -0.250** (0.062) |
-0.067 |
| Self-employed | 0.021 (0.067) |
0.007 | -0.046 (0.068) |
-0.010 |
| Retired | -0.002 (0.097) |
-0.006 | -0.164 (0.096) |
-0.042 |
| Years with employer | -0.003 (0.003) |
-0.001 | -0.004 (0.003) |
-0.001 |
| (less than one) | -0.098 (0.107) |
-0.027 | 0.074 (0.113) |
0.019 |
| Does not own home | -0.210** (0.062) |
-0.055 | -0.389** (0.061) |
-0.105 |
| Intercept | -1.251 (0.792) |
-0.242 (0.918) |
||
| Pseudo R2 | 0.043 | 0.050 | ||
| Likelihood ratio | 169.1 | 220.0 | ||
| No. of observations | 4,070 | 4,227 |
Table 6(a): Ordered probit, 1995
Dependent variable: Payment instrument count (0,1,2,3,4)
| Income, log | 1.154 | 0.121 | 9.517 |
| (Income, log) | 0.044 | 0.005 | 8.844 |
| Age of head: 35-44 |
0.009 | 0.059 | 0.153 |
| Age of head: 45-54 |
0.081 | 0.062 | 1.311 |
| Age of head: 55-64 |
0.203 | 0.073 | 2.799 |
| Age of head: 65-74 |
0.220 | 0.084 | 2.631 |
| Age of head: 75 and over |
0.553 | 0.098 | 5.660 |
| Education: High school |
0.391 | 0.068 | 5.770 |
| Education: Some college |
0.704 | 0.073 | 9.688 |
| Education: College degree |
0.849 | 0.068 | 12.408 |
| No. of children | 0.055 | 0.019 | 2.940 |
| Unmarried | 0.170 | 0.059 | 2.904 |
| Female | 0.075 | 0.066 | 1.134 |
| Nonwhite | 0.251 | 0.052 | 4.851 |
| Self-employed | 0.085 | 0.048 | 1.757 |
| Retired | 0.014 | 0.074 | 0.197 |
| Years with employer | 0.002 | 0.002 | 0.704 |
| (less than one) | 0.100 | 0.084 | 1.182 |
| Does not own home | 0.436 | 0.049 | 8.819 |
| Intercept | 9.239 | 0.735 | 12.571 |
| Intercept 2 | 1.225 | 0.033 | 36.930 |
| Intercept 3 | 2.903 | 0.043 | 67.377 |
Table 6(b): Ordered probit, 1998
Dependent variable: Payment instrument count (0,1,2,3,4)
| Estimate | Std. error | T-stat | |
|---|---|---|---|
| Income, log | 0.871 | 0.102 | 8.516 |
| (Income, log) | 0.033 | 0.004 | 7.983 |
| Age of head: 35-44 |
0.129 | 0.057 | 2.251 |
| Age of head: 45-54 |
0.143 | 0.060 | 2.370 |
| Age of head: 55-64 |
0.288 | 0.069 | 4.167 |
| Age of head: 65-74 |
0.264 | 0.082 | 3.221 |
| Age of head: 75 and over |
0.516 | 0.094 | 5.467 |
| Education: High school |
0.344 | 0.064 | 5.332 |
| Education: Some college |
0.666 | 0.070 | 9.536 |
| Education: College degree |
0.767 | 0.066 | 11.587 |
| No. of children | 0.013 | 0.017 | 0.768 |
| Unmarried | 0.126 | 0.053 | 2.364 |
| Female | 0.024 | 0.059 | 0.407 |
| Nonwhite | 0.237 | 0.048 | 4.923 |
| Self-employed | 0.176 | 0.046 | 3.854 |
| Retired | 0.169 | 0.070 | 2.427 |
| Years with employer | 0.004 | 0.002 | 1.913 |
| (less than one) | 0.052 | 0.081 | 0.640 |
| Does not own home | 0.319 | 0.046 | 6.872 |
| Intercept | 6.857 | 0.620 | 11.056 |
| Intercept2 | 1.124 | 0.027 | 41.965 |
| Intercept3 | 2.188 | 0.034 | 65.030 |
| Intercept4 | 3.146 | 0.046 | 68.290 |
Table 6(c): Ordered probit, 2001
Dependent variable: Payment
instrument count (0,1,2,3,4)
| Income, log | 1.179 | 0.115 | 10.290 |
| (Income, log) | 0.046 | 0.005 | 9.954 |
| Age of head: 35-44 |
0.090 | 0.058 | 1.557 |
| Age of head: 45-54 |
0.154 | 0.059 | 2.608 |
| Age of head: 55-64 |
0.377 | 0.069 | 5.489 |
| Age of head: 65-74 |
0.504 | 0.083 | 6.103 |
| Age of head: 75 and over |
0.666 | 0.092 | 7.275 |
| Education: High school |
0.335 | 0.063 | 5.275 |
| Education: Some college |
0.644 | 0.069 | 9.341 |
| Education: College degree |
0.710 | 0.065 | 10.919 |
| No. of children | 0.038 | 0.017 | 2.292 |
| Unmarried | 0.075 | 0.053 | 1.401 |
| Female | 0.014 | 0.059 | 0.242 |
| Nonwhite | 0.180 | 0.047 | 3.827 |
| Self-employed | 0.172 | 0.047 | 3.705 |
| Retired | 0.173 | 0.069 | 2.497 |
| Years with employer | 0.006 | 0.002 | 3.044 |
| (less than one) | 0.052 | 0.080 | 0.658 |
| Does not own home | 0.343 | 0.046 | 7.477 |
| Intercept | 8.376 | 0.704 | 11.905 |
| Intercept2 | 1.124 | 0.025 | 45.363 |
| Intercept3 | 2.172 | 0.033 | 65.831 |
| Intercept4 | 3.199 | 0.051 | 63.181 |
Table 7(a): Debit vs. credit, 1995
| Do not use debit, use credit Estimate |
Do not use debit, use credit Std. error |
Do not use debit, use credit Marg. eff. |
Use debit, do not use credit Estimate |
Use debit, do not use credit Std. error |
Use debit, do not use credit Marg. eff. |
Use debit and credit Estimate |
Use debit and credit Std. error |
Use debit and credit Marg. eff. |
|
|---|---|---|---|---|---|---|---|---|---|
| Income, log | -0.516 | 0.586 | -0.202 | -0.830 | 1.116 | 0.011 | 0.736 | 0.740 | 0.112 |
| (Income, log)2 | 0.063 | 0.029 | 0.234 | 0.063 | 0.054 | 0.473 | 0.011 | 0.035 | 0.538 |
| Age of head: 35-44 |
0.138 | 0.154 | 0.093 | -0.189 | 0.286 | 0.020 | -0.070 | 0.185 | -0.004 |
| Age of head: 45-54 |
0.144 | 0.172 | -0.105 | -0.537 | 0.358 | -0.172 | -0.289 | 0.207 | -0.008 |
| Age of head: 55-64 |
0.483** | 0.213 | 0.076 | -1.007 | 0.530 | 1.443 | -0.251 | 0.260 | -0.019 |
| Age of head: 65-74 |
0.722** | 0.250 | -0.036 | -1.054 | 0.613 | -0.014 | -0.056 | 0.307 | -0.023 |
| Age of head: 75 and over |
-0.021 | 0.266 | 0.009 | -15.545 | 460.633 | 0.000 | -1.475** | 0.373 | -0.245 |
| Education: High school |
0.881** | 0.146 | -0.024 | -0.538 | 0.330 | 0.004 | 0.925** | 0.256 | 0.011 |
| Education: Some college |
1.481** | 0.171 | -0.024 | 0.251 | 0.345 | 0.014 | 1.874** | 0.271 | -0.004 |
| Education: College degree |
2.072** | 0.174 | -0.032 | 0.407 | 0.356 | -0.005 | 2.570** | 0.267 | 0.003 |
| No. of children | -0.194** | 0.052 | 3.597 | 0.011 | 0.101 | 0.289 | -0.235** | 0.064 | 0.178 |
| Unmarried | -0.415** | 0.155 | -0.001 | 0.394 | 0.321 | -0.007 | -0.454** | 0.195 | 0.010 |
| Female | 0.212 | 0.164 | -0.047 | -0.143 | 0.328 | 0.010 | 0.132 | 0.216 | -0.046 |
| Nonwhite | -0.413** | 0.128 | 0.098 | 0.194 | 0.245 | 0.139 | -0.525** | 0.171 | -0.006 |
| Self-employed | -0.124 | 0.161 | 0.011 | -0.415 | 0.382 | 0.676 | -0.197 | 0.186 | 0.082 |
| Retired | -0.270 | 0.211 | 0.108 | -0.084 | 0.475 | 0.142 | -0.270 | 0.269 | -0.015 |
| Years with employer | 0.003 | 0.007 | 0.244 | -0.031 | 0.021 | -0.035 | -0.005 | 0.009 | -0.165 |
| (less than one) | -0.264 | 0.204 | 0.008 | -0.577 | 0.415 | -0.011 | -0.042 | 0.249 | 0.001 |
| Does not own home | -0.820** | 0.119 | -0.005 | -0.145 | 0.250 | -0.009 | -0.694** | 0.156 | 0.001 |
| Intercept | -1.054 | 2.975 | 0.041 | 0.598 | 5.841 | -0.023 | -9.725** | 4.002 | -1.068 |
| Pseudo R2 | 0.420 | ||||||||
| Likelihood ratio | 4700.1 | ||||||||
| No. of observations | 2566 | 100 | 648 | ||||||
| Pred. prob. at data means | 0.656 | 0.007 | 0.148 |
Table 7(b): Debit vs. credit, 1998
| Do not use debit, use credit Estimate |
Do not use debit, use credit Std. error |
Do not use debit, use credit Marg. eff. |
Use debit, do not use credit Estimate |
Use debit, do not use credit Std. error |
Use debit, do not use credit Marg. eff. |
Use debit and credit Estimate |
Use debit and credit Std. error |
Use debit and credit Marg. eff. |
|
|---|---|---|---|---|---|---|---|---|---|
| Income, log | 1.045 | 0.646 | 0.237 | -0.690 | 0.484 | -0.006 | 1.379** | 0.658 | 0.150 |
| (Income, log)22 | -0.009 | 0.031 | 0.210 | 0.047 | 0.025 | 0.331 | -0.024 | 0.031 | 0.432 |
| Age of head | |||||||||
| Age of head: 35-44 |
0.260 | 0.177 | -0.008 | -0.148 | 0.224 | -0.121 | -0.204 | 0.178 | -0.006 |
| Age of head: 45-54 |
0.335 | 0.196 | -0.015 | -0.204 | 0.266 | -0.143 | -0.320 | 0.201 | -0.009 |
| Age of head: 55-64 |
0.661** | 0.230 | 0.171 | -0.125 | 0.317 | -1.283 | -0.450 | 0.245 | -0.009 |
| Age of head: 65-74 |
0.487 | 0.265 | 0.110 | -1.025** | 0.429 | -0.067 | -0.501 | 0.290 | -0.040 |
| Age of head: 75 and over |
-0.159 | 0.280 | 0.006 | -1.983** | 0.516 | 0.002 | -2.152** | 0.363 | -0.033 |
| Education: High school |
0.546** | 0.164 | -0.006 | 0.510 | 0.235 | 0.007 | 0.794** | 0.213 | 0.011 |
| Education: Some college |
1.055** | 0.191 | -0.021 | 0.758** | 0.269 | 0.019 | 1.602** | 0.231 | -0.011 |
| Education: College degree |
1.782** | 0.191 | -0.050 | 0.747** | 0.287 | -0.003 | 2.336** | 0.232 | 0.004 |
| No. of children | -0.214** | 0.058 | 0.641 | -0.003 | 0.075 | -0.027 | -0.161** | 0.059 | -0.052 |
| Unmarried | -0.199 | 0.165 | -0.001 | 0.179 | 0.234 | 0.009 | -0.389** | 0.179 | 0.021 |
| Female | 0.011 | 0.170 | -0.068 | -0.028 | 0.230 | 0.020 | 0.094 | 0.187 | -0.046 |
| Nonwhite | -0.521** | 0.137 | 0.441 | -0.312 | 0.183 | 0.209 | -0.671** | 0.147 | -0.008 |
| Self-employed | 0.221 | 0.182 | -0.042 | -0.324 | 0.290 | -0.204 | -0.248 | 0.192 | 0.050 |
| Retired | -0.077 | 0.220 | 0.125 | -0.241 | 0.317 | 0.193 | -0.593** | 0.249 | -0.009 |
| Yrs. with employer | 0.002 | 0.008 | 0.080 | -0.025 | 0.014 | -0.045 | -0.009 | 0.009 | -0.034 |
| (less than one) | -0.323 | 0.247 | -0.037 | 0.074 | 0.273 | -0.076 | -0.014 | 0.236 | 0.001 |
| Does not own home | -0.814** | 0.131 | -0.049 | -0.177 | 0.187 | -0.073 | -0.633** | 0.144 | -0.129 |
| Intercept | -9.431** | 3.427 | 0.021 | 1.279 | 2.395 | -0.024 | -11.334** | 3.517 | -1.304 |
| Pseudo R2 | 0.334 | ||||||||
| Likelihood ratio | 3772.6 | ||||||||
| No. of observations | 2099 | 232 | 1106 | ||||||
| Pred. prob. at data means | 0.537 | 0.061 | 0.284 |
Table 7(c): Debit vs. credit, 2001
| Do not use debit, use credit Estimate |
Do not use debit, use credit Std. error |
Do not use debit, use credit Marg. eff. |
Use debit, do not use credit Estimate |
Use debit, do not use credit Std. error |
Use debit, do not use credit Marg. eff. |
Use debit and credit Estimate |
Use debit and credit Std. error |
Use debit and credit Marg. eff. |
|
|---|---|---|---|---|---|---|---|---|---|
| Income, log | 0.664 | 0.513 | -0.322 | 1.268 | 0.712 | 0.016 | 2.292** | 0.553 | 0.182 |
| (Income, log)22 | -0.008 | 0.024 | 0.214 | -0.051 | 0.034 | 0.299 | -0.0766** | 0.025 | 0.582 |
| Age of head: 35-44 |
0.534** | 0.210 | -0.004 | -0.105 | 0.229 | 0.028 | -0.058 | 0.197 | -0.017 |
| Age of head: 45-54 |
0.719** | 0.224 | -0.121 | 0.072 | 0.251 | -0.240 | -0.090 | 0.214 | -0.012 |
| Age of head: 55-64 |
0.383 | 0.248 | 0.157 | -0.454 | 0.307 | 1.631 | -0.808** | 0.245 | -0.012 |
| Age of head: 65-74 |
0.648** | 0.293 | 0.065 | -1.549** | 0.474 | -0.015 | -1.064** | 0.300 | -0.070 |
| Age of head: 75 and over |
0.060 | 0.295 | 0.007 | -1.658** | 0.435 | 0.000 | -2.135** | 0.321 | -0.027 |
| Education: High school |
0.776** | 0.167 | -0.033 | 0.152 | 0.213 | 0.009 | 0.874** | 0.189 | 0.024 |
| Education: Some college |
1.223** | 0.210 | -0.042 | 0.606** | 0.258 | 0.007 | 1.668** | 0.223 | -0.020 |
| Education: College degree |
1.818** | 0.209 | -0.061 | 0.734** | 0.267 | -0.003 | 2.164** | 0.225 | -0.009 |
| No. of children | -0.164** | 0.061 | 0.590 | 0.013 | 0.069 | 0.080 | -0.177** | 0.060 | 0.029 |
| Unmarried | -0.222 | 0.182 | -0.001 | -0.126 | 0.231 | -0.005 | -0.311 | 0.185 | 0.050 |
| Female | -0.058 | 0.186 | -0.035 | -0.090 | 0.233 | 0.020 | 0.005 | 0.191 | -0.018 |
| Nonwhite | -0.427** | 0.153 | 0.126 | 0.173 | 0.176 | 0.359 | -0.194 | 0.150 | -0.012 |
| Self-employed | 0.228 | 0.212 | -0.157 | -0.400 | 0.294 | -0.338 | -0.214 | 0.215 | 0.106 |
| Retired | -0.144 | 0.232 | 0.187 | -0.407 | 0.309 | 0.224 | -0.363 | 0.242 | -0.026 |
| Yrs. with employer | 0.014 | 0.009 | 0.107 | -0.020 | 0.013 | -0.025 | 0.003 | 0.009 | -0.003 |
| (less than one ) | -0.143 | 0.269 | -0.029 | -0.275 | 0.292 | -0.015 | -0.204 | 0.252 | 0.002 |
| Does not own home | -0.868** | 0.147 | -0.070 | 0.342 | 0.181 | -0.125 | -0.469** | 0.148 | -0.194 |
| Intercept | -5.741** | 2.816 | 0.001 | -7.751** | 3.775 | -0.050 | -14.698** | 3.071 | -1.980 |
| Pseudo R2 | 0.313 | ||||||||
| Likelihood ratio | 3668.4 | ||||||||
| No. of observations | 1870 | 316 | 1595 | ||||||
| Pred. prob. at data means | 0.417 | 0.073 | 0.423 |
Table 7(d): Debit vs. convenience user, 1995
| Do not use debit, conv. Estimate |
Do not use debit, conv. Std. error |
Do not use debit, conv. Marg. eff. |
Use debit, not conv. Estimate |
Use debit, not conv. Std. error |
Use debit, not conv. Marg. eff. |
Use debit and conv. Estimate |
Use debit and conv. Std. error |
Use debit and conv. Marg. eff. |
|
|---|---|---|---|---|---|---|---|---|---|
| Income | 0.292 | 0.415 | -0.299 | 1.425** | 0.677 | 0.014 | 1.790** | 0.699 | 0.038 |
| (Income, log)22 | 0.013 | 0.018 | 0.117 | -0.056 | 0.031 | 0.249 | -0.047 | 0.029 | 0.295 |
| Age of head: 35-44 |
0.029 | 0.168 | 0.027 | -0.212 | 0.149 | -0.089 | -0.152 | 0.237 | -0.010 |
| Age of head: 45-54 |
0.127 | 0.165 | -0.050 | -0.423** | 0.170 | -0.101 | -0.323 | 0.246 | -0.022 |
| Age of head: 55-64 |
0.675** | 0.188 | 0.065 | -0.767** | 0.240 | 1.391 | 0.003 | 0.281 | -0.079 |
| Age of head: 65-74 |
1.125** | 0.219 | 0.069 | -0.886** | 0.323 | 0.026 | 0.449 | 0.320 | -0.116 |
| Age of head: 75 and over |
0.924** | 0.241 | 0.003 | -2.733** | 0.639 | -0.003 | -0.348 | 0.395 | -0.217 |
| Education: High school |
0.878** | 0.184 | -0.065 | -0.051 | 0.215 | 0.016 | 0.831** | 0.408 | 0.059 |
| Education: Some college |
1.308** | 0.195 | -0.056 | 0.566** | 0.221 | 0.003 | 1.375** | 0.415 | -0.031 |
| Education: College degree |
1.995** | 0.188 | -0.110 | 0.630** | 0.217 | 0.028 | 2.346** | 0.390 | -0.046 |
| No. of children | -0.246** | 0.048 | 0.568 | -0.057 | 0.052 | 0.106 | -0.286** | 0.075 | 0.074 |
| Unmarried | -0.150 | 0.145 | -0.001 | -0.077 | 0.177 | 0.038 | -0.058 | 0.217 | 0.016 |
| Female | -0.119 | 0.165 | 0.004 | 0.066 | 0.191 | -0.024 | -0.503 | 0.282 | -0.029 |
| Nonwhite | -0.719** | 0.143 | 0.139 | -0.028 | 0.139 | 0.042 | -0.986** | 0.263 | -0.002 |
| Self-employed | 0.375** | 0.119 | 0.013 | -0.086 | 0.160 | 0.030 | 0.287 | 0.173 | 0.021 |
| Retired | 0.565** | 0.180 | 0.022 | -0.021 | 0.270 | 0.054 | 0.579 | 0.280 | -0.006 |
| Yrs. with employer | 0.009 | 0.006 | 0.113 | -0.010 | 0.008 | -0.018 | 0.001 | 0.008 | -0.020 |
| (less than one) | -0.558** | 0.263 | 0.007 | 0.008 | 0.207 | 0.014 | -0.376 | 0.380 | 0.000 |
| Does not own home | -0.582** | 0.131 | -0.003 | -0.134 | 0.134 | -0.007 | -0.135 | 0.204 | 0.003 |
| Intercept | -6.735** | 2.417 | -0.006 | -9.922** | 3.762 | 0.011 | -17.144** | 4.226 | -0.499 |
| Pseudo R2 | 0.328 | ||||||||
| Likelihood ratio | 3666.3 | ||||||||
| No. of observations | 1410 | 442 | 306 | ||||||
| Pred. prob. at data means | 0.151 | 0.262 | 0.069 |
Table 7(e): Debit vs. convenience user, 1998
| Do not use debit, conv. Estimate |
Do not use debit, conv. Std. error |
Do not use debit, conv. Marg. eff. |
Use debit, not conv. Estimate |
Use debit, not conv. Std. error |
Use debit, not conv. Marg. eff. |
Use debit and conv. Estimate |
Use debit and conv. Std. error |
Use debit and conv. Marg. eff. |
|
|---|---|---|---|---|---|---|---|---|---|
| Income, log | 0.484 | 0.594 | 0.074 | 0.384 | 0.407 | 0.000 | -0.255 | 0.613 | 0.097 |
| (Income, log)2 | 0.019 | 0.026 | 0.145 | -0.007 | 0.019 | 0.252 | 0.046 | 0.026 | 0.282 |
| Age of head: 35-44 |
0.167 | 0.200 | -0.036 | -0.332** | 0.129 | -0.104 | -0.305 | 0.204 | -0.036 |
| Age of head: 45-54 |
0.147 | 0.203 | -0.043 | -0.489** | 0.145 | -0.050 | -0.531** | 0.213 | -0.042 |
| Age of head: 55-64 |
0.496** | 0.221 | 0.101 | -0.750** | 0.179 | -1.024 | -0.656** | 0.251 | -0.095 |
| Age of head: 65-74 |
0.869** | 0.254 | 0.152 | -0.884** | 0.242 | 0.050 | -0.152 | 0.296 | -0.183 |
| Age of head: 75 and over |
0.755** | 0.280 | 0.003 | -2.120** | 0.365 | -0.006 | -1.157** | 0.393 | -0.276 |
| Education: High school |
0.827** | 0.209 | -0.056 | 0.472** | 0.166 | 0.018 | 0.892** | 0.375 | 0.071 |
| Education: Some college |
0.857** | 0.226 | -0.044 | 0.767** | 0.176 | -0.004 | 1.313** | 0.381 | -0.057 |
| Education: College degree |
1.697** | 0.211 | -0.152 | 0.892** | 0.173 | 0.038 | 2.198** | 0.366 | -0.131 |
| No. of children | -0.105** | 0.052 | 0.494 | 0.030 | 0.043 | 0.032 | -0.085 | 0.062 | -0.041 |
| Unmarried | 0.175 | 0.153 | -0.002 | -0.025 | 0.139 | 0.038 | -0.113 | 0.201 | 0.070 |
| Female | -0.295 | 0.174 | -0.013 | 0.015 | 0.145 | -0.006 | -0.258 | 0.239 | -0.023 |
| Nonwhite | -0.752** | 0.160 | 0.478 | -0.313** | 0.112 | -0.053 | -0.849** | 0.206 | 0.003 |
| Self-employed | 0.136 | 0.126 | -0.010 | -0.450** | 0.132 | -0.041 | -0.274 | 0.153 | 0.017 |
| Retired | 0.819** | 0.201 | 0.039 | -0.295 | 0.201 | 0.066 | 0.369 | 0.261 | -0.004 |
| Yrs. with employer | 0.004 | 0.006 | 0.023 | -0.016** | 0.006 | -0.016 | -0.003 | 0.007 | 0.049 |
| (less than one ) | -0.420 | 0.318 | -0.009 | 0.117 | 0.175 | 0.009 | 0.116 | 0.296 | 0.000 |
| Does not own home | -0.449** | 0.142 | -0.017 | 0.026 | 0.111 | -0.026 | -0.475** | 0.185 | -0.039 |
| Intercept | -9.546** | 3.435 | 0.020 | -3.724 | 2.201 | -0.017 | -4.812 | 3.595 | 0.134 |
| Pseudo R2 | 0.253 | ||||||||
| Likelihood ratio | 2855.2 | ||||||||
| No. of observations | 1253 | 886 | 452 | ||||||
| Pred. prob. at data means | 0.160 | 0.265 | 0.072 |
Table 7(f): Debit vs. convenience user, 2001
| Do not use debit, conv. Estimate |
Do not use debit, conv. Std. error |
Do not use debit, conv. Marg. eff. |
Use debit, not conv. Estimate |
Use debit, not conv. Std. error |
Use debit, not conv. Marg. eff. |
Use debit and conv. Estimate |
Use debit and conv. Std. error |
Use debit and conv. Marg. eff. |
|
|---|---|---|---|---|---|---|---|---|---|
| Income, log | 1.212** | 0.506 | -0.206 | 2.696** | 0.507 | 0.011 | 1.816** | 0.557 | 0.140 |
| (Income, log)2 | -0.022 | 0.021 | 0.208 | -0.112** | 0.023 | 0.288 | -0.048** | 0.023 | 0.427 |
| Age of head: 35-44 |
0.442 | 0.231 | -0.016 | -0.348** | 0.135 | -0.030 | -0.344 | 0.191 | -0.070 |
| Age of head: 45-54 |
0.718** | 0.224 | -0.099 | -0.322** | 0.143 | -0.093 | -0.443** | 0.195 | -0.088 |
| Age of head: 55-64 |
0.824 | 0.243 | 0.112 | -0.695 | 0.175 | 0.621 | -0.699 | 0.231 | -0.144 |
| Age of head: 65-74 |
1.146** | 0.273 | 0.070 | -1.407** | 0.245 | 0.231 | -0.827** | 0.279 | -0.314 |
| Age of head: 75 and over |
0.912** | 0.293 | 0.001 | -1.752** | 0.279 | -0.015 | -1.674** | 0.333 | -0.258 |
| Education: High school |
0.740** | 0.212 | -0.085 | 0.236 | 0.150 | 0.016 | 0.577** | 0.277 | 0.180 |
| Education: Some college |
0.934** | 0.228 | -0.082 | 0.638** | 0.164 | -0.028 | 1.151** | 0.285 | -0.080 |
| Education: College degree |
1.736** | 0.216 | -0.204 | 0.769** | 0.163 | 0.027 | 1.876** | 0.272 | -0.161 |
| No. of children | -0.154** | 0.054 | 0.503 | -0.050 | 0.041 | 0.062 | -0.124** | 0.056 | 0.001 |
| Unmarried | 0.003 | 0.162 | -0.002 | -0.164 | 0.139 | 0.019 | -0.003 | 0.180 | 0.157 |
| Female | -0.084 | 0.184 | 0.008 | 0.050 | 0.147 | -0.009 | -0.091 | 0.207 | -0.039 |
| Nonwhite | -0.818** | 0.170 | -0.316 | 0.183 | 0.108 | -0.010 | -0.712** | 0.181 | 0.002 |
| Self-employed | 0.518** | 0.138 | -0.077 | -0.157 | 0.136 | -0.131 | -0.010 | 0.151 | 0.013 |
| Retired | 0.371 | 0.206 | 0.034 | -0.414** | 0.195 | 0.069 | 0.425 | 0.235 | -0.002 |
| Yrs. with employer | -0.009 | 0.006 | 0.091 | -0.020** | 0.006 | -0.013 | -0.012 | 0.007 | 0.017 |
| (less than one) | -0.410 | 0.304 | -0.021 | -0.227 | 0.180 | 0.047 | -0.238 | 0.274 | 0.000 |
| Does not own home | -0.456** | 0.154 | -0.044 | 0.405** | 0.109 | -0.066 | -0.407** | 0.166 | -0.080 |
| Intercept | -12.413** | 3.005 | 0.009 | -15.624** | 2.838 | -0.036 | -15.053** | 3.352 | -0.146 |
| Pseudo R2 | 0.226 | ||||||||
| Likelihood ratio | 2643.6 | ||||||||
| No. of observations | 1202 | 1246 | 665 | ||||||
| Pred. prob. at data means | 0.148 | 0.390 | 0.120 |
Table 7(g): Debit vs. direct payment, 1995
| Do not use debit, use dir. Estimate |
Do not use debit, use dir. Std. error |
Do not use debit, use dir. Marg. eff. |
Use debit, do not use dir. Estimate |
Use debit, do not use dir. Std. error |
Use debit, do not use dir. Marg. eff. |
Use debit and dir. Estimate |
Use debit and dir. Std. error |
Use debit and dir. Marg. eff. |
|
|---|---|---|---|---|---|---|---|---|---|
| Income | 0.882** | 0.334 | -0.140 | 1.326** | 0.441 | 0.005 | 2.741** | 0.754 | 0.36 |
| (Income, log)2 | -0.036 | 0.014 | 0.063 | -0.053 | 0.018 | 0.065 | -0.110 | 0.031 | 0.062 |
| Age of head: 35-44 |
0.061 | 0.147 | 0.056 | -0.120 | 0.152 | -0.054 | -0.328 | 0.208 | 0.001 |
| Age of head: 45-54 |
0.025 | 0.152 | 0.009 | -0.412** | 0.169 | -0.068 | -0.521** | 0.221 | -0.013 |
| Age of head: 55-64 |
-0.331 | 0.179 | 0.008 | -0.816** | 0.214 | 0.895 | -0.910** | 0.270 | -0.015 |
| Age of head: 65-74 |
-0.469** | 0.206 | 0.008 | -0.771** | 0.250 | -0.040 | -1.166** | 0.330 | 0.006 |
| Age of head: 75 and over |
-0.811** | 0.246 | 0.000 | -1.588** | 0.337 | 0.002 | -2.489** | 0.540 | 0.006 |
| Education: High school |
0.232 | 0.177 | -0.010 | 0.021 | 0.219 | 0.000 | 0.084 | 0.352 | 0.052 |
| Education: Some college |
0.524** | 0.188 | 0.005 | 0.600** | 0.223 | 0.004 | 0.533 | 0.362 | 0.006 |
| Education: College degree |
0.600** | 0.177 | -0.014 | 0.597** | 0.216 | -0.006 | 0.927** | 0.341 | -0.008 |
| No. of children | 0.018 | 0.043 | 0.154 | -0.026 | 0.052 | 0.022 | -0.065 | 0.069 | -0.002 |
| Unmarried | -0.419** | 0.157 | -0.001 | -0.139 | 0.166 | -0.001 | 0.035 | 0.215 | 0.058 |
| Female | 0.410** | 0.175 | 0.014 | 0.061 | 0.187 | -0.016 | -0.121 | 0.263 | -0.031 |
| Nonwhite | -0.296** | 0.133 | 0.273 | 0.108 | 0.138 | 0.068 | -0.829** | 0.256 | -0.003 |
| Self-employed | -0.078 | 0.113 | -0.025 | -0.085 | 0.140 | -0.055 | -0.209 | 0.174 | -0.003 |
| Retired | 0.062 | 0.177 | 0.000 | -0.041 | 0.227 | 0.015 | 0.019 | 0.301 | -0.003 |
| Yrs. with employer | -0.005 | 0.005 | -0.022 | -0.013 | 0.007 | 0.008 | -0.005 | 0.009 | -0.047 |
| (less than one) | -0.411 | 0.239 | -0.005 | -0.130 | 0.220 | -0.001 | 0.170 | 0.293 | 0.000 |
| Does not own home | -0.834** | 0.134 | -0.013 | 0.037 | 0.133 | -0.014 | -0.607** | 0.204 | -0.015 |
| Intercept | -6.414** | 2.014 | 0.020 | -9.466** | 2.629 | -0.010 | -18.647** | 4.557 | -0.552 |
| Pseudo R2 | 0.286 | ||||||||
| Likelihood ratio | 3194.7 | ||||||||
| No. of observations | 764 | 483 | 265 | ||||||
| Pred. prob. at data means | 0.172 | 0.117 | 0.047 |
Table 7(h): Debit vs. direct payment, 1998
| Do not use debit, use dir. Estimate |
Do not use debit, use dir. Std. error |
Do not use debit, use dir. Marg. eff. |
Use debit, do not use dir. Estimate |
Use debit, do not use dir. Std. error |
Use debit, do not use dir. Marg. eff. |
Use debit and dir. Estimate |
Use debit and dir. Std. error |
Use debit and dir. Marg. eff. |
|
|---|---|---|---|---|---|---|---|---|---|
| Income, log | 0.861** | 0.295 | -0.028 | 0.578 | 0.295 | 0.001 | 1.409** | 0.390 | 0.065 |
| (Income, log)2 | -0.034** | 0.012 | 0.103 | -0.026** | 0.012 | 0.167 | -0.056** | 0.016 | 0.164 |
| Age of head: 35-44 |
0.080 | 0.161 | -0.001 | -0.259 | 0.144 | -0.060 | -0.400** | 0.152 | -0.012 |
| Age of head: 45-54 |
0.194 | 0.163 | 0.033 | -0.372** | 0.156 | -0.049 | -0.543** | 0.163 | -0.023 |
| Age of head: 55-64 |
0.208 | 0.180 | 0.057 | -0.633** | 0.185 | 0.082 | -1.091** | 0.204 | -0.023 |
| Age of head: 65-74 |
0.178 | 0.209 | 0.051 | -0.752** | 0.232 | -0.064 | -1.023** | 0.249 | -0.036 |
| Age of head: 75 and over |
0.009 | 0.232 | 0.001 | -1.795** | 0.336 | 0.002 | -2.159** | 0.373 | -0.083 |
| Education: High school |
0.487** | 0.168 | 0.028 | 0.669** | 0.190 | -0.003 | 0.341 | 0.229 | -0.022 |
| Education: Some college |
0.807** | 0.181 | -0.018 | 0.825** | 0.203 | 0.005 | 1.130** | 0.233 | 0.002 |
| Education: College degree |
0.810** | 0.172 | -0.016 | 0.853** | 0.195 | -0.006 | 1.138** | 0.224 | -0.026 |
| No. of children | -0.035 | 0.045 | 0.307 | -0.014 | 0.047 | -0.001 | 0.047 | 0.047 | -0.028 |
| Unmarried | -0.098 | 0.134 | 0.000 | -0.112 | 0.144 | 0.025 | -0.206 | 0.161 | 0.064 |
| Female | 0.048 | 0.151 | -0.010 | 0.015 | 0.156 | 0.007 | 0.096 | 0.179 | -0.003 |
| Nonwhite | -0.035 | 0.124 | 0.457 | -0.314** | 0.129 | 0.075 | -0.204 | 0.139 | -0.002 |
| Self-employed | -0.149 | 0.109 | -0.079 | -0.389** | 0.128 | -0.127 | -0.659** | 0.130 | -0.025 |
| Retired | -0.147 | 0.166 | 0.034 | -0.532** | 0.201 | 0.031 | -0.471** | 0.221 | 0.007 |
| Yrs. with employer | -0.005 | 0.005 | -0.026 | -0.014** | 0.006 | -0.008 | -0.014 | 0.006 | 0.010 |
| (less than one) | -0.287 | 0.247 | -0.040 | 0.115 | 0.194 | -0.015 | 0.085 | 0.215 | 0.000 |
| Does not own home | -0.462** | 0.123 | -0.033 | 0.114 | 0.121 | -0.047 | -0.421** | 0.138 | -0.091 |
| Intercept | -6.411** | 1.802 | 0.018 | -3.978** | 1.747 | -0.025 | -9.415** | 2.358 | -0.377 |
| Pseudo R2 | 0.121 | ||||||||
| Likelihood ratio | 1367.8 | ||||||||
| No. of observations | 945 | 700 | 638 | ||||||
| Pred. prob. at data means | 0.222 | 0.179 | 0.141 |
Table 7(i): Debit vs. direct payment, 2001
| Do not use debit, use dir. Estimate |
Do not use debit, use dir. Std. error |
Do not use debit, use dir. Marg. eff. |
Use debit, do not use dir. Estimate |
Use debit, do not use dir. Std. error |
Use debit, do not use dir. Marg. eff. |
Use debit and dir. Estimate |
Use debit and dir. Std. error |
Use debit and dir. Marg. eff. |
|
|---|---|---|---|---|---|---|---|---|---|
| Income, log | 1.869** | 0.338 | -0.077 | 1.753** | 0.344 | 0.004 | 3.106** | 0.395 | 0.075 |
| (Income, log)2 | -0.071** | 0.013 | 0.103 | -0.074** | 0.014 | 0.139 | -0.123** | 0.016 | 0.223 |
| Age of head: 35-44 |
0.187 | 0.193 | 0.024 | -0.406** | 0.147 | 0.028 | -0.306** | 0.152 | -0.049 |
| Age of head: 45-54 |
0.197 | 0.191 | -0.046 | -0.587** | 0.153 | -0.132 | -0.457** | 0.156 | -0.062 |
| Age of head: 55-64 |
-0.072 | 0.209 | 0.057 | -1.097** | 0.181 | 0.292 | -0.982** | 0.183 | -0.080 |
| Age of head: 65-74 |
-0.032 | 0.234 | 0.041 | -1.423** | 0.226 | -0.118 | -1.793** | 0.243 | -0.071 |
| Age of head: 75 and over |
-0.020 | 0.252 | 0.001 | -2.013** | 0.275 | 0.004 | -2.122** | 0.288 | -0.130 |
| Education: High school |
0.308 | 0.178 | -0.021 | 0.167 | 0.163 | -0.007 | 0.420** | 0.201 | 0.064 |
| Education: Some college |
0.601** | 0.194 | -0.036 | 0.541** | 0.178 | -0.015 | 1.059 | 0.211 | -0.015 |
| Education: College degree |
0.699** | 0.180 | -0.052 | 0.477** | 0.170 | -0.017 | 1.058** | 0.202 | -0.024 |
| No. of children | 0.044 | 0.047 | 0.299 | -0.016 | 0.044 | 0.007 | 0.014 | 0.044 | -0.028 |
| Unmarried | -0.042 | 0.147 | 0.001 | -0.153 | 0.141 | 0.001 | -0.051 | 0.146 | 0.110 |
| Female | 0.269 | 0.168 | 0.005 | 0.079 | 0.154 | -0.008 | 0.121 | 0.163 | -0.015 |
| Nonwhite | -0.249 | 0.145 | 0.890 | 0.259** | 0.117 | 0.215 | -0.076 | 0.130 | -0.008 |
| Self-employed | -0.058 | 0.120 | -0.172 | -0.388** | 0.128 | -0.175 | -0.534** | 0.124 | 0.036 |
| Retired | 0.071 | 0.179 | 0.066 | -0.230 | 0.190 | 0.068 | -0.226 | 0.195 | -0.001 |
| Yrs. with employer | -0.008 | 0.005 | -0.008 | -0.008 | 0.006 | 0.006 | -0.023** | 0.006 | 0.008 |
| (less than one) | 0.111 | 0.250 | -0.048 | 0.010 | 0.200 | -0.014 | -0.183 | 0.216 | -0.002 |
| Does not own home | -0.863** | 0.146 | -0.036 | 0.241** | 0.116 | -0.038 | -0.142 | 0.125 | -0.062 |
| Intercept | -12.706** | 2.104 | -0.039 | -10.041** | 2.069 | 0.031 | -19.142** | 2.413 | -1.209 |
| Pseudo R2 | 0.103 | ||||||||
| Likelihood ratio 1204.9 | |||||||||
| No. of observations | 910 | 931 | 980 | ||||||
| Pred. prob. at data means | 0.182 | 0.254 | 0.233 |
Table 7(j): Debit vs. check, 1998
| Do not use debit, use check Estimate |
Do not use debit, use check Std. error |
Do not use debit, use check Marg. eff. |
Use debit, do not use check Estimate |
Use debit, do not use check Std. error |
Use debit, do not use check Marg. eff. |
Use debit and check Estimate |
Use debit and check Std. error |
Use debit and check Marg. eff. |
|
|---|---|---|---|---|---|---|---|---|---|
| Income, log | 0.557** | 0.250 | -0.134 | 0.643 | 0.520 | 0.004 | 1.083** | 0.314 | 0.103 |
| (Income, log)2 | -0.022** | 0.010 | 0.190 | -0.026 | 0.022 | 0.282 | -0.044** | 0.013 | 0.313 |
| Age of head: 35-44 |
-0.231 | 0.170 | -0.049 | -0.517 | 0.268 | -0.077 | -0.522 | 0.173 | -0.005 |
| Age of head: 45-54 |
0.038 | 0.181 | 0.039 | -0.530 | 0.299 | -0.097 | -0.470** | 0.189 | -0.009 |
| Age of head: 55-64 |
-0.044 | 0.201 | 0.176 | -0.676 | 0.346 | 0.984 | -0.991** | 0.219 | -0.004 |
| Age of head: 65-74 |
-0.198 | 0.231 | 0.110 | -1.154** | 0.435 | -0.008 | -1.071** | 0.259 | -0.014 |
| Age of head: 75 and over |
-0.142 | 0.256 | 0.003 | -2.121** | 0.602 | 0.000 | -2.061** | 0.345 | -0.030 |
| Education: High school |
0.424** | 0.155 | 0.011 | 0.906** | 0.350 | -0.001 | 0.682** | 0.195 | -0.002 |
| Education: Some college |
0.533** | 0.175 | 0.011 | 1.126** | 0.379 | 0.000 | 1.122** | 0.212 | -0.011 |
| Education: College degree |
0.667** | 0.162 | -0.001 | 0.920** | 0.366 | 0.008 | 1.301** | 0.200 | 0.005 |
| No. of children | 0.011 | 0.051 | 0.656 | 0.000 | 0.089 | -0.130 | 0.044 | 0.054 | -0.215 |
| Unmarried | -0.184 | 0.148 | 0.000 | -0.217 | 0.270 | -0.004 | -0.271 | 0.165 | 0.013 |
| Female | -0.138 | 0.156 | -0.010 | 0.112 | 0.280 | -0.018 | -0.098 | 0.175 | -0.013 |
| Nonwhite | -0.483** | 0.127 | -0.053 | -0.605** | 0.233 | 0.102 | -0.607** | 0.138 | -0.004 |
| Self-employed | 0.112 | 0.139 | -0.078 | -0.441 | 0.263 | -0.178 | -0.364** | 0.150 | 0.003 |
| Retired | 0.160 | 0.193 | 0.046 | 0.076 | 0.358 | 0.096 | -0.405 | 0.226 | 0.006 |
| Yrs. with employer | -0.003 | 0.006 | -0.159 | -0.007 | 0.012 | -0.003 | -0.016 | 0.007 | 0.019 |
| (less than one) | -0.507** | 0.226 | -0.040 | -0.445 | 0.376 | -0.101 | -0.130 | 0.221 | -0.002 |
| Does not own home | -0.407** | 0.123 | -0.030 | 0.042 | 0.223 | -0.041 | -0.335** | 0.138 | -0.123 |
| Intercept | -2.295 | 1.495 | 0.067 | -5.003 | 3.083 | -0.032 | -5.543** | 1.873 | -0.349 |
| Pseudo R2 | 0.248 | ||||||||
| Likelihood ratio 2798.5 | |||||||||
| No. of observations | 2135 | 180 | 1158 | ||||||
| Pred. prob. at data means | 0.524 | 0.047 | 0.278 |
Table 7(k): Debit vs. check, 2001
| Do not use debit, use check Estimate |
Do not use debit, use check Std. error |
Do not use debit, use check Marg. eff. |
Use debit, do not use check Estimate |
Use debit, do not use check Std. error |
Use debit, do not use check Marg. eff. |
Use debit and check Estimate |
Use debit and check Std. error |
Use debit and check Marg. eff. |
|
|---|---|---|---|---|---|---|---|---|---|
| Income, log | 0.051 | 0.320 | -0.382 | 0.764 | 0.528 | 0.016 | 2.001 | 0.384 | 0.095 |
| (Income, log)2 | -0.002 | 0.013 | 0.166 | -0.030 | 0.022 | 0.273 | -0.083 | 0.016 | 0.392 |
| Age of head: 35-44 |
0.622** | 0.215 | -0.020 | 0.626** | 0.251 | 0.064 | -0.047 | 0.204 | 0.016 |
| Age of head: 45-54 |
0.205 | 0.205 | -0.128 | -0.232 | 0.262 | -0.222 | -0.498** | 0.196 | -0.003 |
| Age of head: 55-64 |
0.066 | 0.227 | 0.112 | -0.726** | 0.322 | 2.513 | -1.017** | 0.224 | -0.011 |
| Age of head: 65-74 |
0.326 | 0.264 | 0.047 | -0.627 | 0.392 | -0.010 | -1.470** | 0.275 | -0.001 |
| Age of head: 75 and over |
0.242 | 0.275 | 0.003 | -1.617** | 0.501 | 0.000 | -1.930** | 0.302 | -0.036 |
| Education: High school |
0.411** | 0.171 | 0.013 | 0.673** | 0.272 | 0.003 | 0.427** | 0.188 | 0.025 |
| Education: Some college |
0.430** | 0.197 | 0.003 | 0.731** | 0.307 | 0.009 | 0.911** | 0.209 | -0.006 |
| Education: College degree |
0.695** | 0.182 | -0.004 | 0.755** | 0.297 | 0.004 | 1.061** | 0.197 | -0.004 |
| No. of children | -0.053 | 0.057 | 0.592 | 0.010 | 0.073 | -0.035 | -0.074 | 0.056 | -0.101 |
| Unmarried | -0.254 | 0.164 | 0.000 | -0.103 | 0.236 | -0.018 | -0.329 | 0.171 | 0.045 |
| Female | -0.133 | 0.175 | -0.037 | -0.038 | 0.245 | -0.002 | -0.092 | 0.182 | -0.027 |
| Nonwhite | -0.485** | 0.144 | -0.026 | 0.184 | 0.187 | 0.397 | -0.254 | 0.144 | -0.017 |
| Self-employed | 0.016 | 0.158 | -0.341 | -0.325 | 0.228 | -0.315 | -0.444** | 0.163 | -0.028 |
| Retired | -0.343 | 0.207 | 0.083 | -0.501 | 0.322 | 0.091 | -0.530** | 0.219 | -0.013 |
| Years w/ employer | -0.007 | 0.006 | -0.066 | -0.012 | 0.010 | -0.006 | -0.019** | 0.007 | -0.012 |
| (less than one) | -0.095 | 0.273 | -0.074 | -0.550 | 0.365 | -0.033 | -0.130 | 0.260 | -0.002 |
| Does not own home | -0.726 | 0.139 | -0.174 | 0.413** | 0.191 | -0.125 | -0.343** | 0.143 | -0.174 |
| Intercept | 0.924 | 1.936 | 0.055 | -5.385 | 3.182 | -0.049 | -9.936** | 2.317 | -1.900 |
| Pseudo R2 | 0.242 | ||||||||
| Likelihood ratio | 2831.6 | ||||||||
| No. of observations | 1841 | 294 | 1617 | ||||||
| Pred. prob. at data means | 0.409 | 0.067 | 0.418 |
Table 8: Nested logit inclusive values
Testing neither, either or both
| 1995 Estimate |
1995 Std. Error |
1998 Estimate |
1998 Std. Error |
2001 Estimate |
2001 Std. Error |
|
|---|---|---|---|---|---|---|
| Debit or credit | 0.6509 | 0.8450 | 0.7793 | 1.0185 | 1.2720 | 0.3293 |
| Debit or convenience user | 0.4812 | 0.2228 | 0.1943 | 0.1028 | 0.3175 | 0.0921 |
| Debit or check | 0.9349 | 0.3216 | 1.1231 | |||
| Debit or direct payment | 1.0052 | 0.8837 | 0.7022 | 0.4116 | 0.3720 | 0.5339 |
| Direct payment or check | 0.9726 | 0.9695 |
Figure 1(a)
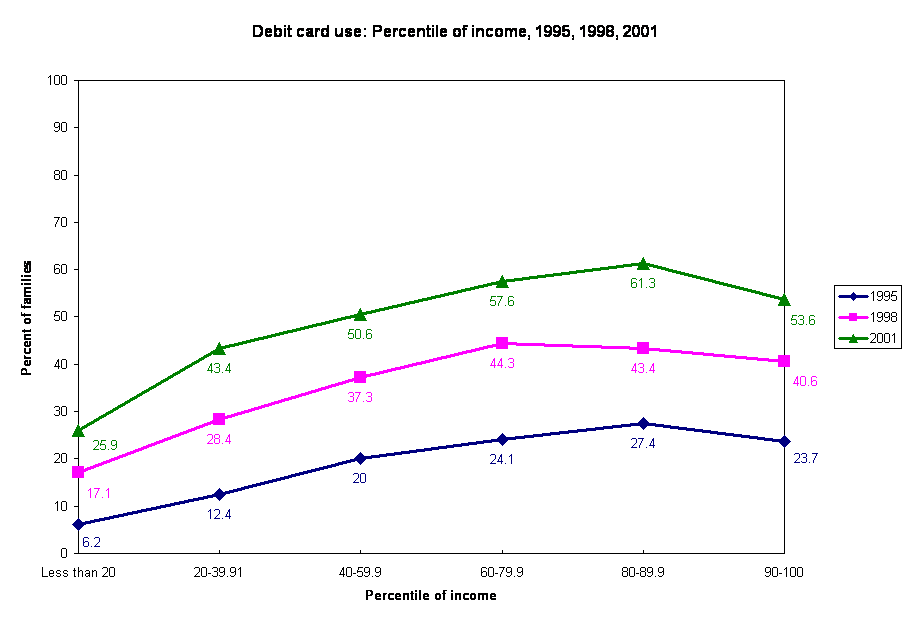 <
<
Figure 1(b)
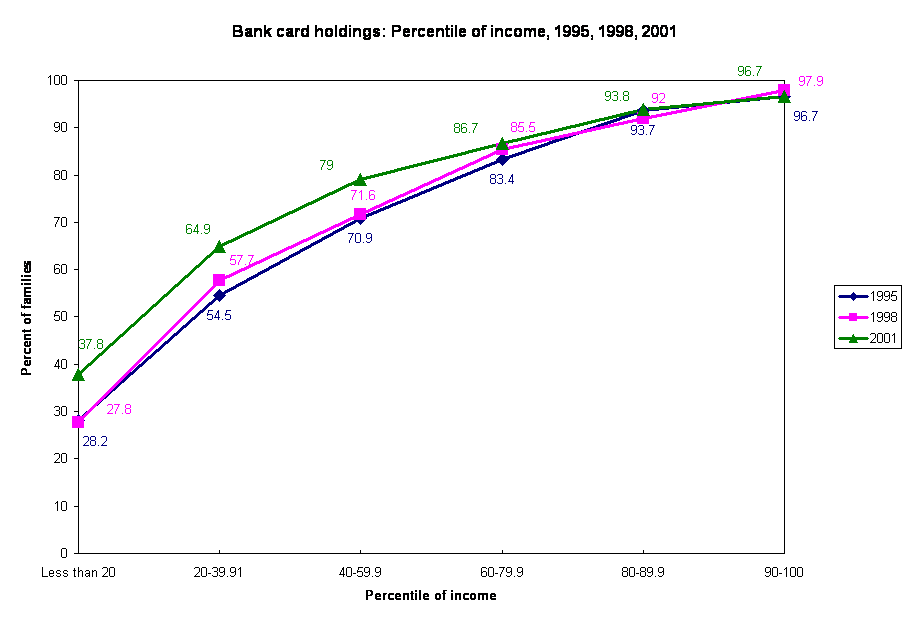
Figure 2(a)
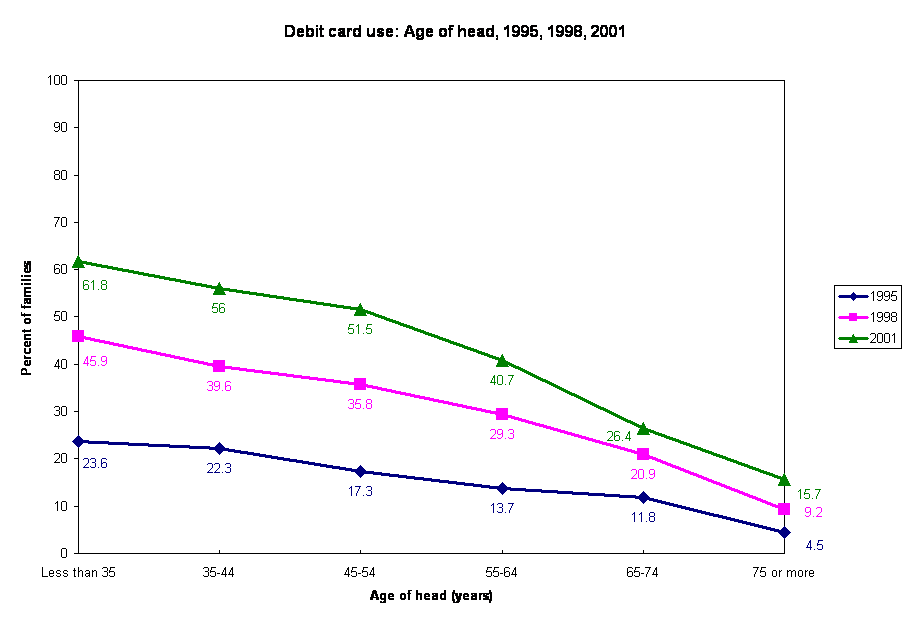 >
>
Figure 2(b)
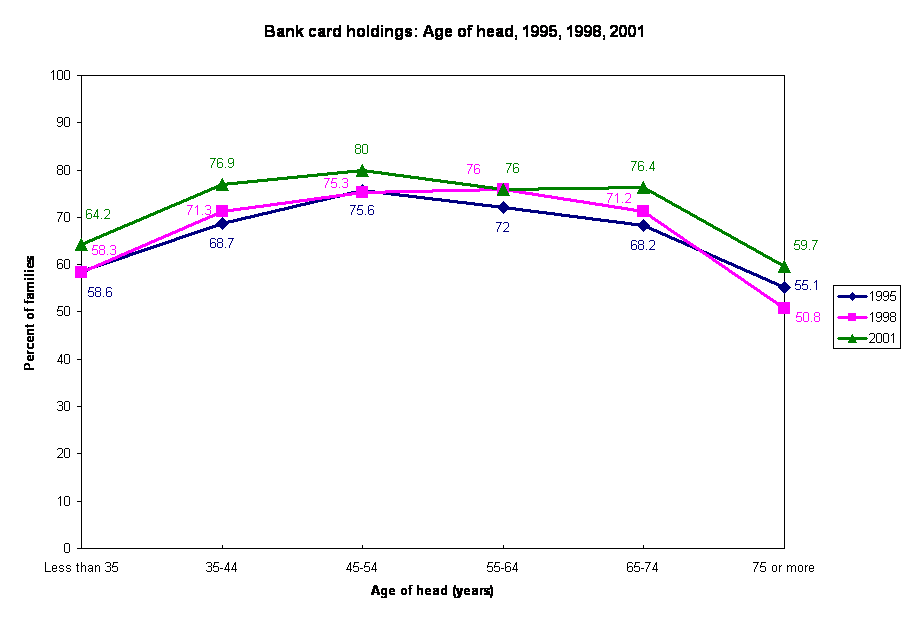
Bibliography
Footnotes
A** indicates that the estimated coefficient is significantly different from zero at the 95 percent confidence level.